Observational Study
. 2016 Nov 15;13(11):e1002170.
doi: 10.1371/journal.pmed.1002170. eCollection 2016 Nov.

Exposure Patterns Driving Ebola Transmission in West Africa: A Retrospective Observational Study

Affiliations
Observational Study

Exposure Patterns Driving Ebola Transmission in West Africa: A Retrospective Observational Study

International Ebola Response Team et al. PLoS Med. .

Abstract

Background: The ongoing West African Ebola epidemic began in December 2013 in Guinea, probably from a single zoonotic introduction. As a result of ineffective initial control efforts, an Ebola outbreak of unprecedented scale emerged. As of 4 May 2015, it had resulted in more than 19,000 probable and confirmed Ebola cases, mainly in Guinea (3,529), Liberia (5,343), and Sierra Leone (10,746). Here, we present analyses of data collected during the outbreak identifying drivers of transmission and highlighting areas where control could be improved.

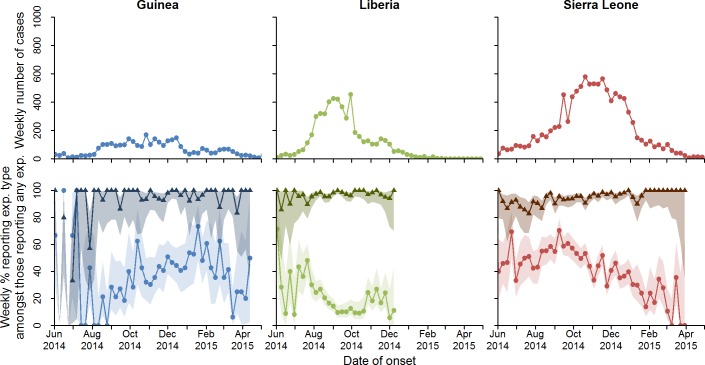
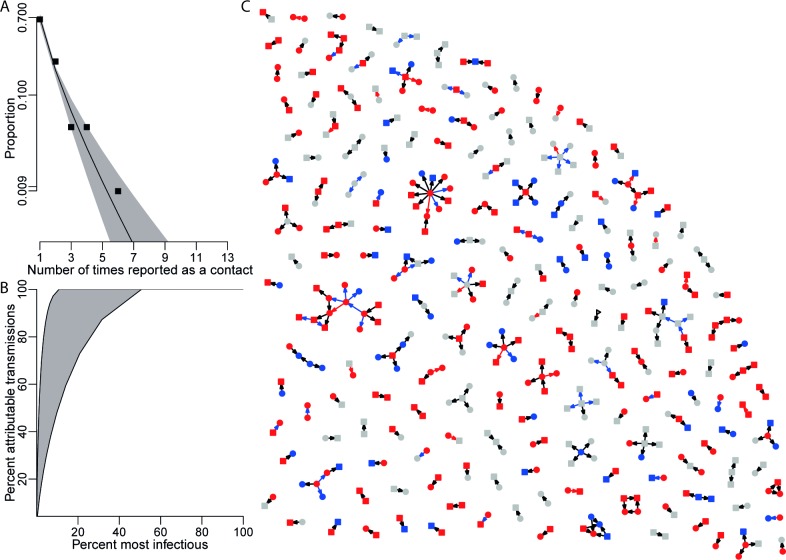
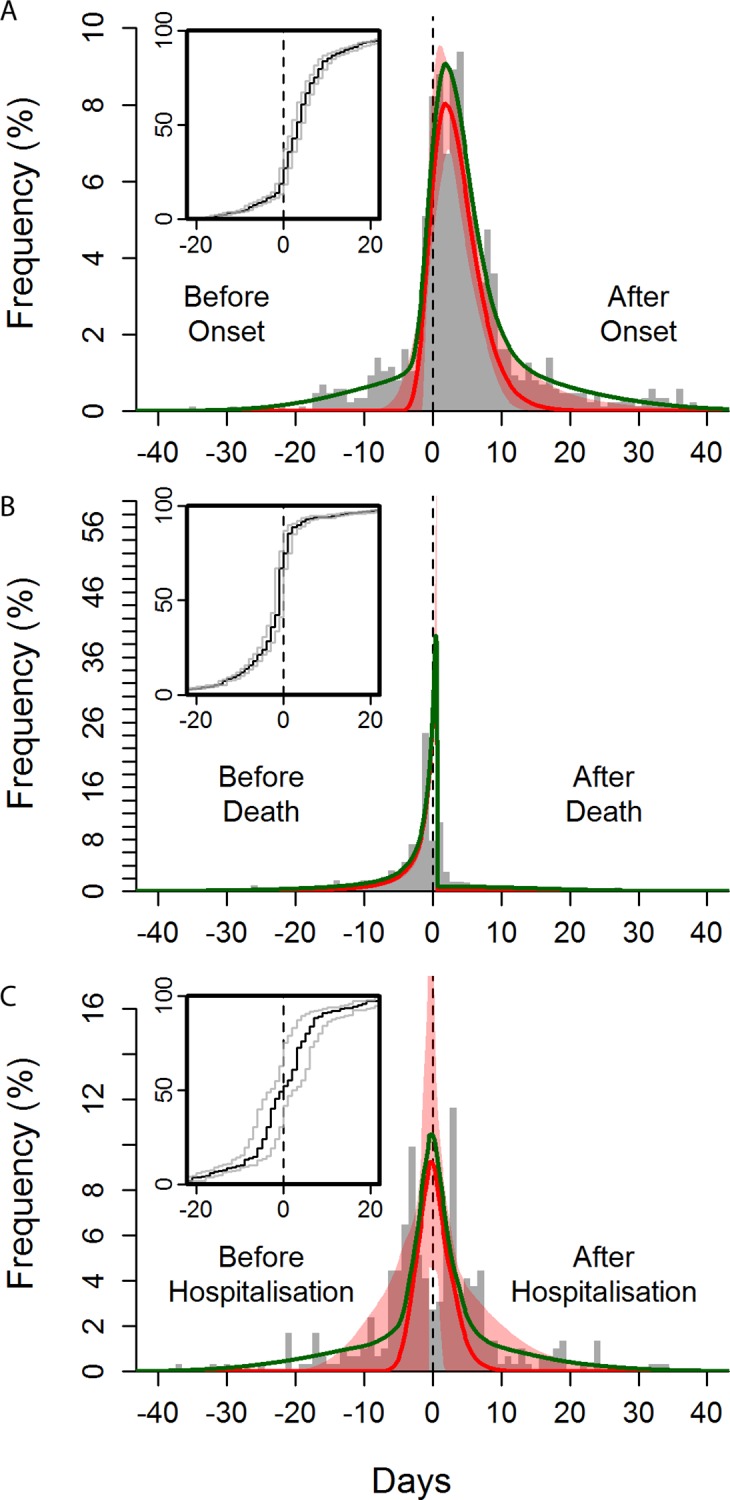
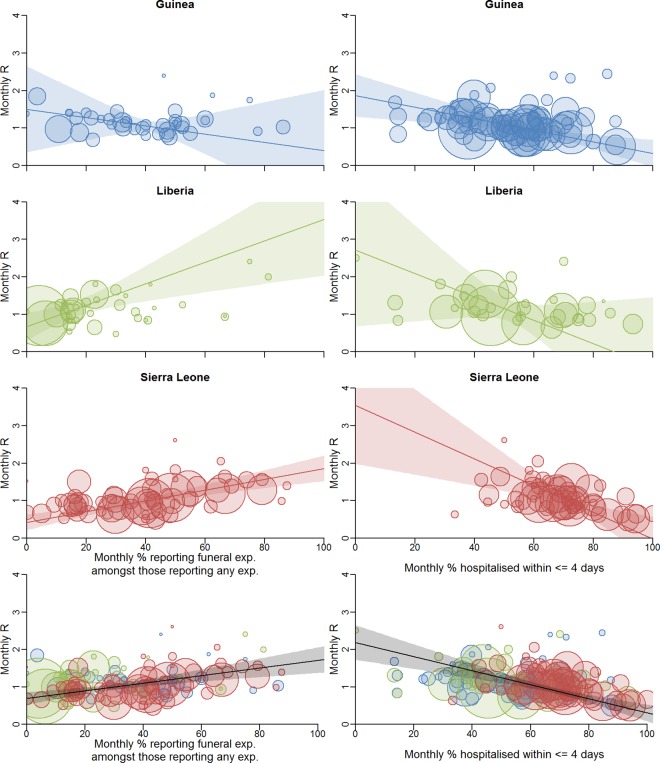
Methods and findings: Over 19,000 confirmed and probable Ebola cases were reported in West Africa by 4 May 2015. Individuals with confirmed or probable Ebola ("cases") were asked if they had exposure to other potential Ebola cases ("potential source contacts") in a funeral or non-funeral context prior to becoming ill. We performed retrospective analyses of a case line-list, collated from national databases of case investigation forms that have been reported to WHO. These analyses were initially performed to assist WHO's response during the epidemic, and have been updated for publication. We analysed data from 3,529 cases in Guinea, 5,343 in Liberia, and 10,746 in Sierra Leone; exposures were reported by 33% of cases. The proportion of cases reporting a funeral exposure decreased over time. We found a positive correlation (r = 0.35, p < 0.001) between this proportion in a given district for a given month and the within-district transmission intensity, quantified by the estimated reproduction number (R). We also found a negative correlation (r = -0.37, p < 0.001) between R and the district proportion of hospitalised cases admitted within ≤4 days of symptom onset. These two proportions were not correlated, suggesting that reduced funeral attendance and faster hospitalisation independently influenced local transmission intensity. We were able to identify 14% of potential source contacts as cases in the case line-list. Linking cases to the contacts who potentially infected them provided information on the transmission network. This revealed a high degree of heterogeneity in inferred transmissions, with only 20% of cases accounting for at least 73% of new infections, a phenomenon often called super-spreading. Multivariable regression models allowed us to identify predictors of being named as a potential source contact. These were similar for funeral and non-funeral contacts: severe symptoms, death, non-hospitalisation, older age, and travelling prior to symptom onset. Non-funeral exposures were strongly peaked around the death of the contact. There was evidence that hospitalisation reduced but did not eliminate onward exposures. We found that Ebola treatment units were better than other health care facilities at preventing exposure from hospitalised and deceased individuals. The principal limitation of our analysis is limited data quality, with cases not being entered into the database, cases not reporting exposures, or data being entered incorrectly (especially dates, and possible misclassifications).

Conclusions: Achieving elimination of Ebola is challenging, partly because of super-spreading. Safe funeral practices and fast hospitalisation contributed to the containment of this Ebola epidemic. Continued real-time data capture, reporting, and analysis are vital to track transmission patterns, inform resource deployment, and thus hasten and maintain elimination of the virus from the human population.


Conflict of interest statement

The authors have declared that no competing interests exist.

Figures

Fig 1
Fig 1. Total number of confirmed and probable cases by week, and percentage who reported funeral and non-funeral exposures.
Total number of confirmed and probable cases by week is shown in the top row. Percentage of cases who reported a non-funeral exposure (triangles) or a funeral exposure (circles) is shown in the second row. The shaded regions represent the 95% confidence intervals around the proportions. Note that cases can report more than one exposure, and so percentages need not add to 100%. exp., exposure.
Fig 2
Fig 2. Contact network.
(A) The out-degree distribution of the network of exposures shows the probability that a named contact is named as an exposure by a certain number of cases. The squares represent the observed data. The black line shows the maximum likelihood logarithmic distribution, with 95% confidence interval in grey. (B) The cumulative density function of the derived offspring distribution. The two black lines (edges) show two scenarios (see Figure q in S1 Text for details). (C) A sample of the network of all cases (see Figure p in S1 Text for full network) and the contacts they have named as having been exposed to. Individuals (cases and contacts) are shown as nodes, and exposures as directed arrows from contacts to cases. Arrows are red for funeral exposures, black for non-funeral exposures, and blue for multiple exposures involving both non-funeral and funeral exposures. Square nodes are males, round nodes females, and triangles unknown. Red nodes are cases who have died, blue nodes are cases who have survived, and grey nodes are cases with no recorded outcome.
Fig 3
Fig 3. Observed and fitted distribution of reported time to non-funeral exposure from symptom onset, hospitalisation, and death of the contact.
Time from symptom onset (A), death (B), and hospitalisation (C) of the contact to time of exposure. The green curves show the overall best fits, and the red curves show the best fits for the “signal” distribution (all obtained by maximum likelihood). The red-shaded areas indicate the 95% confidence intervals of the fitted “signal” distribution. The histogram shows a random set of exposure midpoints (in some instances, only a start or an end date of exposure is recorded; in those instances, the missing date is numerically imputed). Note that the fitting procedure is not performed on the midpoints but fully incorporates the exposure window (see section 1.8 in S1 Text). The inset panels are the observed cumulative distribution functions for the midpoint (black line) and start and end (grey lines) of the exposures.
Fig 4
Fig 4. Correlation between local transmission intensity and local population measures of presumed heightened risk of infection.
Correlation between local transmission intensity and proportion of cases reporting funeral exposures among those reporting any exposure (left) and proportion of cases hospitalised within ≤4 days of symptom onset among those hospitalised (right). The scatter plots show these monthly proportions against monthly estimated reproduction numbers R (method as previous [11]) for the supplemented incidence (i.e., incidence based on two data sources including the line-list, see [12]). Each point is a district-month. Trend lines are shown with 95% confidence intervals (shaded areas). We use a weighted regression method that takes account of the uncertainties in the data [20]. The area of each circle is proportional to the weight of that point (see section 1.7 in S1 Text). In the bottom row, the black trend line is for the whole dataset. See Figures j and l and Table d in S1 Text for details, including trend line parameters. exp., exposure.

References

    1. Gire SK, Goba A, Andersen KG, Sealfon RS, Park DJ, Kanneh L, et al. Genomic surveillance elucidates Ebola virus origin and transmission during the 2014 outbreak. Science. 2014;345(6202):1369–72. 10.1126/science.1259657 . - DOI - PMC - PubMed
    1. Baize S, Pannetier D, Oestereich L, Rieger T, Koivogui L, Magassouba N, et al. Emergence of Zaire Ebola virus disease in Guinea. N Engl J Med. 2014;371(15):1418–25. 10.1056/NEJMoa1404505 . - DOI - PubMed
    1. Borchert M, Mutyaba I, Van Kerkhove MD, Lutwama J, Luwaga H, Bisoborwa G, et al. Ebola haemorrhagic fever outbreak in Masindi District, Uganda: outbreak description and lessons learned. BMC Infect Dis. 2011;11:357 10.1186/1471-2334-11-357 - DOI - PMC - PubMed
    1. Breman J, Piot P, Johnson K, White M, Mbuyi M, Sureau P, et al. The epidemiology of Ebola hemorrhagic fever in Zaire, 1976 In: Pattyn SR, editor. Ebola virus haemorrhagic fever. Amsterdam: Elsevier; 1978. pp. 103–24.
    1. Commission International. Ebola haemorrhagic fever in Zaire, 1976. Bull World Health Organ. 1978;56(2):271–93. - PMC - PubMed

Publication types