. 2016 Nov 14;30(5):764-778.
doi: 10.1016/j.ccell.2016.10.002.

A Druggable TCF4- and BRD4-Dependent Transcriptional Network Sustains Malignancy in Blastic Plasmacytoid Dendritic Cell Neoplasm

Affiliations

A Druggable TCF4- and BRD4-Dependent Transcriptional Network Sustains Malignancy in Blastic Plasmacytoid Dendritic Cell Neoplasm

Michele Ceribelli et al. Cancer Cell. .

Abstract

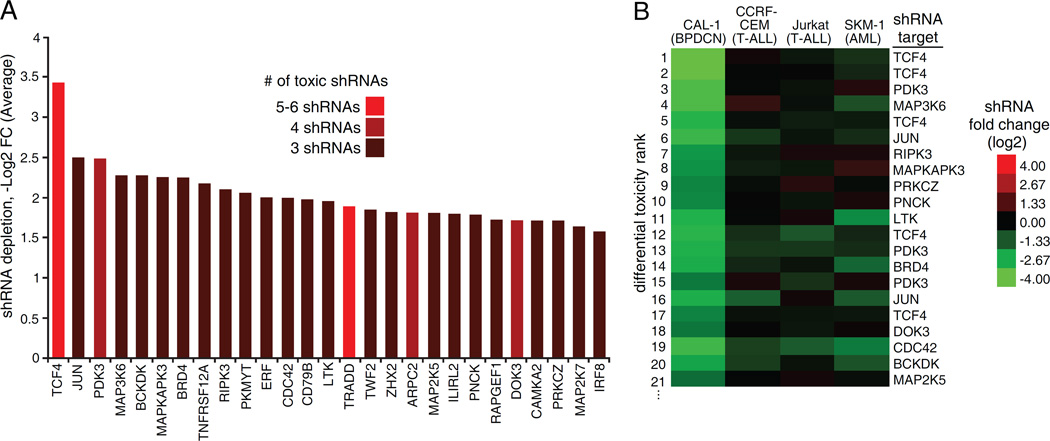
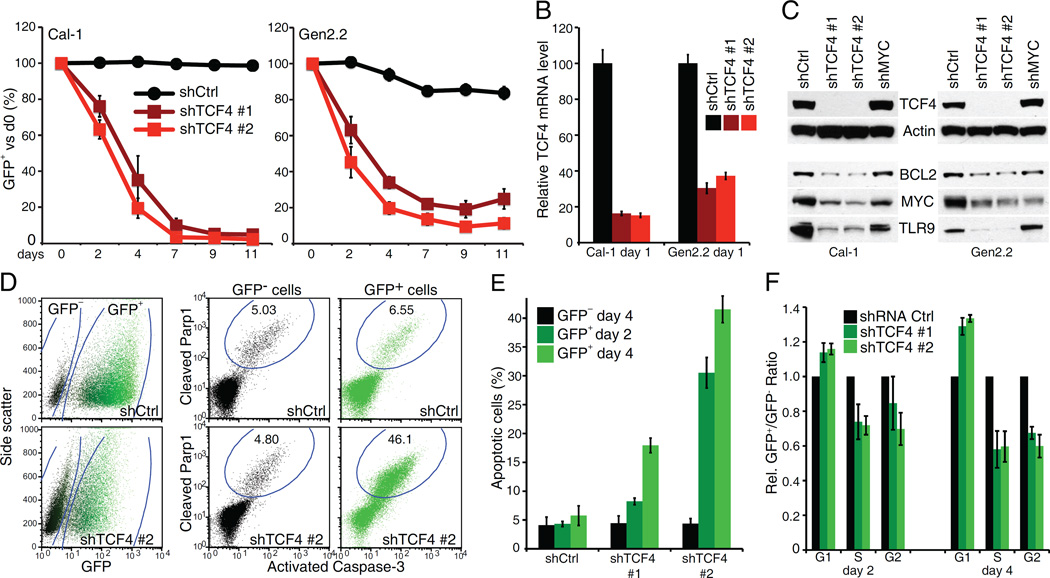
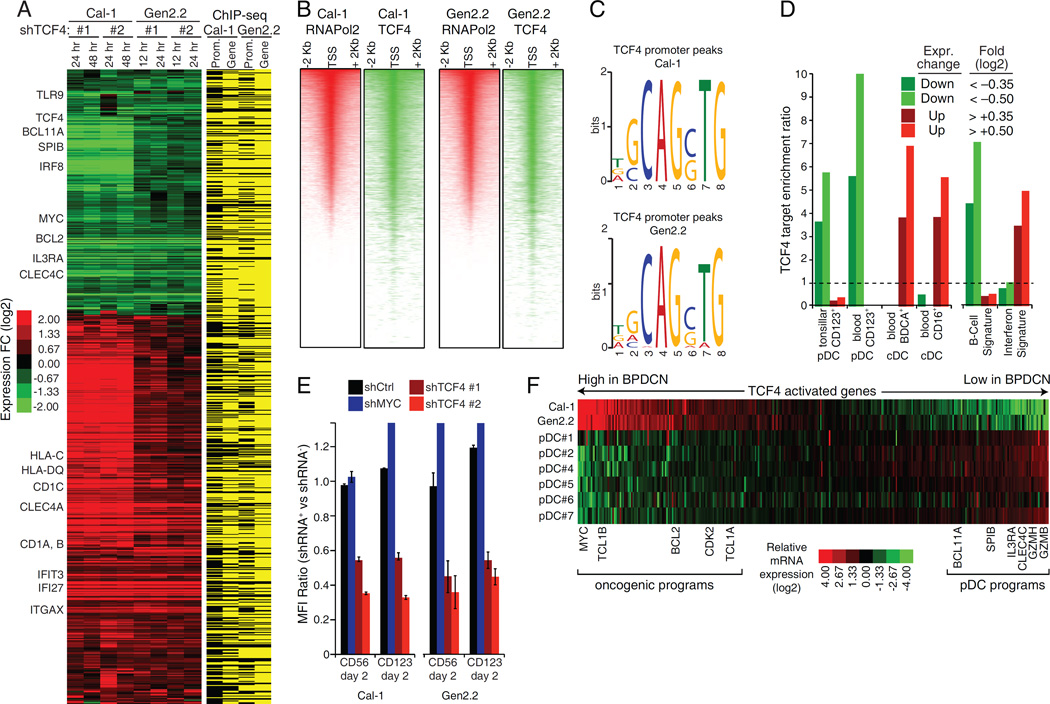
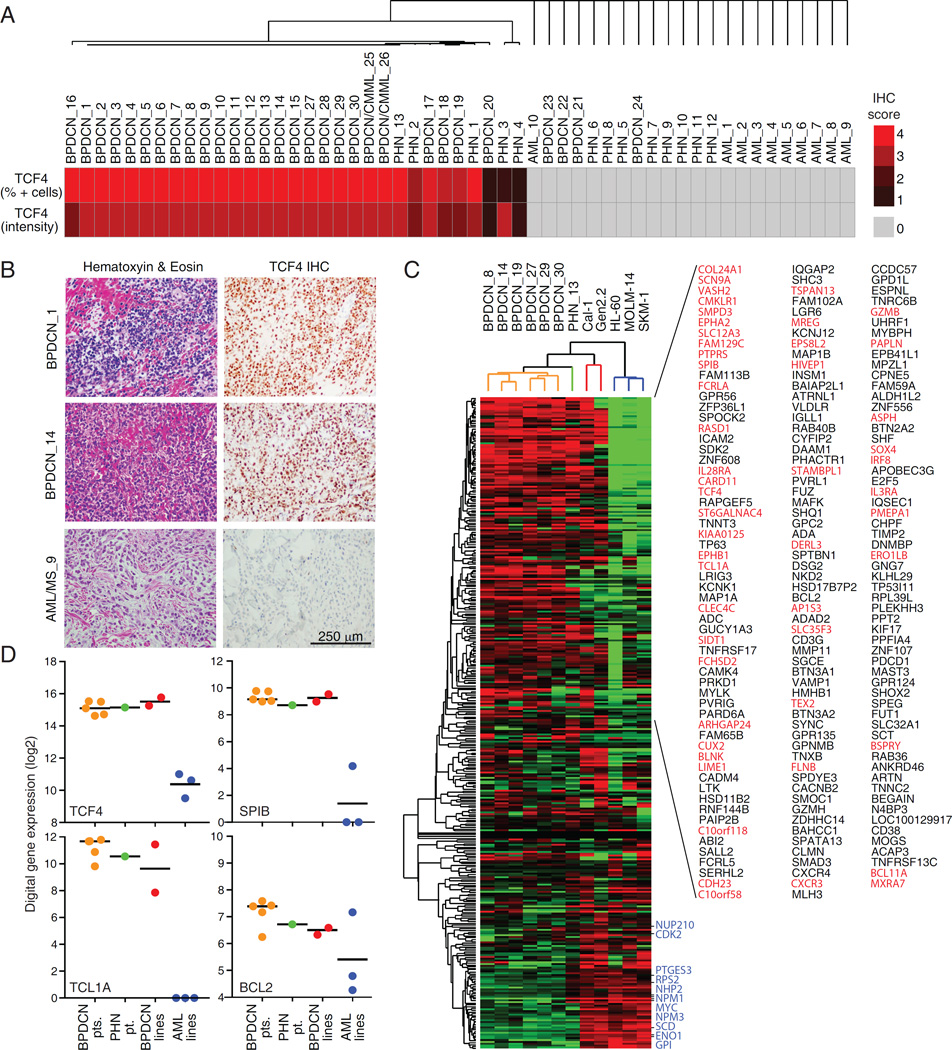
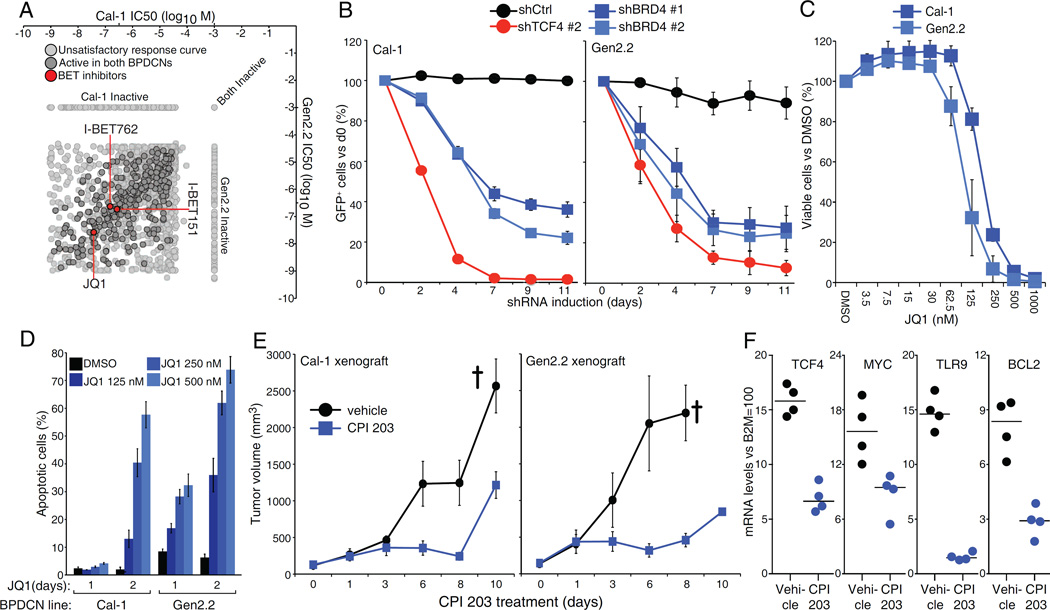
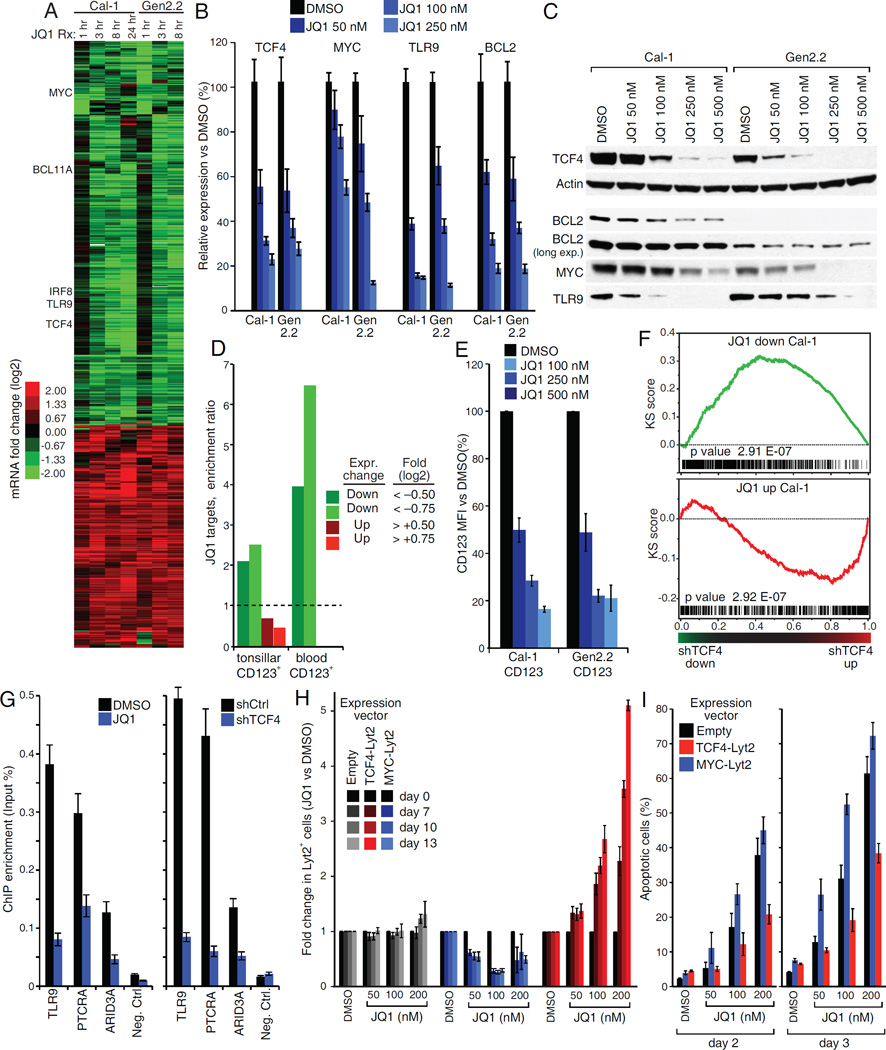
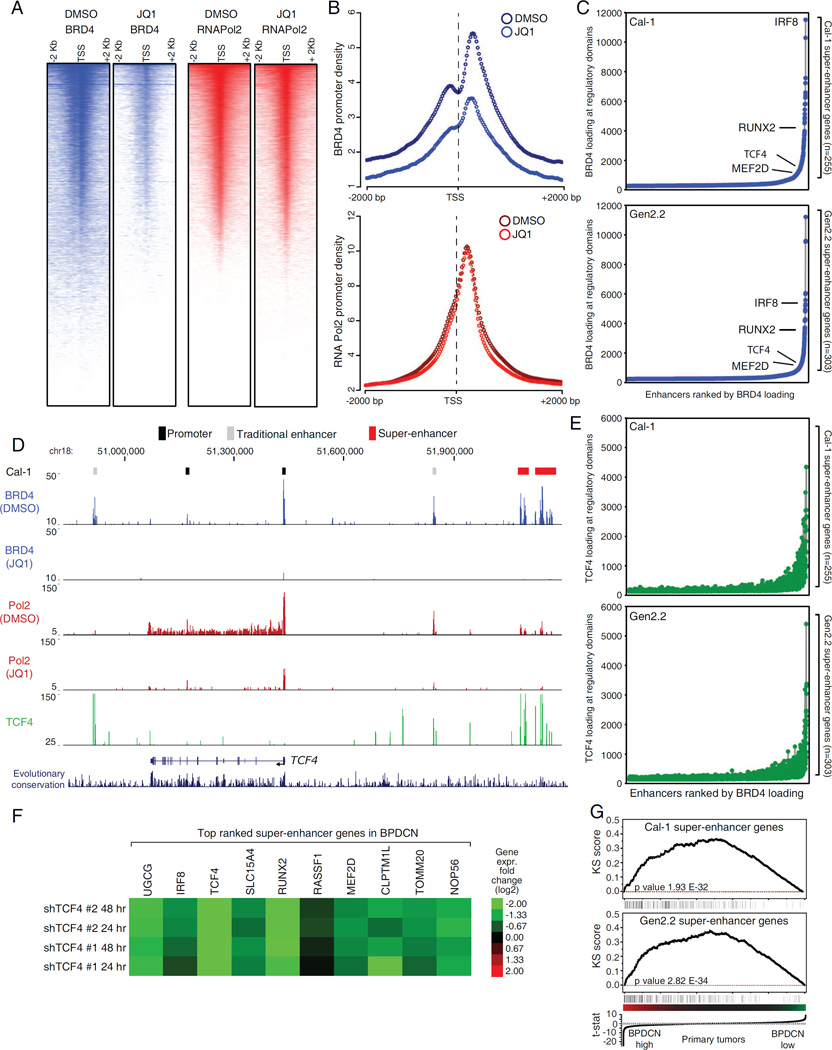
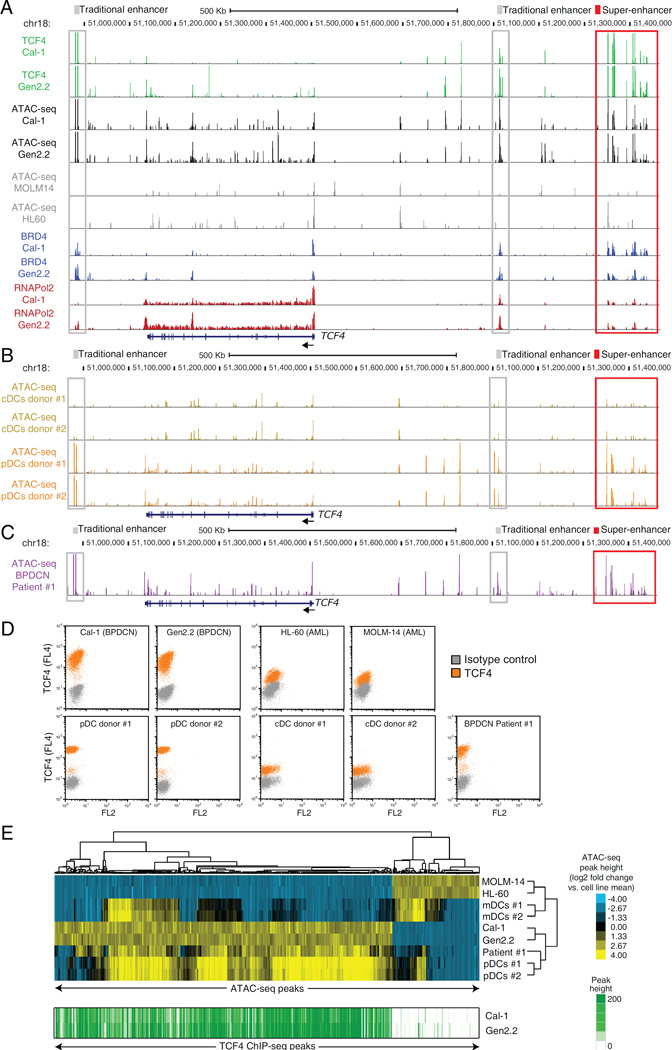
Blastic plasmacytoid dendritic cell neoplasm (BPDCN) is an aggressive and largely incurable hematologic malignancy originating from plasmacytoid dendritic cells (pDCs). Using RNAi screening, we identified the E-box transcription factor TCF4 as a master regulator of the BPDCN oncogenic program. TCF4 served as a faithful diagnostic marker of BPDCN, and its downregulation caused the loss of the BPDCN-specific gene expression program and apoptosis. High-throughput drug screening revealed that bromodomain and extra-terminal domain inhibitors (BETis) induced BPDCN apoptosis, which was attributable to disruption of a BPDCN-specific transcriptional network controlled by TCF4-dependent super-enhancers. BETis retarded the growth of BPDCN xenografts, supporting their clinical evaluation in this recalcitrant malignancy.

Keywords: BPDCN; BRD4; HTS; TCF4; super-enhancer.


Figures

Figure 1
Figure 1
Genetic dependencies of BPDCN identified by shRNA screen. A) shRNA screen hits: for each gene, the average -Log2 FC depletion of toxic shRNAs is shown. B) The shRNAs toxic to Cal-1 cells were ranked based on differential depletion with respect to the average of 3 control cell lines: CCRF-CEM, Jurkat and SKM-1. The top 20 shRNAs specifically toxic to BPDCN Cal-1 are shown. See also Figure S1 and Table S1.
Figure 2
Figure 2
The E-box transcription factor TCF4 is required for BPDCN viability. A) BPDCN cells were infected with either control or TCF4 shRNAs. Shown is the fraction of live, shRNA expressing (GFP+) cells over time after shRNA induction, compared to the un-induced day 0. B) RT Q-PCR was used to measure the level of TCF4 mRNA in BPDCN cells, after induction of the indicated shRNAs for 1 day. The B2M gene was used as housekeeping control. C) Western-blot analysis of Tcf4 expression 24 hr after the induction of the indicated shRNAs. Actin was used as loading control. The TCF4 targets BCL2, MYC and TLR9 are also shown. D) A representative flow cytometry stain for active Caspase-3 and cleaved Parp1 is shown for Cal-1 cells at day4 post shRNA induction. E) Cal-1 cells were infected with either Ctrl or TCF4 shRNAs. Shown is the fraction of apoptotic cells, for both GFP and GFP+ (shRNA expressing) populations. Time points refer to days post shRNA induction. F) Cal-1 cells were infected with either Ctrl or TCF4 shRNAs. For each cell cycle phase, the normalized ratio between GFP+ (shRNA expressing) and GFP- cells is shown. Time points refer to days post shRNA induction. Error bars represent SEM of triplicates. See also Figure S2.
Figure 3
Figure 3
The TCF4-dependent transcriptional network in BPDCN. A) Left: heat-map of genes down- or up-regulated in both Cal-1 and Gen2.2 cells after TCF4 knockdown. Right: TCF4 regulated genes containing a TCF4 ChIP-Seq peak within the promoter (− +2000bp from the TSS) or the gene body are indicated in yellow. See Table S2. B) Heatmaps of promoter RNA Pol2 (red) and TCF4 (green) density in the Cal-1 and Gen2.2 cells. For each line, representative RefSeq accessions were ranked by RNA Pol2 density and the TCF4 heat-map was displayed accordingly. C) The DNA logos of the top TCF4 binding motif predicted by MEME are shown (Bailey et al., 2009). Please see Figure S3C for the results of the motif prediction tool Clover Figure(Frith et al., 2004). D) The indicated TCF4 gene sets were analyzed by signature enrichment analysis. Enrichment ratios versus the indicated signature are plotted. See Table S3.E) BPDCN cell lines were infected with the indicated shRNAs and the expression of surface CD56 and CD123 was measured by flow cytometry. Shown are mean florescence intensity (MFI) ratios of shRNA+ vs. shRNA cells. See also Figure S3E. F) Heat-map comparing the RNA-Seq expression of TCF4 activated genes in BPDCN cell lines with that of normal pDCs isolated from 6 healthy donors. Error bars represent SEM of triplicates. See also Figure S3 and Table S2, S3.
Figure 4
Figure 4
TCF4 expression facilitates BPDCN diagnosis. A) The results of the unsupervised hierarchical clustering performed based on the TCF4 IHC scoring are shown. See Table S4. B) Representative TCF4 and hematoxylin and eosin (H&E) stains are shown at 40X magnification for 2 BPDCN cases and 1 AML case. C) Heat-map view of RNA-Seq expression levels of TCF4-activated genes in the indicated samples, grouped by unsupervised hierarchical clustering. Red indicates genes characteristically expressed in pDCs (DC-1 or DC-4 signatures) whereas blue indicates genes associated with cell proliferation (Prolif-5 signature) (Shaffer et al., 2006). D) The FFPE RNA-Seq digital gene expression values are shown for TCF4 and the indicated TCF4 targets. The black line indicates the mean. See also Figure S4 and Table S4.
Figure 5
Figure 5
The bromodomain and extra-terminal domain BRD4 is required for BPDCN survival. A). Log10 molar IC50 plots comparing Cal-1 and Gen2.2 cells. Of the 1910 compounds screened, 314 showed activity in both BPDCN lines, after excluding inactive and poorly fitting compounds. BETi’s are highlighted in red. See Table S5. B) BPDCN cells were infected with Ctrl, TCF4 or BRD4 shRNAs. Shown is the fraction of live, shRNA expressing (GFP+) cells over time after shRNA induction, compared to the day 0 un-induced value. C) BPDCN cells were treated with either DMSO or the indicated amount of BETi JQ1. Cell viability was assessed by MTS assay at day 3 post-treatment. D) BPDCN cells were treated with either DMSO or the indicated amount of JQ1. The percentage of apoptotic cells (active Caspase-3+, cleaved Parp1+) is shown at day 1 and day 2 post-treatment. E) Human BPDCN xenograft models were established by subcutaneous injection of Cal-1 and Gen2.2 cells in NOD/SCID mice and treated with either vehicle or the BET Inhibitor CPI 203 (5 mg/kg) for the indicated time points. Tumor growth was measured as a function of tumor volume. The cross indicate the mice euthanized because of excessive tumor growth. F) Relative mRNA levels of TCF4 and 3 of its targets in Cal-1 xenografts from mice treated for 5 days with CPI 203 or vehicle control. Error bars represent SEM of triplicates. In E), Error bars represent SEM, n=4 mice for the vehicle group, n=6 mice for the CPI 203 group. See also Figure S5 and Table S5.
Figure 6
Figure 6
A TCF4 and BRD4 dependent transcriptional network in BPDCN. A) Heat-map of genes down- or up-regulated following JQ1 treatment in both BPDCN cell lines. B) BPDCN cells were treated with either DMSO or the indicated JQ1 amount for 24 hr. The mRNA levels of TCF4 and its targets BCL2, MYC and TLR9 were evaluated by RT QPCR. The B2M gene was used as housekeeping control. C) Western-blot analysis of TCF4 expression in BPDCN cell lines 24 hr after treatment with the indicated JQ1 amounts. Actin was used as loading control. The TCF4 targets BCL2, MYC and TLR9 are also shown. D) The indicated JQ1 gene sets were analyzed by signature enrichment analysis. Enrichment ratios versus the indicated signature are plotted. E) BPDCN cell lines were treated with either DMSO or the indicated JQ1 amounts and expression of CD123 was measured by flow cytometry 24 hr post treatment. Shown are MFI values, normalized to the DMSO control. A representative stain is shown in Figure S6A. F) Gene Set Enrichment Analysis (GSEA) comparing JQ1 treatment and TCF4 shRNA gene expression datasets in the Cal-1 BPDCN cell line. Genes were first ranked based on the gene expression changes induced by TCF4 shRNAs and the distribution of JQ1 dependent genes was then analyzed. See Figure S5B for Gen2.2 cells. G) Bona fide TCF4 targets were analyzed by single locus ChIP Q-PCR after either inducible expression of TCF4 shRNA #1 (right panel, 24 hr induction) or JQ1 treatment (left panel, 16 hr, 100 nM). H) Cal-1 cells were infected with the indicated rescue vectors and the fraction of Lyt2+ cell was monitored over 2 weeks of treatment with either DMSO or the indicated JQ1 amounts. For each rescue construct, shown is the fraction of Lyt2+ cells normalized to the corresponding DMSO control. See Figure S6C for a representative stain. I) Cal-1 cells were infected with the indicated rescue vectors. Apoptosis induction after JQ1 treatment was monitored by flow cytometry for active Caspase-3 and cleaved Parp1. Error bars represent SEM of triplicates. For G), error bars represent SD of technical triplicates. One of two representative experiments is shown. See also Figure S6 and Table S6.
Figure 7
Figure 7
Mapping the BRD4 dependent super-enhancers in BPDCN. A) Density heat-maps of promoter BRD4 (blue) and RNA Pol2 (red) in Cal-1 cells, after 12 hr treatment with either DMSO or 250 nM JQ1. Representative RefSeq accessions were ranked based on decreasing RNA Pol2 density in the DMSO treated cells and all the heat-maps were displayed accordingly. See Figure S7A for Gen2.2 cells. B) Meta-promoter profiles of BRD4 (blue) and RNA Pol2 (red) ChIP-Seq data in Cal-1 cells. See Figure S7B for Gen2.2 cells. C) Enhancers were ranked based on increasing BRD4 loading. Relevant SE containing genes are highlighted in the plot. D) The TCF4 locus ChIP-Seq tracks for BRD4 (blue), RNA Pol2 (red) and TCF4 (green) are shown for Cal-1 cells. See Fig S7E for Gen2.2 cells. E) Enhancers were ranked based on increasing BRD4 loading and the corresponding signal from TCF4 ChIP-Seq was then displayed. F) Heat-map of gene expression changes (Log2 FC) observed after TCF4 knockdown in the BPDCN Cal-1 line. G) Gene Set Enrichment Analysis (GSEA) showing the enrichment of SE genes among genes highly expressed in primary BPDCN samples. See also Figure S7 and Table S7.
Figure 8
Figure 8
ATAC-Seq mapping of the regulatory landscape of BPDCN. A) ATAC-Seq was used to map the open chromatin landscape of the TCF4 locus in BPDCN cell lines (black) and in control AML cell lines (gray). TCF4, BRD4 and RNA Pol2 ChIP-Seq in the BPDCN cell lines are also shown in green, blue and red, respectively. B) Normal pDCs and CD1c+ cDCs were isolated from 2 healthy donors .The regulatory landscape of the TCF4 locus is shown in orange and yellow for pDCs and cDCs, respectively. C) ATAC-Seq was used to map the open chromatin regulatory landscape of the TCF4 locus in PBMCs isolated from a patient with leukemic BPDCN (purple). D) TCF4 intracellular flow was performed for the indicated cell lines and primary samples. E) Heat-map results of the unsupervised hierarchical clustering based on the ATAC-Seq predictor regions. Cell lines and primary samples are indicated on the right dendrogram. The corresponding TCF4 ChIP-Seq density is shown in green for the two BPDCN cell lines. See also Figure S8 and Table S8.

Comment in

References

    1. Abdel-Wahab O, Levine RL. Mutations in epigenetic modifiers in the pathogenesis and therapy of acute myeloid leukemia. Blood. 2013;121:3563–3572. - PMC - PubMed
    1. Alayed K, Patel KP, Konoplev S, Singh RR, Routbort MJ, Reddy N, Pemmaraju N, Zhang L, Shaikh AA, Aladily TN, et al. TET2 mutations, myelodysplastic features, and a distinct immunoprofile characterize blastic plasmacytoid dendritic cell neoplasm in the bone marrow. American journal of hematology. 2013;88:1055–1061. - PubMed
    1. Assaf C, Gellrich S, Whittaker S, Robson A, Cerroni L, Massone C, Kerl H, Rose C, Chott A, Chimenti S, et al. CD56-positive haematological neoplasms of the skin: a multicentre study of the Cutaneous Lymphoma Project Group of the European Organisation for Research and Treatment of Cancer. J Clin Pathol. 2007;60:981–989. - PMC - PubMed
    1. Bailey TL, Boden M, Buske FA, Frith M, Grant CE, Clementi L, Ren J, Li WW, Noble WS. MEME SUITE: tools for motif discovery and searching. Nucleic Acids Res. 2009;37:W202–w208. - PMC - PubMed
    1. Blasius AL, Arnold CN, Georgel P, Rutschmann S, Xia Y, Lin P, Ross C, Li X, Smart NG, Beutler B. Slc15a4, AP-3, and Hermansky-Pudlak syndrome proteins are required for Toll-like receptor signaling in plasmacytoid dendritic cells. Proc Natl Acad Sci U S A. 2010;107:19973–19978. - PMC - PubMed

MeSH terms