Comment
. 2016 Nov 14;30(5):806-821.
doi: 10.1016/j.ccell.2016.09.014.

Decoding the DNA Methylome of Mantle Cell Lymphoma in the Light of the Entire B Cell Lineage

Affiliations
Comment

Decoding the DNA Methylome of Mantle Cell Lymphoma in the Light of the Entire B Cell Lineage

Ana C Queirós et al. Cancer Cell. .

Abstract

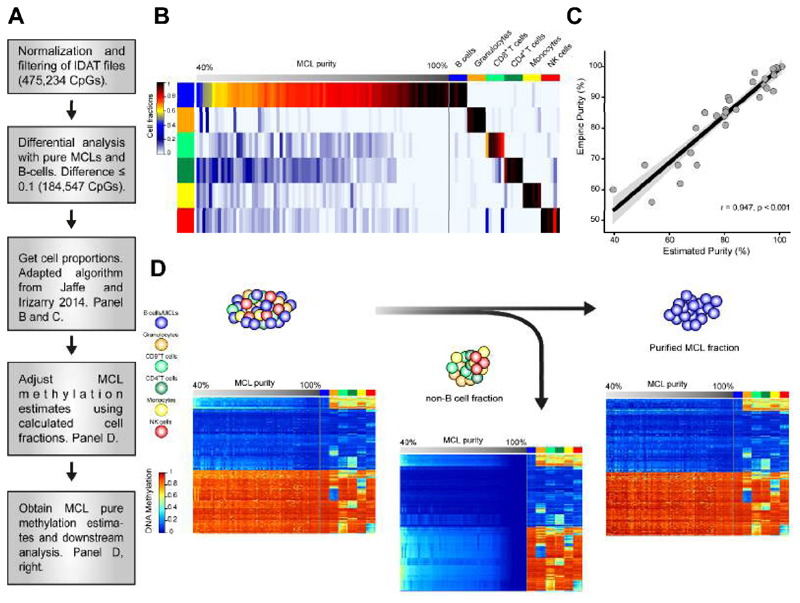
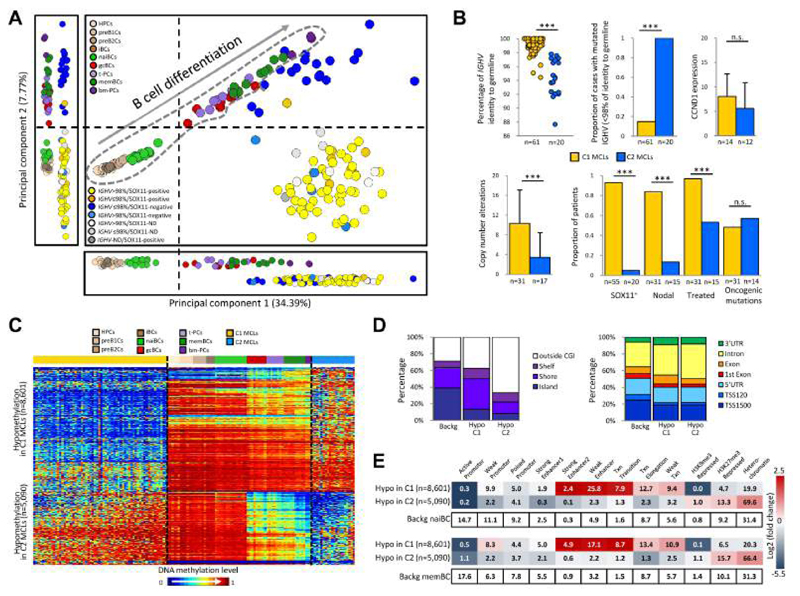
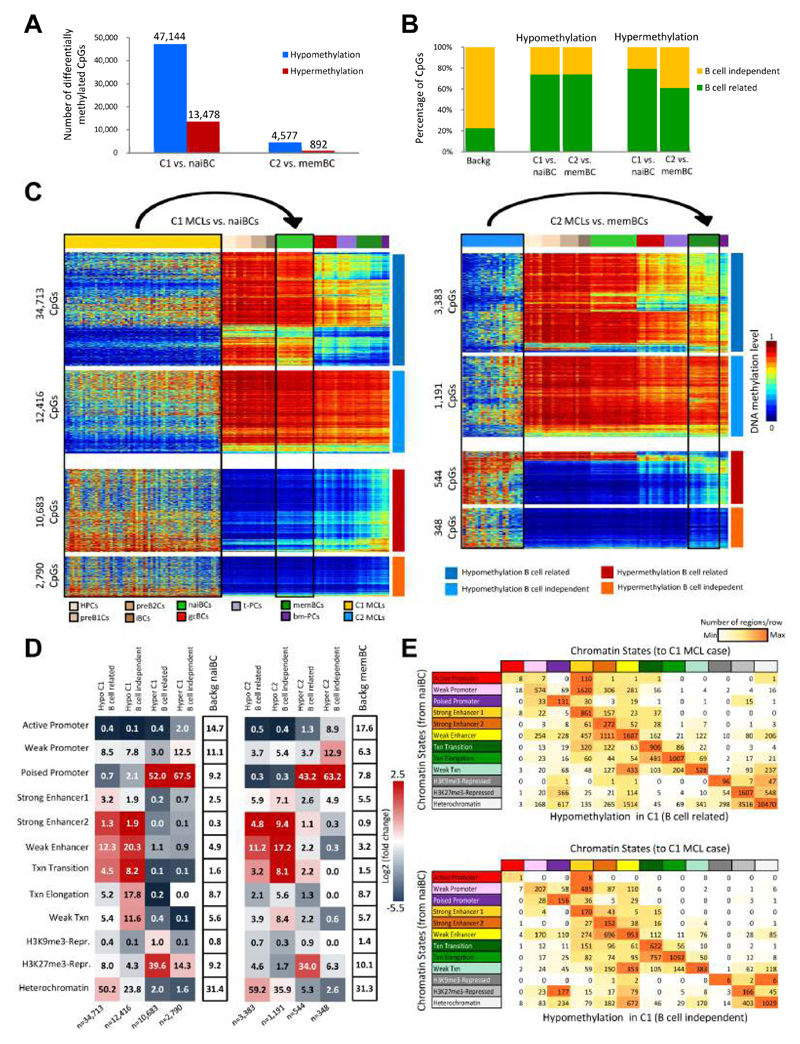
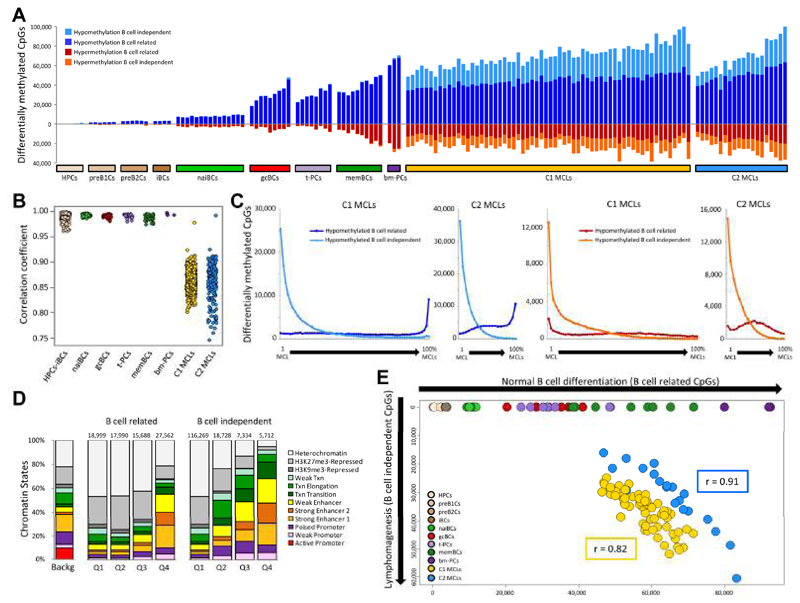
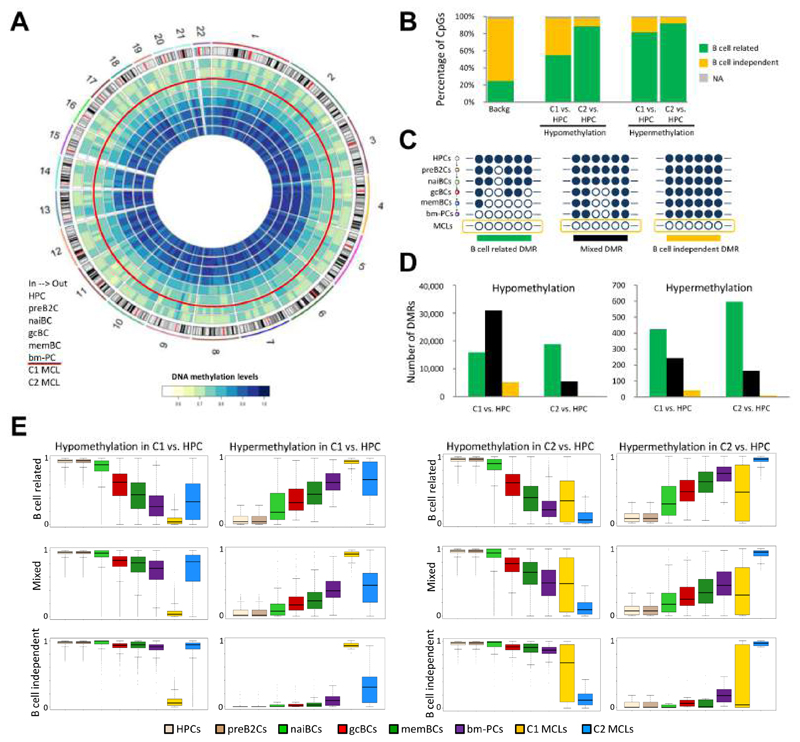
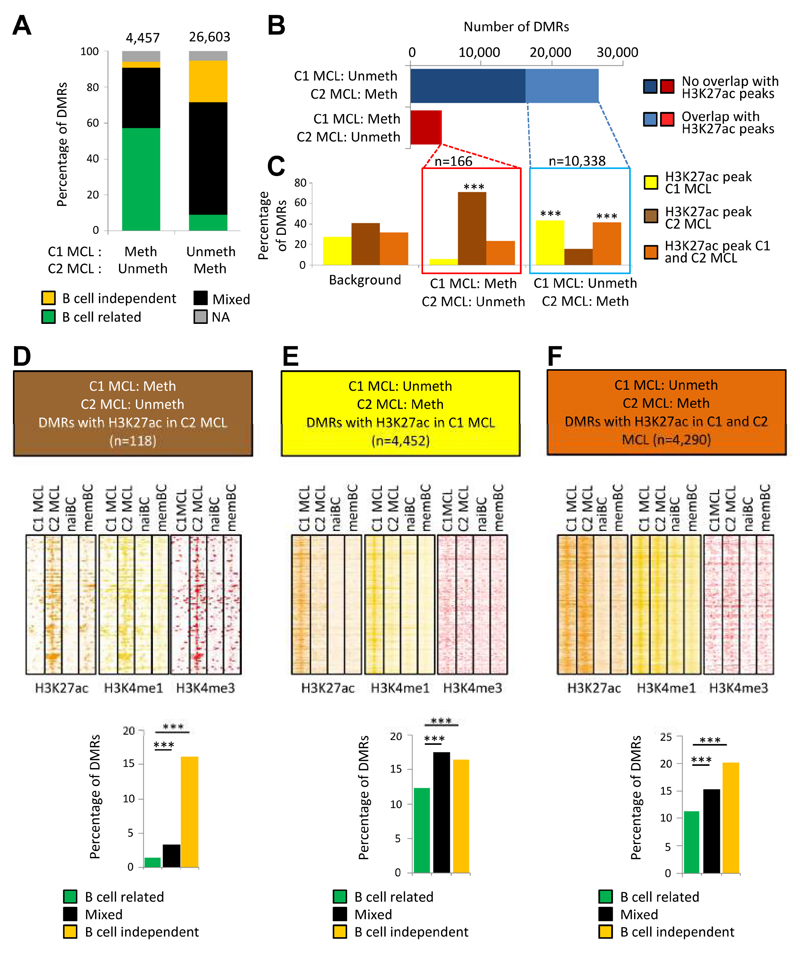
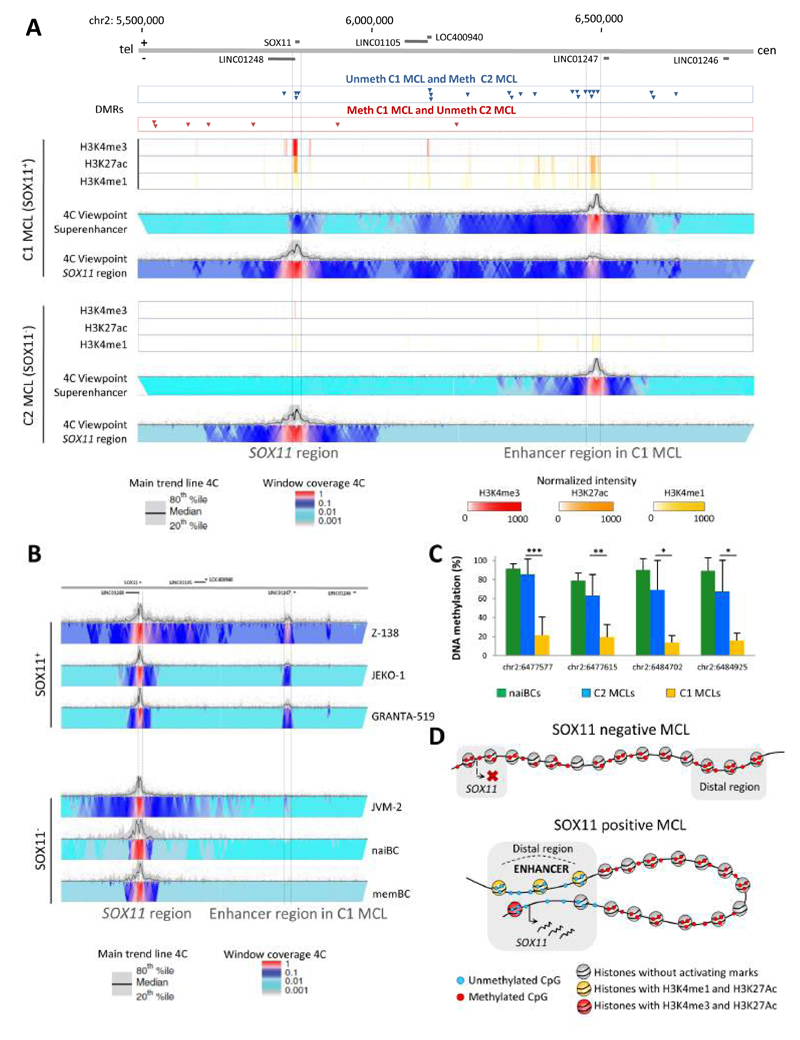
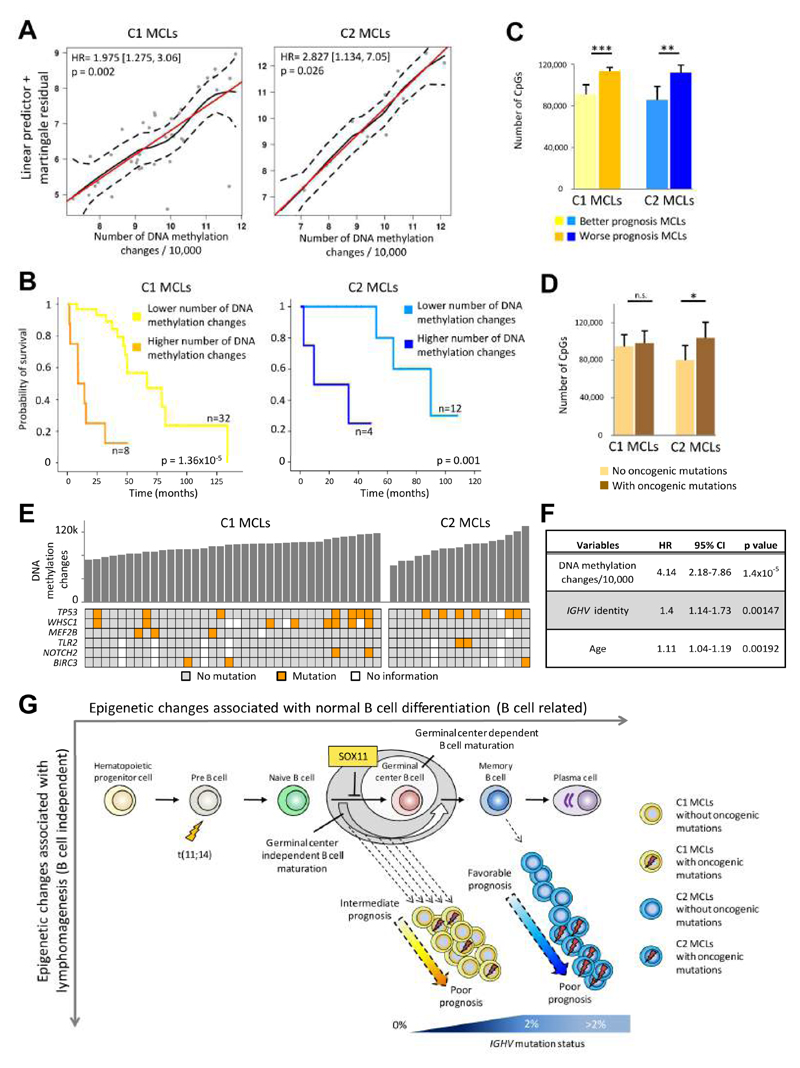
We analyzed the in silico purified DNA methylation signatures of 82 mantle cell lymphomas (MCL) in comparison with cell subpopulations spanning the entire B cell lineage. We identified two MCL subgroups, respectively carrying epigenetic imprints of germinal-center-inexperienced and germinal-center-experienced B cells, and we found that DNA methylation profiles during lymphomagenesis are largely influenced by the methylation dynamics in normal B cells. An integrative epigenomic approach revealed 10,504 differentially methylated regions in regulatory elements marked by H3K27ac in MCL primary cases, including a distant enhancer showing de novo looping to the MCL oncogene SOX11. Finally, we observed that the magnitude of DNA methylation changes per case is highly variable and serves as an independent prognostic factor for MCL outcome.

Keywords: ChIP-seq; DNA looping; DNA methylation; SOX11; chromatin; enhancer; epigenomics; lymphoma; mantle cell lymphoma; whole-genome bisulfite sequencing.


Figures

Figure 1
Figure 1. Deconvolution of DNA methylation data and in silico purification of MCL methylation estimates.
(A) Work flow of the deconvolution process in MCL samples. (B) Estimation of the proportion of hematopoietic cell subpopulations in MCL samples and in sorted B cells, CD8+ T cells, CD4+ T cells, NK cells, monocytes and granulocytes. Sorted cell subpopulations (right part of the heatmap) are correctly predicted and MCLs show a gradient from lower to higher proportion of B cells (left part of the heatmap) (C) The proportion of B cells in MCL samples as detected by flow cytometry and by the in silico prediction are highly correlated. (D) Heatmaps of the CpGs representative of each cell type (n=580) showing the initial methylation estimates the MCL samples (left), the extraction of the DNA methylation signature from contaminating non-B cells (middle) and the final in silico purification of the DNA methylation estimates from MCL cells (right). See also Figure S1 and Table S1.
Figure 2
Figure 2. Identification of two MCL subgroups based on DNA methylation profiling.
(A) Unsupervised PCA of 82 MCLs and 67 normal B cell subpopulations using the adjusted methylation values of all CpGs analyzed with the 450K array. The two main principal components are shown together in a 2D plot and separately. Vertical and horizontal dotted lines point to the cut-off value separating germinal center-inexperienced and -experienced B cells. Normal B cells are surrounded by a dotted grey line. (B) Comparison of biological and clinical features between the two epigenetic subgroups (i.e. C1 and C2). The presence of oncogenic mutations is defined as having a mutation in at least one of the following genes: BIRC3, MEF2B, NOTCH2, TLR2, TP53 and WHSC1. Data show mean ± SD. ***p < 0.001 (Fisher's exact test or t-test for independent samples). (C) Heatmap of the CpGs differentially methylated in C1 as compared to C2. (D) Location of the hypo- and hypermethylated CpGs between C1 and C2 MCLs in the context of CpG islands (CGI) and gene-related regions. (E) Chromatin states of naive (upper panel) and memory (lower panel) B cells of the differentially methylated CpGs between C1 and C2 MCLs. The numbers inside each cell point to the percentage of CpGs belonging to a particular chromatin state. The differentially methylated CpGs annotated in panels D and E are the same as those shown in panel C. HPCs, hematopoietic progenitor cells; preB1Cs, pre-BI cells; preB2Cs, pre-BII cells; iBCs, immature B cells; naiBCs, naive B cells from peripheral blood; gcBCs, germinal center B cells; t-PCs, plasma cells from tonsil; memBCs, memory B cells from peripheral blood; bm-PCs, plasma cells from bone marrow; C1 MCLs, germinal center-inexperienced MCLs; C2 MCLs, germinal center-experienced MCLs; Backg, background; Hypo, hypomethylation; Hyper, hypermethylation; TSS, transcriptional start site, UTR, untranslated region. See also Figure S2 and Table S2.
Figure 3
Figure 3. DNA methylation of MCL subgroups versus their respective normal B cell counterpart.
(A) Number of differentially methylated CpGs between C1 and naiBCs, and between C2 and memBCs. (B) Percentage of B cell-related and B cell-independent CpGs differentially methylated in each comparison. (C) Heatmaps of differentially methylated CpGs in C1 MCLs as compared to naiBCs (left) and in C2 MCLs as compared to memBCs (right) in the context of normal B cell differentiation. (D) Chromatin states in naiBCs and memBCs of the differentially methylated CpGs between C1 and naiBCs (left panel), and between C2 and memBCs (right panel), respectively. The numbers inside each cell point to the percentage of CpGs belonging to a particular chromatin state. (E) Transition of the chromatin states from naiBCs to a C1 MCL case in the B cell-related and B cell-independent hypomethylated CpGs. The numbers inside each cell point to the total number of CpGs in each transition. See also Figure S3.
Figure 4
Figure 4. Association between B cell-related and B cell-independent DNA methylation changes in MCL.
(A) Number of differentially methylated CpGs for each individual normal B cell subpopulation and MCL as compared to HPCs. (B) Correlation coefficient among samples of the different groups. (C) Number of B cell-related and B cell-independent differentially methylated CpGs based on their level of recurrence in C1 (1st and 3rd panel) and C2 (2nd and 4th panel). (D) Chromatin states, defined in a MCL primary case representative of C1 cases, of the hypomethylated CpGs between C1 and naiBCs divided into quartiles based on their level of recurrence. Q1, recurrent in 0-25% of patients; Q2, recurrent in 25-50% of patients; Q3, recurrent in 50-75% of patients; Q4, recurrent in 75-100% of patients. (E) Scatter plot showing the number of B cell-related (x-axis) and B cell-independent (y-axis) CpGs differentially methylated in individual MCLs and normal B cells as compared to HPCs. See also Figure S4.
Figure 5
Figure 5. Analysis of the MCL methylome by WGBS.
(A) Circular representation of the DNA methylation levels for HPC, preB2C, naiBC, gcBC, memBC and bm-PC, as well as two MCLs representative for C1 and C2, respectively. CpG methylation levels are averaged over 10 Mb genomic windows. (B) Percentage of B cell-related and B cell-independent CpGs differentially methylated in C1 MCL and C2 MCL versus HPC. (C) Graphical representation of the different DMR types: DMRs with only B cell-related CpGs are defined as B cell-related DMRs (left), DMRs containing both B cell-related and B cell-independent CpGs are defined as mixed DMRs (middle), and DMRs with only B cell-independent CpGs are defined as B cell-independent DMRs (right). (D) Number of B cell-related, mixed and B cell-independent DMRs between C1 versus HPC and between C2 versus HPC. (E) Distribution of DNA methylation levels for the different DMRs types defined between C1 MCL and HPC and between C2 MCL and HPC. Box plots show upper and lower quartiles and the median, and whiskers represent minimum and maximum, with outer points indicating outliers. See also Figure S5 and Table S3.
Figure 6
Figure 6. Integrative analysis of differentially methylated regions and histone modifications.
(A) Distribution of differentially methylated regions (DMRs) defined by WGBS between the MCL cases representative of C1 (SOX11-positive) and C2 (SOX11-negative) into three different DMR types (B cell-dependent, B cell-independent or mixed DMRs; NA = non-assigned). (B) Number of DMRs between the C1 and C2 MCL cases and their overlap with H3K27ac peaks in these MCL cases. (C) Distribution of the DMRs showing an overlap with H3K27ac peaks in the C1 MCL case only, the C2 MCL case only or in both cases. The background represents all H3K27ac peaks in the C1 and C2 MCL case, and shows which percentage is unique for these cases (yellow and darkbrown) and which percentage overlaps (lightbrown). ***p < 0.001 (Fisher's test). (D-F) Heatmaps showing the read density of H3K27ac, H3K4me1 and H3K4me3 chIP-seq in the C1 MCL case, C2 MCL case, naive B cells (NBC) and memory B cells (MBC) at selected DMRs (±10 Kb). Only the DMRs showing significant differences versus the background in panel C were used for these heatmaps, i.e. unmethylated regions in the C2 case that overlap with H3K27ac peaks in the C2 case only (D), unmethylated regions in the C1 case that overlap with H3K27ac peaks in the C1 case only (E), or with H3K27ac peaks in both the C1 and C2 case (F). In the lower part of these panels, the percentage of these respective DMRs within the B cell-related, mixed and B cell-independent DMRs is represented (***p < 0.001). See also Figure S6, and Tables S4 and S5.
Figure 7
Figure 7. Analysis of the epigenetic and 3D structure of the SOX11 locus.
(A) Differentially methylated regions (DMRs), ChIP-seq levels and 4C-seq signals around the SOX11 locus. The represented region covers chr2:5,492,778-6,834,378 (hg19). Unmethylated DMRs in respectively the C1 (SOX11-positive) and C2 (SOX11-negative) MCL cases are represented in the upper part of the panel by the blue and red arrows. In the lower 2 panels, normalized chIP-seq intensities for H3K4me3, H3K4me1 and H3K27ac are depicted for the C1 and C2 MCL case. Furthermore, normalized 4C-seq intensities are indicated using the enhancer in MCL C1 (chr2:6,465,559-6,496,708, hg19) or the SOX11 region as viewpoint. tel, telomere; cen, centromere. (B) Normalized 4C-seq intensities taking the SOX11 region as viewpoint in 3 SOX11-positive MCL cell lines (Z-138, JEKO-1, GRANTA-519), one SOX11-negative MCL cell line (JVM-2) and in normal naive and memory B cells (naiBCs and memBCs). (C) Mean methylation levels of 4 CpGs within the SOX11-positive MCL enhancer region in naive B cells (green, n=4), SOX11-negative (blue, n=10) and SOX11-positive (orange, n=12) MCLs as analyzed by bisulfite pyrosequencing. Data show mean ± SD. *p < 0.01, **p < 0.001, ***p < 0.0001 (Wilcoxon test for independent samples). (D) Model of the SOX11 locus in SOX11-negative MCL (upper) and SOX11-positive MCL (lower). See also Table S6.
Figure 8
Figure 8. Link between the number of DNA methylation changes and prognosis.
(A) Relationship between the number of epigenetic changes and overall survival through a linear predictor. Red line: perfect linear relationship; black line: observed regression line; dash line: 95% confidence interval of observed regression. (B) Kaplan-Meier plots of MCLs with lower vs. higher number of differentially methylated CpGs compared to HPCs in C1 and C2 MCLs. (C) Number of differentially methylated CpGs between the subgroups with different prognosis defined in panel B. Data show mean ± SD. ***p < 0.001 (t-test for independent samples). (D) Association between the number of differentially methylated CpGs and the presence of oncogenic mutations (in BIRC3, MEF2B, NOTCH2, TLR2, TP53 and WHSC1 genes) for both C1 and C2 MCLs. Data show mean ± SD. *p < 0.05; n.s. not significant (t-test for independent samples). For cases without or with mutations, the sample sizes are, respectively: C1 (n=16 and n=15) and C2 (n=6 and n=8). (E) Representation of epigenetic changes and the presence of oncogenic mutations in both C1 and C2 subgroups. (F) Results of the multivariate Cox regression model. (G) Proposed epi(genetic) model of MCL pathogenesis. See also Figure S7.

Comment on

References

    1. Adams D, Altucci L, Antonarakis SE, Ballesteros J, Beck S, Bird A, Bock C, Boehm B, Campo E, Caricasole A, et al. BLUEPRINT to decode the epigenetic signature written in blood. Nat Biotechnol. 2012;30:224–226. - PubMed
    1. Agirre X, Castellano G, Pascual M, Heath S, Kulis M, Segura V, Bergmann A, Esteve A, Merkel A, Raineri E, et al. Whole-epigenome analysis in multiple myeloma reveals DNA hypermethylation of B cell-specific enhancers. Genome Res. 2015;25:478–487. - PMC - PubMed
    1. Aran D, Hellman A. DNA methylation of transcriptional enhancers and cancer predisposition. Cell. 2013;154:11–13. - PubMed
    1. Aran D, Sabato S, Hellman A. DNA methylation of distal regulatory sites characterizes dysregulation of cancer genes. Genome Biol. 2013;14:R21. - PMC - PubMed
    1. Baylin SB, Jones PA. A decade of exploring the cancer epigenome - biological and translational implications. Nat Rev Cancer. 2011;11:726–734. - PMC - PubMed

Substances