

Review
doi: 10.1126/science.aaf5098.
Going global by adapting local: A review of recent human adaptation
Affiliations
- PMID: 27846491
- PMCID: PMC5154245
- DOI: 10.1126/science.aaf5098
Item in Clipboard
Review
Going global by adapting local: A review of recent human adaptation
Science.
.
Abstract
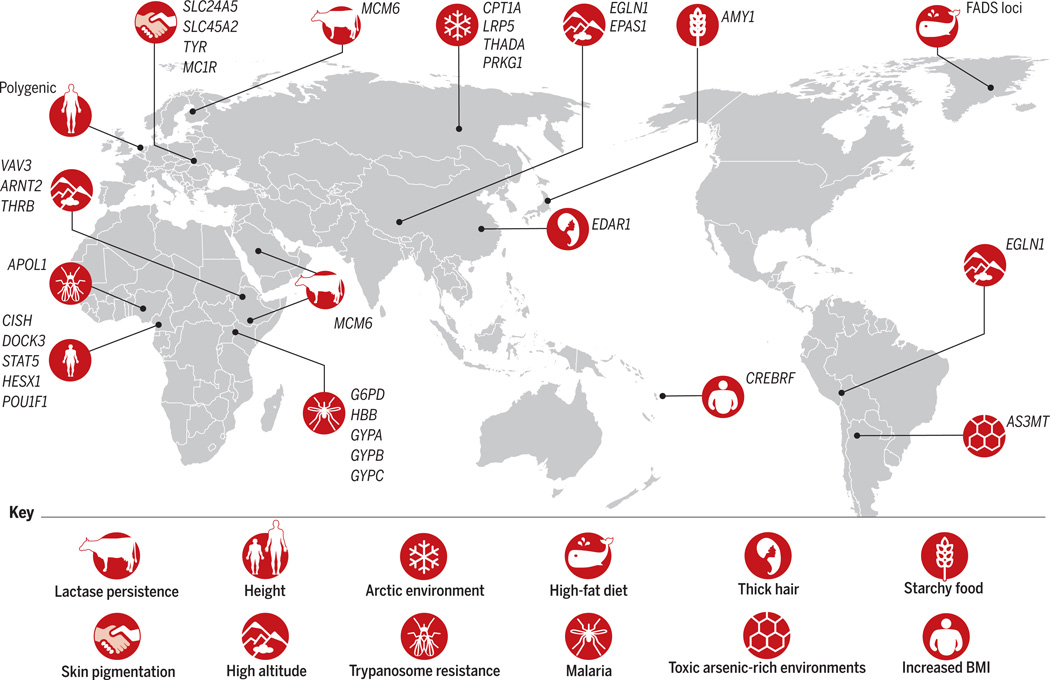
The spread of modern humans across the globe has led to genetic adaptations to diverse local environments. Recent developments in genomic technologies, statistical analyses, and expanded sampled populations have led to improved identification and fine-mapping of genetic variants associated with adaptations to regional living conditions and dietary practices. Ongoing efforts in sequencing genomes of indigenous populations, accompanied by the growing availability of "-omics" and ancient DNA data, promises a new era in our understanding of recent human evolution and the origins of variable traits and disease risks.
Copyright © 2016, American Association for the Advancement of Science.
Figures
[Adapted from (13)]
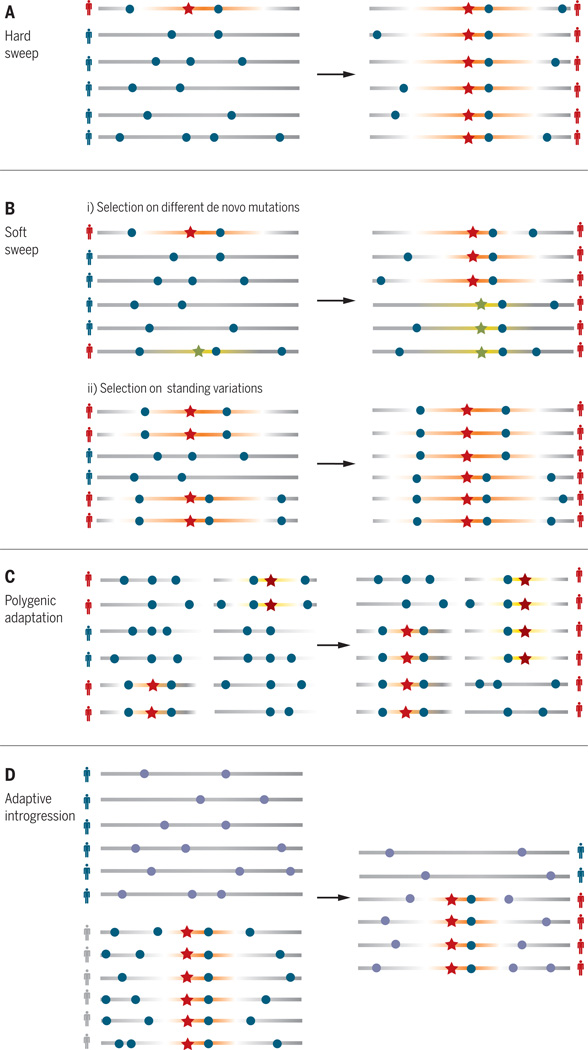
(A) A hard sweep. (B) A soft sweep acting on (i) multiple de novo beneficial mutations and (ii) standing variation. (C) Polygenic adaptation. (D) Adaptive introgression. Each horizontal bar represents a haplotype (a sequence of genetic variants on the same chromosome). The orange segment is graded to indicate the strength of linkage disequilibrium between beneficial (stars) and neutral (dots) variants.
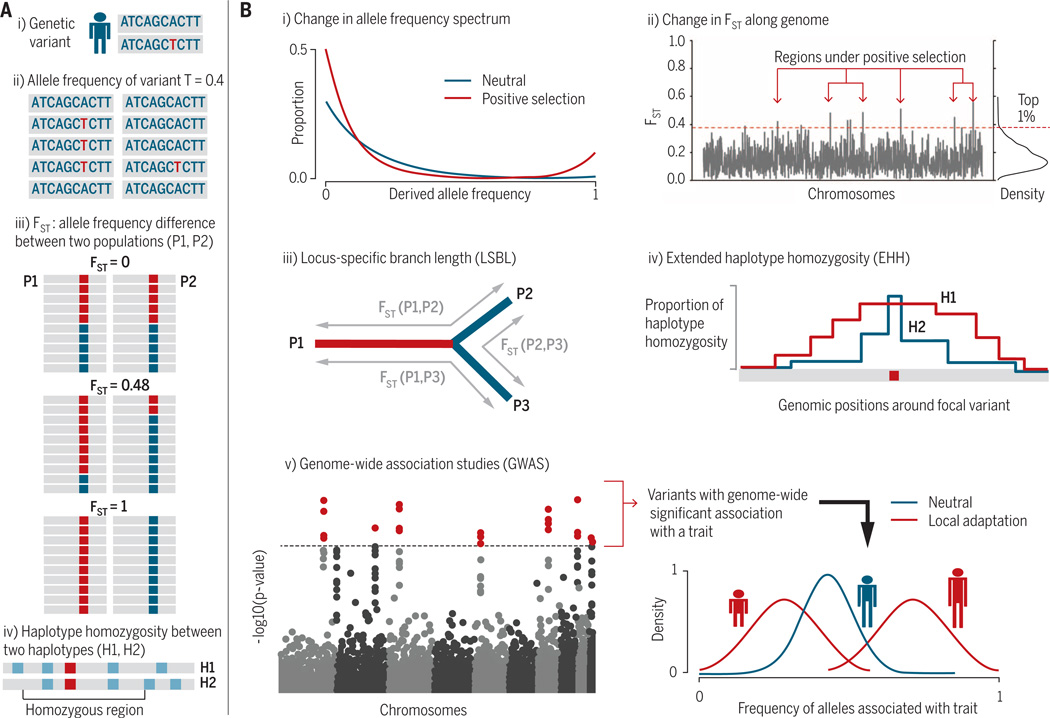
(A) Population genetics terminology. (i) A genetic variant (A/T, red) on the diploid chromosomes of an individual. (ii) The allele frequency of a variant in a population is the fraction of chromosomes containing the variant. In this case, allele frequency of variant T (red) = 0.4. (iii) FST measures proportion of genetic differentiation between populations. FST = 0 means the two populations have equal allele frequencies. FST =1 means the two populations are completely differentiated. (iv) Haplotype homozygosity is the shared stretches of variants between pairs of sampled haplotypes, typically measured around a focal variant (red square) and extending out to flanking variants (light blue). (B) Means of detecting positive selection. (i) Changes in the allele frequency spectrum. Positive selection (red) drives the alleles under selection and the hitchhiking alleles to high frequencies; at the same time, new mutations arise, creating an excess of rare alleles. (ii) FST along the genome. High FST values indicate loci enriched for targets of selection, with a cutoff (red dashed line) arbitrarily set to be the top 1%. (iii) LSBL, which quantifies branch lengths of a phylogenetic tree with three or more populations by using pairwise FST (17). At a locus, long branch length for one population (red) indicates a population-specific divergence. A similar statistic is the PBS. (iv) Haplotype homozygosity statistics [extended haplotype homozygosity (EHH) and integrated haplotype score (iHS)]. Overabundance of a long haplotype (H1, red) surrounding a focal variant indicates positive selection at the locus. The EHH statistic has also been extended to identify population-specific selective sweeps through cross-population comparisons (XP-EHH). (v) Results from GWAS, which identify genetic variants significantly associated with a specific trait (such as height), indicated by red dots on the Manhattan plot (left). Shifts in the frequency distribution of alleles associated with the trait (right) in specific populations (red) compared with the expectation under neutrality (blue) indicates that the trait is under selection. [Part of Fig. 3B is adapted from (27)]
References
-
- Enattah NS, et al. Nat. Genet. 2002;30:233–237. - PubMed
Publication types
MeSH terms
Grants and funding
LinkOut - more resources
Full Text Sources
Other Literature Sources
