. 2016 Oct 21;354(6310):305-307.
doi: 10.1126/science.aah5974.

Molecular force spectroscopy with a DNA origami-based nanoscopic force clamp

Affiliations

Molecular force spectroscopy with a DNA origami-based nanoscopic force clamp

Philipp C Nickels et al. Science. .

Abstract

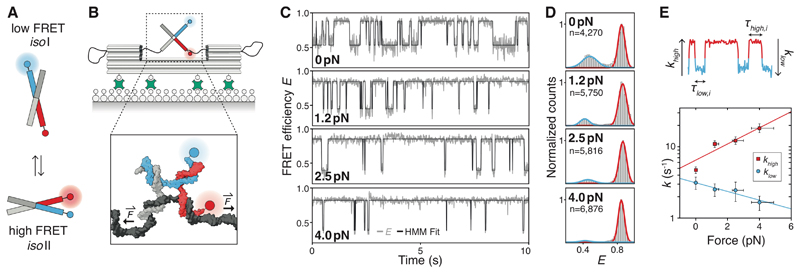
Forces in biological systems are typically investigated at the single-molecule level with atomic force microscopy or optical and magnetic tweezers, but these techniques suffer from limited data throughput and their requirement for a physical connection to the macroscopic world. We introduce a self-assembled nanoscopic force clamp built from DNA that operates autonomously and allows massive parallelization. Single-stranded DNA sections of an origami structure acted as entropic springs and exerted controlled tension in the low piconewton range on a molecular system, whose conformational transitions were monitored by single-molecule Förster resonance energy transfer. We used the conformer switching of a Holliday junction as a benchmark and studied the TATA-binding protein-induced bending of a DNA duplex under tension. The observed suppression of bending above 10 piconewtons provides further evidence of mechanosensitivity in gene regulation.


Conflict of interest statement

Competing interests:

The authors declare that they have no competing interests.

Figures

Fig. 1
Fig. 1. DNA origami force clamp.
(A) ssDNA connects the molecular system of interest (red rectangle) with two immobile anchor points. Reducing the number of nucleotides spanning the distance d leads to a smaller number of adoptable conformations of the ssDNA chain and thus results in a higher entropic force. (B) Scheme of the DNA origami force clamp structure. ssDNA exits the clamp duplexes in a shear conformation (left inset: scaffold in black, staple in blue) and spans the 43 nm wide gap. ssDNA reservoirs are located on each side of the clamp. The system of interest (here a DNA duplex) is probed in shear conformation (right inset). (C) For each constant force variant (three variants are shown here), individual origami samples were assembled. (D) Agarose gel of the three variants after annealing with the monomer (M) and dimer band (D) of the origami structure highlighted. (E) Average TEM micrographs of the three variants (left) and single negative-stain TEM image of the 6 pN variant (right). Scale bars: 20 nm.
Fig. 2
Fig. 2. Holliday junction conformer transitions under force.
(A) Schematics of the HJ switching between two stacked isomers; Cy3 donor (blue) and Cy5 acceptor (red). (B) Force clamps were immobilized on a BSA-covered glass surface via biotin-streptavidin coupling. The HJ system is mounted in the force clamp with one of the four HJ-strands being the scaffold (black strand in inset). (C) FRET traces with the FRET efficiency E (gray line) and two-state hidden Markov fit (black line). (D) Histograms over all recorded FRET traces with Gaussian fits for the two FRET populations in blue (low-FRET) and red (high-FRET). Only traces with > 20 transitions were included in the analysis; n is the total number of transitions. (E) Dwell times for both states (τlow,i , τhigh,i) were extracted for each trace. Transition rates (klow , khigh) were first extracted from a mono-exponential decay fit for each dwell time histogram, then averaged and plotted (semi-log plot) as a function of force. Red squares: low- to high-FRET (khigh); blue circles: high- to low-FRET (klow). Solid lines are exponential fits where the exponent relates rates to the applied force. Y-axis error is the standard error of each average rate; x-axis error is the uncertainty of the calculated force (fig. S15)
Fig. 3
Fig. 3. TBP-induced DNA bending under force.
(A) TBP from M.jannaschii (PDB: 2Z8U) (29). Two pairs of phenylalanines located in the DNA binding domain promote DNA bending. (B) The SSV T6 promotor including the TATA-box mounted on the force clamp; Atto532 donor (blue) and Atto647n acceptor (red). (C) TBP binds the minor groove of the TATA-box and bends the duplex by almost 90°, thus changing the distance between donor and acceptor. (D) FRET histograms and Gaussian fits for the low-FRET (blue) and high-FRET (red) population. N is the number of molecules measured for each force. (E) Semi-log plot of the probability of the bent state Pbent as a function of force. The solid line is a Boltzmann distribution fit. Y-axis error is the standard error of Pbent; x-axis error is the uncertainty of the calculated force (fig. S28).

References

    1. Kellermayer MS, Smith SB, Granzier HL, Bustamante C. Folding-unfolding transitions in single titin molecules characterized with laser tweezers. Science. 1997;276:1112–1116. - PubMed
    1. Rief M, Gautel M, Oesterhelt F, Fernandez JM, Gaub HE. Reversible unfolding of individual titin immunoglobulin domains by AFM. Science. 1997;276:1109–1112. - PubMed
    1. Smith SB, Cui Y, Bustamante C. Overstretching B-DNA: the elastic response of individual double-stranded and single-stranded DNA molecules. Science. 1996;271:795–799. - PubMed
    1. Fernandez JM, Li H. Force-clamp spectroscopy monitors the folding trajectory of a single protein. Science. 2004;303:1674–1678. - PubMed
    1. Neuman KC, Nagy A. Single-molecule force spectroscopy: optical tweezers, magnetic tweezers and atomic force microscopy. Nat Meth. 2008;5:491–505. - PMC - PubMed

Publication types

MeSH terms