

MicroRNAs regulate gene plasticity during cold shock in zebrafish larvae
- PMID: 27846817
- PMCID: PMC5111229
- DOI: 10.1186/s12864-016-3239-4
MicroRNAs regulate gene plasticity during cold shock in zebrafish larvae
Abstract
Background: MicroRNAs (miRNAs) are critical regulators responding to acute environmental stresses in both plants and animals. By modulating gene expression, miRNAs either restore or reconstitute a new expression program to enhance cell tolerance to stresses. Cold shock is one of the stresses that can induce acute physiological responses and transcriptional changes in aquatic creatures. Previous genomic studies have revealed many cold-affected genes in fish larvae and adults, however, the role of miRNAs in acute cold response is still ambiguous. To elucidate the regulatory roles of miRNAs in the cold-inducible responses, we performed small RNA-seq and RNA-seq analyses and found potential cold regulatory miRNAs and genes. We further investigated their interactions and involvements in cold tolerance.
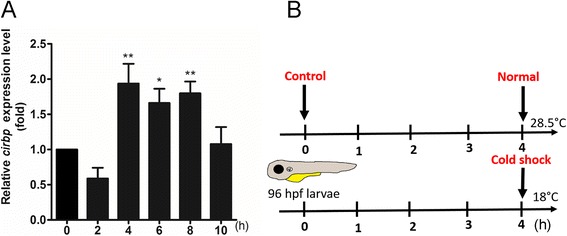
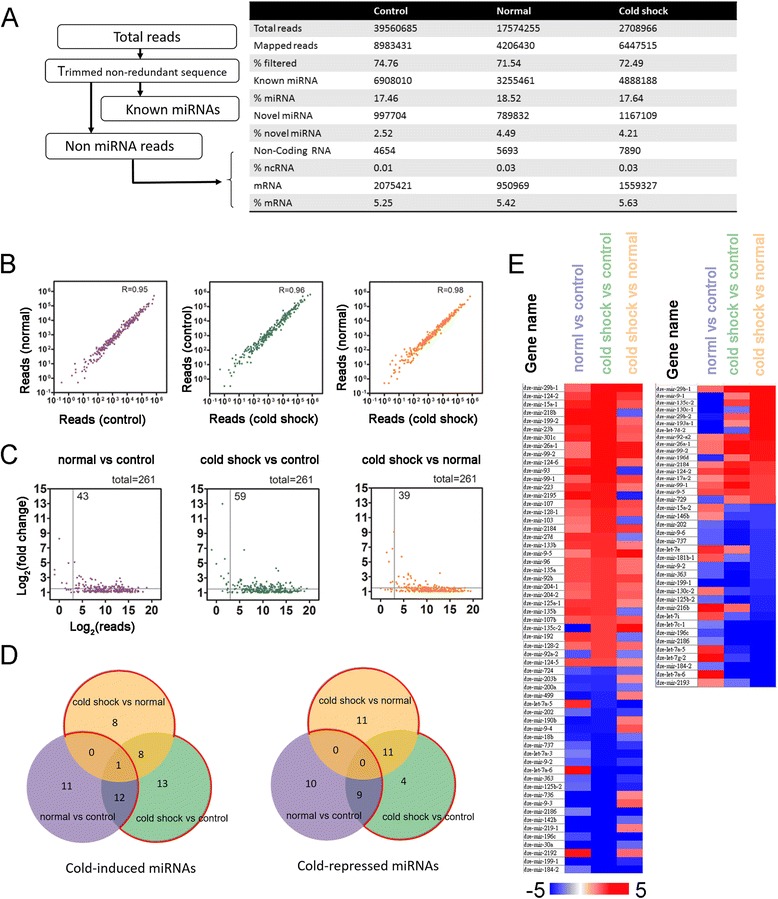
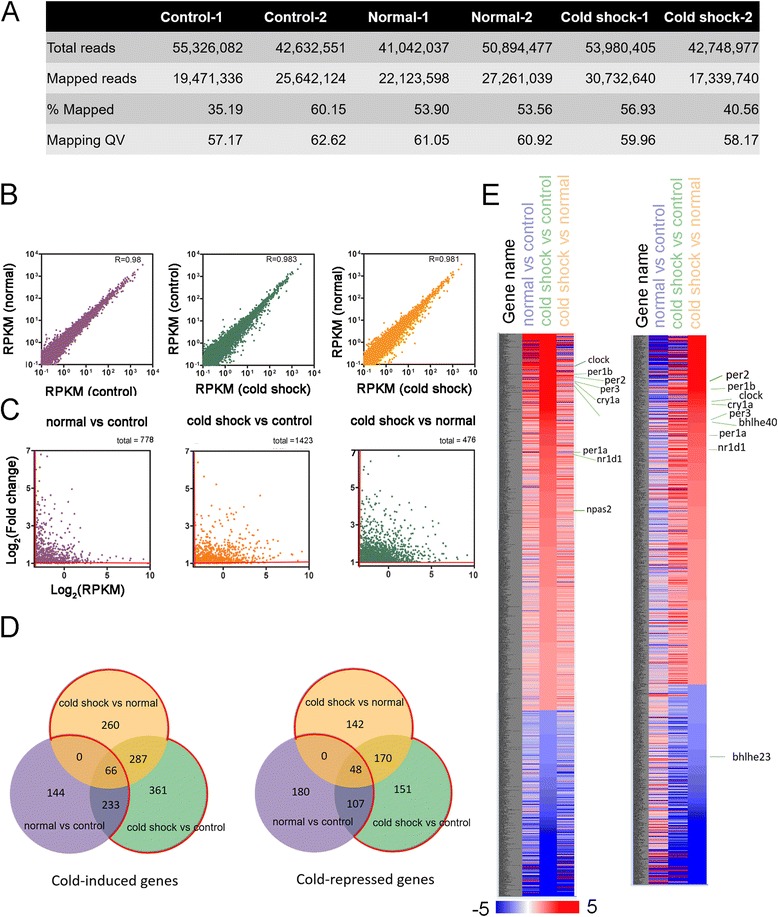
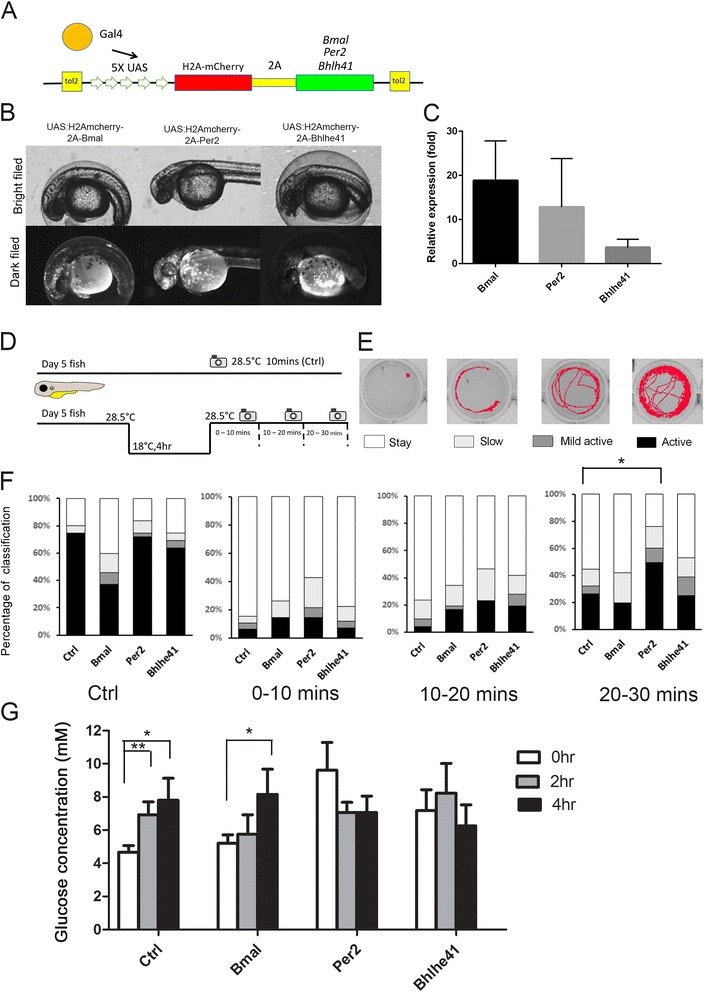
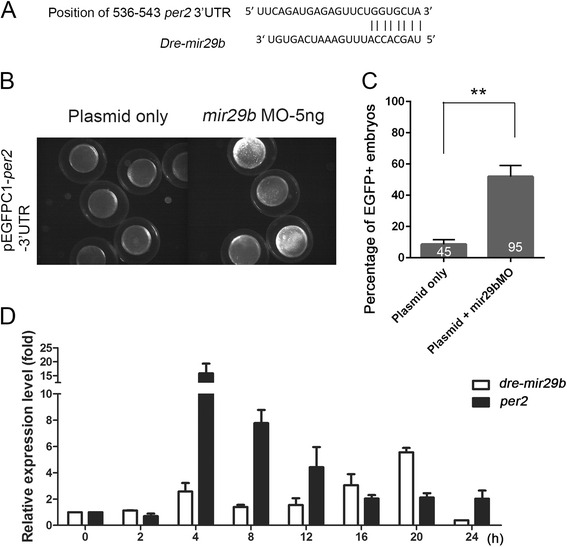
Results: Small RNA-seq and RNA-seq identified 29 up-/26 down-regulated miRNAs and 908 up-/468 down-regulated genes, respectively, in responding to cold shock for 4 h at 18 °C. miRNA and transcriptomic analyses showed these miRNAs and mRNAs are involved in similar biological processes and pathways. Gene ontology enrichment analyses revealed the cold-induced genes were enriched in pathways, including melanogenesis, GnRH pathway, circadian rhythm, etc. We were particularly interested in the changes in circadian clock genes that affect daily metabolism. The enrichment of circadian clock genes was also observed in previous fish cold acclimation studies, but have not been characterized. To characterize the functional roles of circadian clock genes in cold tolerance, we individually overexpressed selected clock genes in zebrafish larvae and found one of the core clock genes per2 resulted in better recovery from cold shock. In addition, we validated the interaction of per2 with its associate miRNA, dre-mir-29b, which is also cold-inducible. It suggests the transcription of per2 can be modulated by miRNA upon cold shock.
Conclusions: Collectively, our observations suggest that miRNAs are fine turners for regulating genomic plasticity against cold shock. We further showed that the fine tuning of core clock gene per2 via its associated miRNA, dre-mir-29b, can enhance the cold tolerance of zebrafish larvae.
Keywords: Clock genes; Cold stress; Deep sequencing; Embryonic development; Zebrafish; miRNA.
Figures


Similar articles
-
Transcriptional events co-regulated by hypoxia and cold stresses in Zebrafish larvae.BMC Genomics. 2015 May 15;16(1):385. doi: 10.1186/s12864-015-1560-y. BMC Genomics. 2015. PMID: 25975375 Free PMC article.
-
Light-regulated microRNAs shape dynamic gene expression in the zebrafish circadian clock.PLoS Genet. 2025 Jan 8;21(1):e1011545. doi: 10.1371/journal.pgen.1011545. eCollection 2025 Jan. PLoS Genet. 2025. PMID: 39777894 Free PMC article.
-
Genome-Wide Investigation of MicroRNAs and Their Targets in Response to Freezing Stress in Medicago sativa L., Based on High-Throughput Sequencing.G3 (Bethesda). 2016 Jan 22;6(3):755-65. doi: 10.1534/g3.115.025981. G3 (Bethesda). 2016. PMID: 26801649 Free PMC article.
-
Multiplicity of hypoxia-inducible transcription factors and their connection to the circadian clock in the zebrafish.Physiol Biochem Zool. 2015 Mar-Apr;88(2):146-57. doi: 10.1086/679751. Epub 2015 Jan 14. Physiol Biochem Zool. 2015. PMID: 25730270 Review.
-
Emerging roles for microRNA in the regulation of Drosophila circadian clock.BMC Neurosci. 2018 Jan 16;19(1):1. doi: 10.1186/s12868-018-0401-8. BMC Neurosci. 2018. PMID: 29338692 Free PMC article. Review.
Cited by
-
Signal Transmission of Biological Reaction-Diffusion System by Using Synchronization.Front Comput Neurosci. 2017 Oct 10;11:92. doi: 10.3389/fncom.2017.00092. eCollection 2017. Front Comput Neurosci. 2017. PMID: 29066966 Free PMC article.
-
Transcriptomic Diversity in the Livers of South African Sardines Participating in the Annual Sardine Run.Genes (Basel). 2021 Mar 4;12(3):368. doi: 10.3390/genes12030368. Genes (Basel). 2021. PMID: 33806647 Free PMC article.
-
Physiological response and microRNA expression profiles in head kidney of genetically improved farmed tilapia (GIFT, Oreochromis niloticus) exposed to acute cold stress.Sci Rep. 2018 Jan 9;8(1):172. doi: 10.1038/s41598-017-18512-6. Sci Rep. 2018. PMID: 29317697 Free PMC article.
-
Identification of Genes Related to Cold Tolerance and Novel Genetic Markers for Molecular Breeding in Taiwan Tilapia (Oreochromis spp.) via Transcriptome Analysis.Animals (Basel). 2021 Dec 13;11(12):3538. doi: 10.3390/ani11123538. Animals (Basel). 2021. PMID: 34944312 Free PMC article.
-
The role of antifreeze genes in the tolerance of cold stress in the Nile tilapia (Oreochromis niloticus).BMC Genomics. 2023 Aug 23;24(1):476. doi: 10.1186/s12864-023-09569-x. BMC Genomics. 2023. PMID: 37612592 Free PMC article.
References
-
- Brett JR. Energetic responses of salmon to temperature. A study of some thermal relations in the physiology and freshwater ecology of sockeye salmon (Oncorhynchus nerka) Am Zool. 1971;11(1):99–113. doi: 10.1093/icb/11.1.99. - DOI
-
- Donaldson MR, Cooke SJ, Patterson DA, Macdonald JS. Cold shock and fish. J Fish Biol. 2008;73(7):1491–1530. doi: 10.1111/j.1095-8649.2008.02061.x. - DOI
-
- Barton BA. Physiological changes in fish from stress in aquaculture with emphasis on the response and effects of corticosteroids. 1991.
Publication types
MeSH terms
Substances
LinkOut - more resources
Full Text Sources
Other Literature Sources
Molecular Biology Databases
