. 2016:2016:3475356.
doi: 10.1155/2016/3475356. Epub 2016 Oct 25.

Hydroalcoholic Extract from Inflorescences of Achyrocline satureioides (Compositae) Ameliorates Dextran Sulphate Sodium-Induced Colitis in Mice by Attenuation in the Production of Inflammatory Cytokines and Oxidative Mediators

Affiliations

Hydroalcoholic Extract from Inflorescences of Achyrocline satureioides (Compositae) Ameliorates Dextran Sulphate Sodium-Induced Colitis in Mice by Attenuation in the Production of Inflammatory Cytokines and Oxidative Mediators

Luisa Mota da Silva et al. Evid Based Complement Alternat Med. 2016.

Abstract

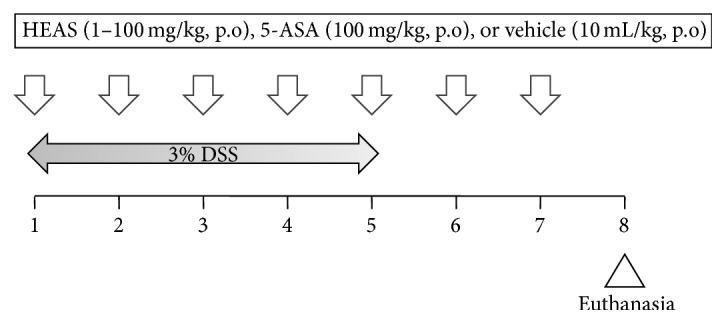
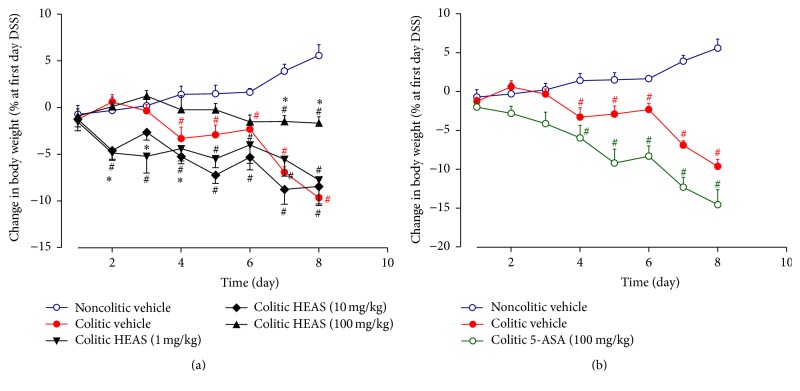
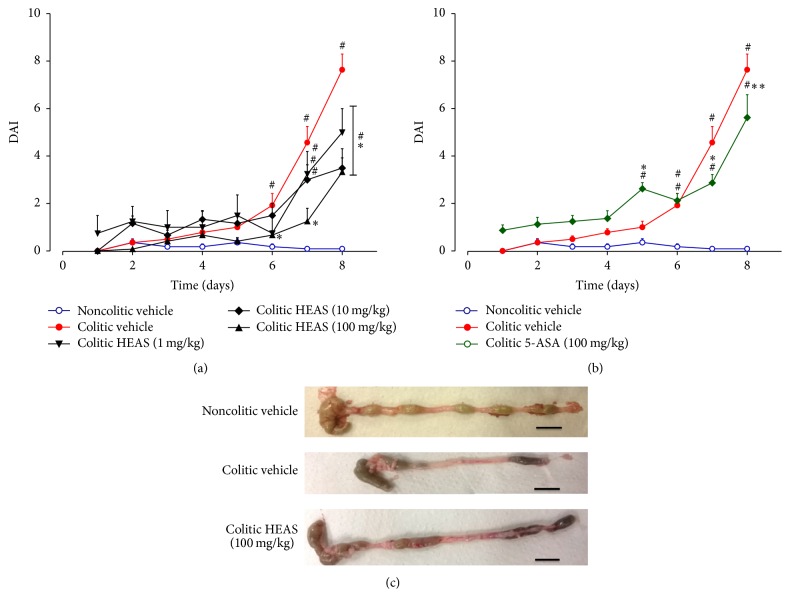
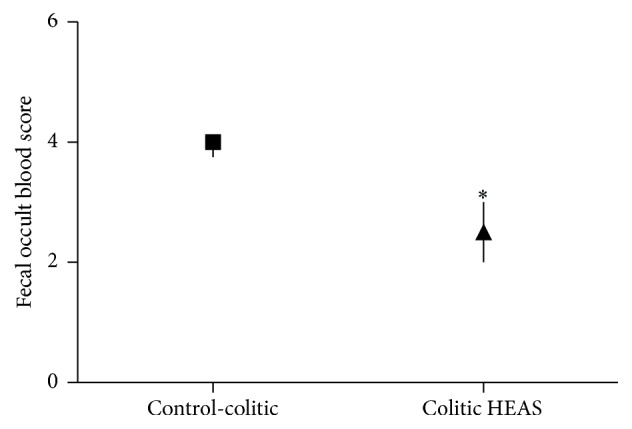
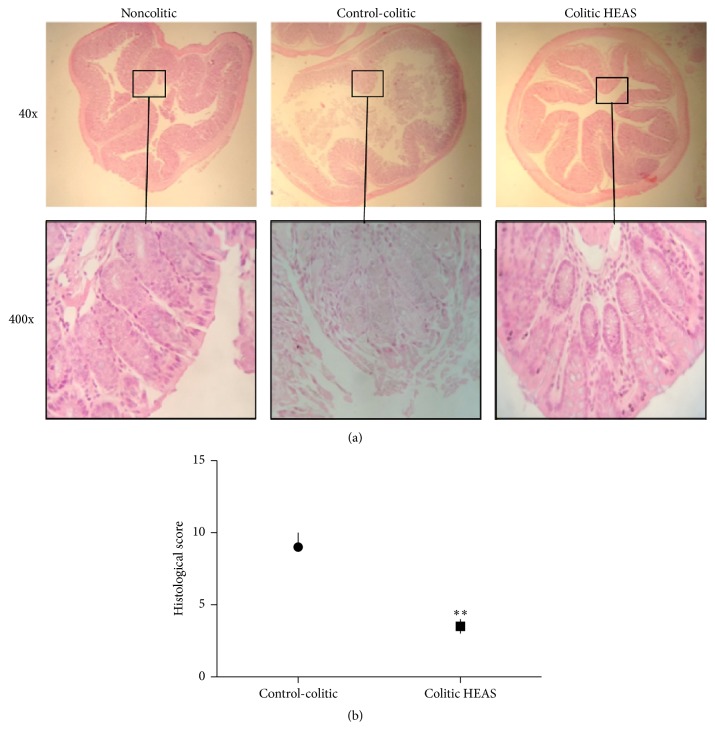
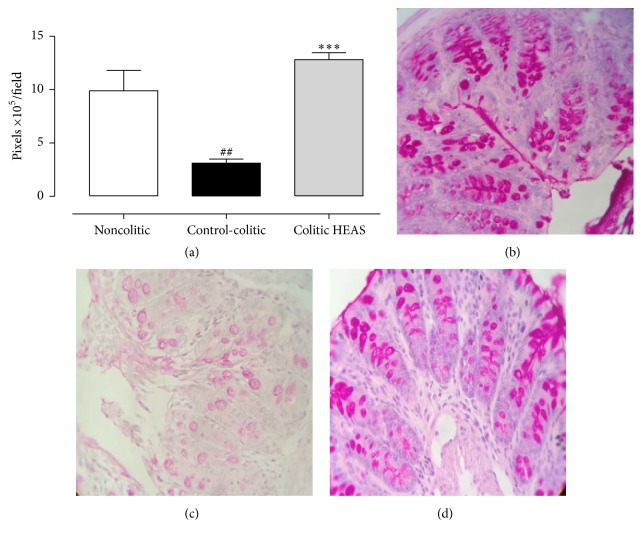
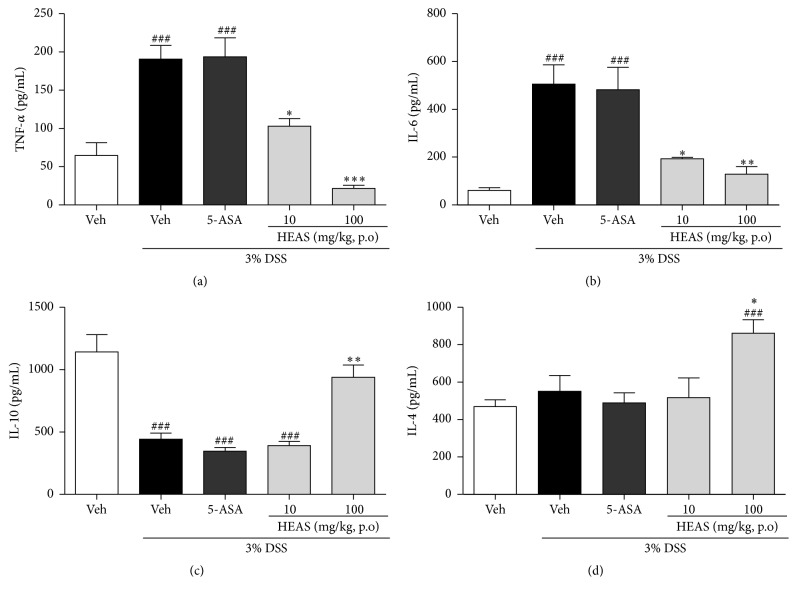
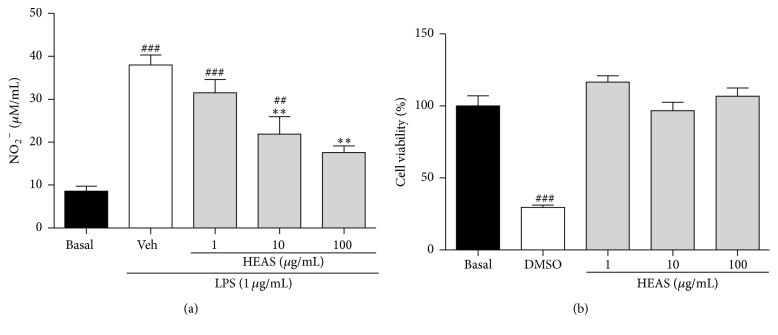
Achyrocline satureioides is a South American herb used to treat inflammatory and gastrointestinal diseases. This study evaluated intestinal anti-inflammatory effects of the hydroalcoholic extract of inflorescences of satureioides (HEAS) in dextran sulfate sodium (DSS) induced colitis in mice. Mice were orally treated with vehicle, 5-aminosalicylic acid (100 mg/kg), or HEAS (1-100 mg/kg). Clinical signs of colitis and colonic histopathological parameters were evaluated, along with the determination of levels of reduced glutathione and lipid hydroperoxide (LOOH), the superoxide dismutase (SOD), and myeloperoxidase (MPO) activity in colon. The colonic content of cytokines (TNF, IL-4, IL-6, and IL-10) was measured. Additionally, the effects of the extract on nitric oxide (NO) release by lipopolysaccharide (LPS) stimulated macrophages and diphenylpicrylhydrazyl levels were determined. Mucin levels and SOD activity, as well as the LOOH, MPO, TNF, and IL-6 accumulation in colon tissues, were normalized by the HEAS administration. In addition, the extract elicited an increase in IL-4 and IL-10 levels in colon. NO release by macrophages was inhibited by HEAS and its scavenger activity was confirmed. Together these results suggest that preparations obtained from inflorescences from A. satureioides could be used in treatment for IBD. Besides, this work corroborates the popular use of A. satureioides in inflammatory disorders.


Figures

Figure 1
Figure 1
Experimental protocol. The animals were treated with vehicle or HEAS (100 mg/kg, po) daily for seven days. Simultaneously, the animals received 3% DSS from 1st to 5th day of treatment.
Figure 2
Figure 2
Effects of HEAS (1–100 mg/kg, (a)) or 5-ASA (100 mg/kg, (b)) on weight loss evolution. Data are expressed as mean ± SEM (n = 10). Statistical comparison was performed using two-way ANOVA followed by Bonferroni's test. # P < 0.01 versus noncolitic group. P < 0.01 versus control-colitic group.
Figure 3
Figure 3
Effects of HEAS (1–100 mg/kg (a)) or 5-ASA (100 mg/kg (b)) on DAI values over the whole experimental period. (c) Macroscopic appearance of colon from mice treated with vehicle or HEAS (100 mg/kg). Data are expressed as mean ± SEM (n = 10). Statistical comparison was performed using two-way ANOVA followed by Bonferroni's test. # P < 0.01 versus noncolitic group. ∗∗ P < 0.01 and P < 0.01 and versus control-colitic group.
Figure 4
Figure 4
Effects of HEAS (100 mg/kg) on fecal occult blood score in DSS-induced colitic mice. Data are expressed as median ± interquartile range of triplicated experiments. Statistical comparison was performed using Mann-Whitney test. P < 0.05 versus control-colitic group.
Figure 5
Figure 5
Effects of HEAS (100 mg/kg) on histological changes in colon tissue of DSS-induced colitic mice. (a) Representative images of all groups. (b) Values of histological changes. Data are expressed as median ± interquartile range (n = 10). Statistical comparison was performed using Mann-Whitney test. ∗∗ P < 0.01 versus control-colitic group.
Figure 6
Figure 6
Effects of HEAS (100 mg/kg) on colonic staining for mucin-like glycoproteins. (a) Mucin staining is expressed as mean ± SEM (n = 10); statistical comparison was performed using one-way ANOVA followed by Bonferroni's test; ## P < 0.01 versus noncolitic group and ∗∗∗ P < 0.001 versus control-colitic group. Representative image of noncolitic group in (b), control-colitic group in (c), and colitic HEAS group in (d). ((b)–(d)) Magnification  = 400x.
Figure 7
Figure 7
In vitro ability of HEAS (1–1000 μg/mL) to scavenge the free radical DPPH. The results are expressed as mean ± SEM of triplicated experiments. Statistical comparison was performed using one-way ANOVA followed by Dunnett's test. ∗∗∗ P < 0.001 versus vehicle group (Veh). AA: ascorbic acid (50 μg/mL).
Figure 8
Figure 8
Effects of HEAS (100 mg/mL) on TNF-α (a), IL-6 (b), IL-10 (c), and IL-4 (d) levels in colon tissue of DSS-induced colitic mice. The results are expressed as mean ± SEM (n = 10). Statistical comparison was performed using one-way ANOVA followed by Bonferroni's test. ### P < 0.001 versus noncolitic group. P < 0.05, ∗∗ P < 0.01, and ∗∗∗ P < 0.001 versus control-colitic group.
Figure 9
Figure 9
Effects of HEAS (1–100 μg/mL) on the LPS induced NO production in isolated rat peritoneal macrophage (a) and on the cellular viability (b). The results are expressed as mean ± SEM of triplicated experiments. Statistical comparison was performed using one-way ANOVA followed by Bonferroni's test. ### P < 0.001 and ## P < 0.01 versus basal group. ∗∗ P < 0.01 versus vehicle group (Veh).
Figure 10
Figure 10
Effects of HEAS (100 mg/mL) on intestinal transit rate of mice. The results are expressed as mean ± SEM (n = 8). Statistical comparison was performed using one-way ANOVA followed by Bonferroni's test. ∗∗∗ P < 0.001 versus vehicle group (Veh).
Figure 11
Figure 11
Effects of HEAS (100 mg/mL) on the body weight (a) and on the relative organs weight (b) of mice. The results are expressed as mean ± SEM (n = 10). Statistical comparison was performed using two-way ANOVA followed by Bonferroni's test.
Figure 12
Figure 12
(a) Luteolin structure; (b) quercetin structure.

References

    1. Da Silva B. C., Lyra A. C., Rocha R., Santana G. O. Epidemiology, demographic characteristics and prognostic predictors of ulcerative colitis. World Journal of Gastroenterology. 2014;20(28):9458–9467. doi: 10.3748/wjg.v20.i28.9458. - DOI - PMC - PubMed
    1. Molodecky N. A., Soon I. S., Rabi D. M., et al. Increasing incidence and prevalence of the inflammatory bowel diseases with time, based on systematic review. Gastroenterology. 2012;142(1):46–54.e42. doi: 10.1053/j.gastro.2011.10.001. - DOI - PubMed
    1. Di Sabatino A., Biancheri P., Rovedatti L., MacDonald T. T., Corazza G. R. Recent advances in understanding ulcerative colitis. Internal and Emergency Medicine. 2012;7(2):103–111. doi: 10.1007/s11739-011-0719-z. - DOI - PubMed
    1. Kornbluth A., Sachar D. B. Ulcerative colitis practice guidelines in adults: American college of gastroenterology, practice parameters committee. The American Journal of Gastroenterology. 2010;105(3):501–523. doi: 10.1038/ajg.2009.727. - DOI - PubMed
    1. Feuerstein J. D., Cheifetz A. S. Ulcerative colitis: epidemiology, diagnosis, and management. Mayo Clinic Proceedings. 2014;89(11):1553–1563. doi: 10.1016/j.mayocp.2014.07.002. - DOI - PubMed

LinkOut - more resources