Review
. 2016 Oct 17:2:24.
doi: 10.1186/s40942-016-0049-4. eCollection 2016.

The role of optical coherence tomography in Alzheimer's disease

Affiliations
Review

The role of optical coherence tomography in Alzheimer's disease

Leonardo Provetti Cunha et al. Int J Retina Vitreous. .

Abstract

Background: Alzheimer's disease (AD) is the most common cause of dementia and its incidence is increasing worldwide along with population aging. Previous clinical and histologic studies suggest that the neurodegenerative process, which affects the brain, may also affect the retina of AD patients.

Main body: Optical coherence tomography (OCT) is a non-invasive technology that acquires cross-sectional images of retinal structures allowing neural fundus integrity assessment. Several previous studies demonstrated that both peripapillary retinal nerve fiber layer and macular thickness measurements assessed by OCT were able to detect neuronal loss in AD. Moreover, recent advances in OCT technology, have allowed substantial enhancement in ultrastructural evaluation of the macula, enabling the assessment not only of full-thickness retinal measurements but also of inner retinal layers, which seems to be a promising approach, mainly regarding the assessment of retinal ganglion cell layer impairment in AD patients. Furthermore, retinal neuronal loss seems to correlate with cognitive impairment in AD, reinforcing the promising role of OCT in the clinical evaluation of these patients.

Conclusion: The purpose of this article is to review the main findings on OCT in AD patients, to discuss the role of this important diagnostic tool in these patients and how OCT technology may be useful in understanding morphological retinal changes in AD.

Keywords: Alzheimer’s disease; Dementia; Ganglion cell layer; Macula; Mild cognitive impairment; Optic nerve; Optical coherence tomography; Retina; Retinal nerve fiber layer.


Figures

Fig. 1
Fig. 1
Examples of Topcon 3D OCT-2000 generated full-thickness macular measurements in the right (OD) and left (OS) eye of a patient with Alzheimer’s disease. Measurements in different sectors are indicated with numbers and represented in colors that correspond to the normal distribution. Sectors in green indicate values within normal range; in yellow less than the 5th, in red less than the 1st compared with an age-matched reference population. Note that several macular thickness parameters are below normal range, particularly in inner segments
Fig. 2
Fig. 2
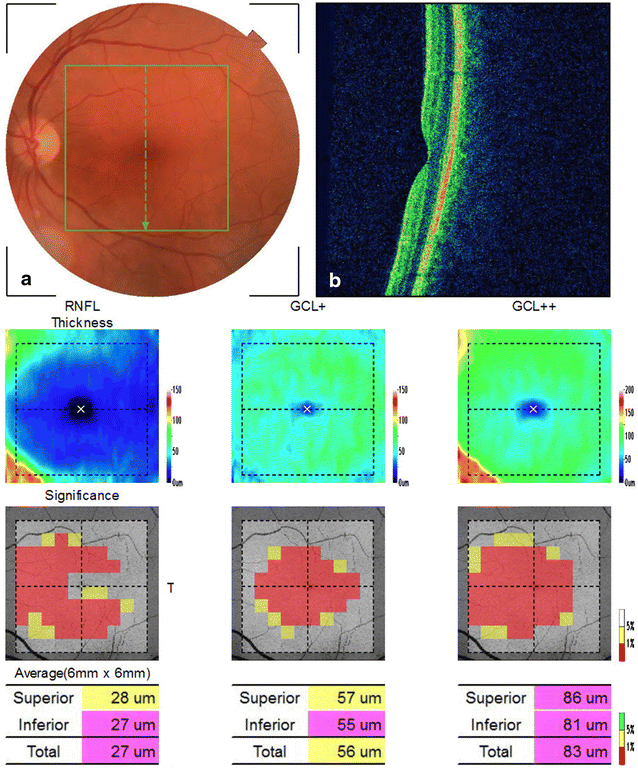
A print out of inner macular analysis using SD-OCT in a patient with Alzheimer disease. The built-in viewer shows the color retinography, oct line scan, macular RNFL thickness (mRNFL), the ganglion cell layer + inner plexiform layer (GCL+) thickness, and the RNFL + GCL + IPL (GCL++) thickness. a Fundus color. The green square line demarcates the macular area scanned (7 × 7 mm) by the FD-OCT. b Optical coherence tomography (vertical scan) of macular area. Center pseudo-colored map of the measured thickness. Lower each grid in the 10 × 10 grid was color coded with no color (within the normal limit), yellow (outside of the 95 % normal limit), or red (outside of the 99 % normal limit)
Fig. 3
Fig. 3
Example of inner macular thickness measurements by SD-OCT of AD patient. On the left (a, c, e) represents the scanned area (7 × 7 mm). Each 10 × 10 grid was color coded with no color (within the normal limit), yellow (outside the 95 % normal limit), or red (outside the 99 % normal limit). The total analyzed area corresponding to 6 × 6 mm. On the right vertical OCT scans through the fovea. The white lines correspond to the boundaries of the inner retinal layers identified during the segmentation process. b Macular RNFL (mRNFL) thickness measurement, through the internal limiting membrane (ILM) to inner boundary of ganglion cell layer (GCL). d GCL plus inner plexiform layer (IPL), through the inner boundary of GCL to outer boundary of IPL (GCL+). f mRNFL plus GCL plus IPL, trough the ILM to outer boundary of IPL (GCL++)

References

    1. Blennow K, de Leon MJ, Zetterberg H. Alzheimer’s disease. Lancet. 2006;368:387–403. doi: 10.1016/S0140-6736(06)69113-7. - DOI - PubMed
    1. McKhann G, Drachman D, Folstein M, Katzman R, Price D, Stadlan EM. Clinical diagnosis of Alzheimer’s disease: report of the NINCDS-ADRDA Work Group under the auspices of Department of Health and Human Services Task Force on Alzheimer’s disease. Neurology. 1984;34:939–944. doi: 10.1212/WNL.34.7.939. - DOI - PubMed
    1. Cronin-Golomb A, Corkin S, Rizzo JF, Cohen J, Growdon JH, Banks KS. Visual dysfunction in Alzheimer’s disease: relation to normal aging. Ann Neurol. 1991;29:41–52. doi: 10.1002/ana.410290110. - DOI - PubMed
    1. Cronin-Golomb A. Vision in Alzheimer’s disease. Gerontologist. 1995;35:370–376. doi: 10.1093/geront/35.3.370. - DOI - PubMed
    1. Armstrong RA. Visual field defects in Alzheimer’s disease patients may reflect differential pathology in the primary visual cortex. Optom Vis Sci. 1996;73:677–682. doi: 10.1097/00006324-199611000-00001. - DOI - PubMed

LinkOut - more resources