. 2016 Nov 10;5(6):5.
doi: 10.1167/tvst.5.6.5. eCollection 2016 Nov.

Aqueous Angiography with Fluorescein and Indocyanine Green in Bovine Eyes

Affiliations

Aqueous Angiography with Fluorescein and Indocyanine Green in Bovine Eyes

Alex S Huang et al. Transl Vis Sci Technol. .

Abstract

Purpose: We characterize aqueous angiography as a real-time aqueous humor outflow imaging (AHO) modality in cow eyes with two tracers of different molecular characteristics.

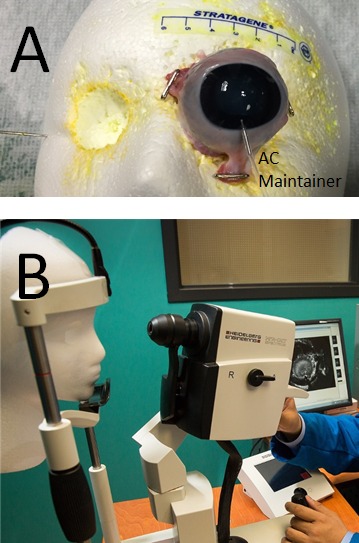
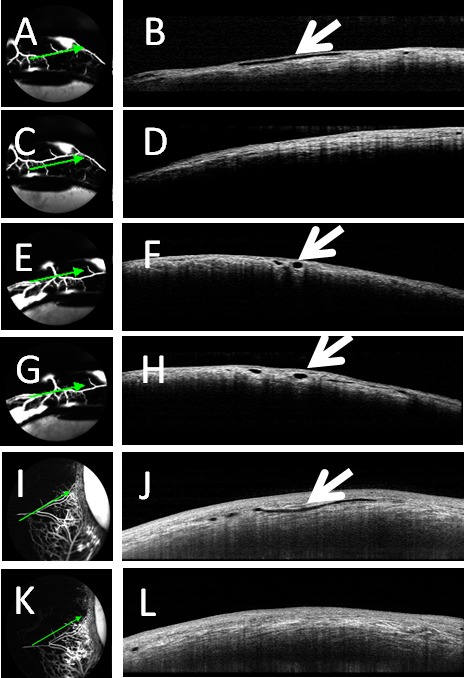
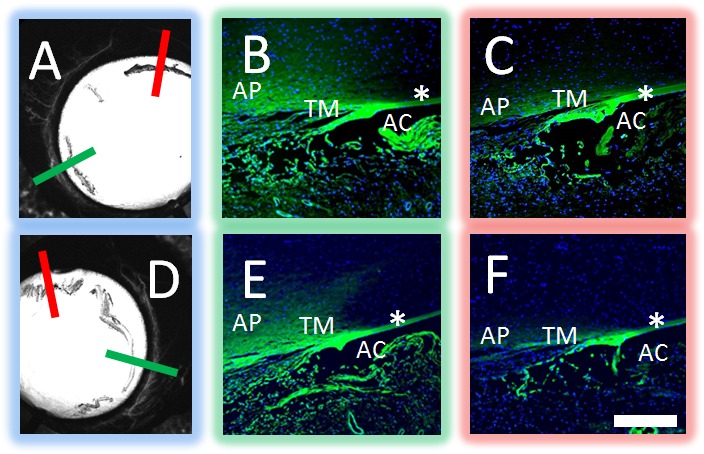
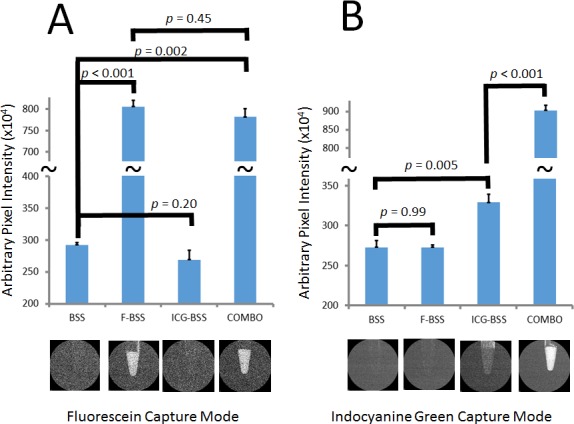
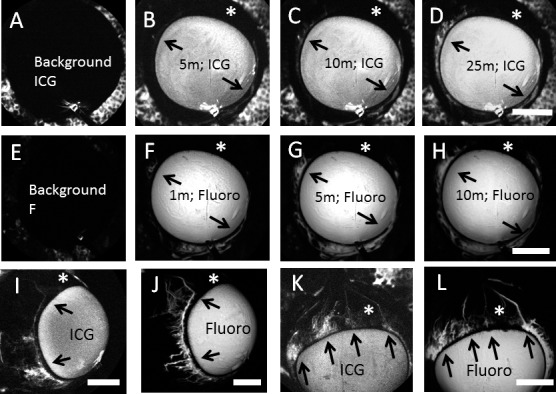
Methods: Cow enucleated eyes (n = 31) were obtained and perfused with balanced salt solution via a Lewicky AC maintainer through a 1-mm side-port. Fluorescein (2.5%) or indocyanine green (ICG; 0.4%) were introduced intracamerally at 10 mm Hg individually or sequentially. With an angiographer, infrared and fluorescent images were acquired. Concurrent anterior segment optical coherence tomography (OCT) was performed, and fixable fluorescent dextrans were introduced into the eye for histologic analysis of angiographically positive and negative areas.

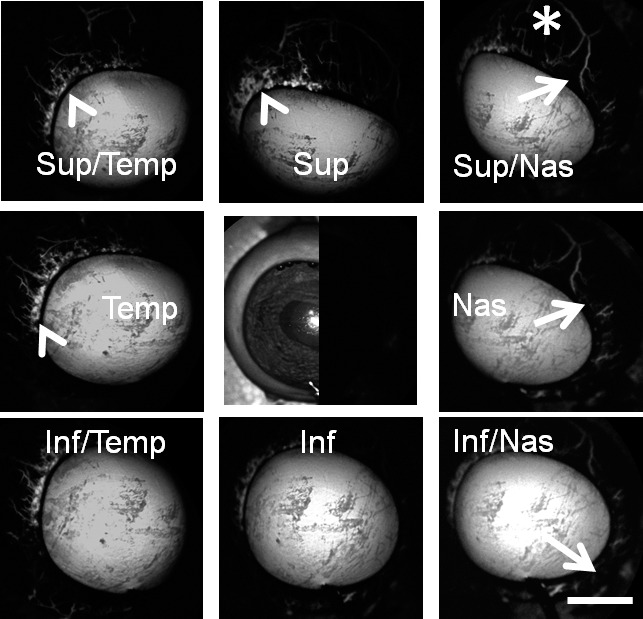
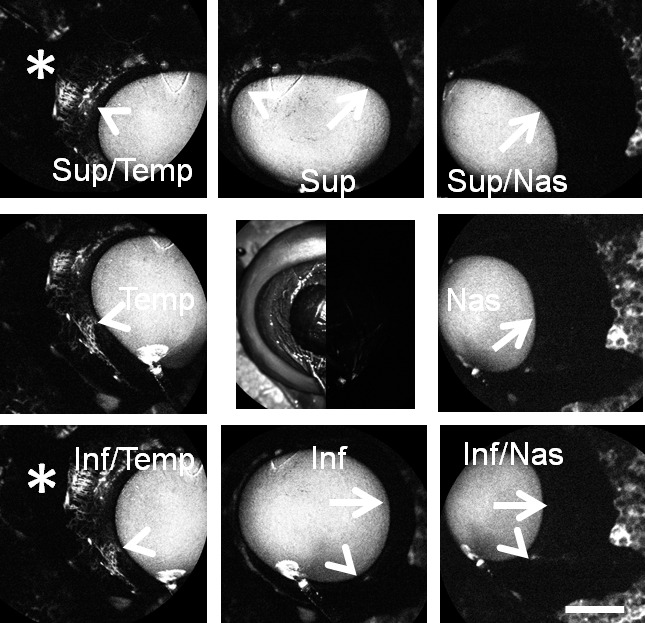
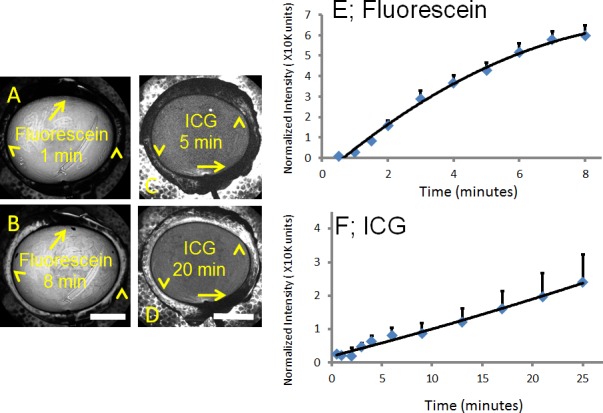
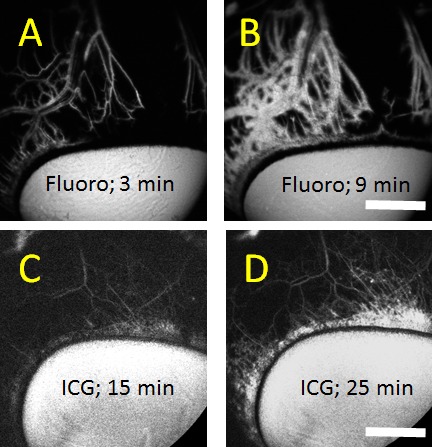
Results: Aqueous angiography in cow eyes with fluorescein and ICG yielded high-quality images with segmental patterns. Over time, ICG maintained a better intraluminal presence. Angiographically positive, but not negative, areas demonstrated intrascleral lumens with anterior segment OCT. Aqueous angiography with fluorescent dextrans led to their trapping in AHO pathways. Sequential aqueous angiography with ICG followed by fluorescein in cow eyes demonstrated similar patterns.

Conclusions: Aqueous angiography in model cow eyes demonstrated segmental angiographic outflow patterns with either fluorescein or ICG as a tracer.

Translational relevance: Further characterization of segmental AHO with aqueous angiography may allow for intelligent placement of trabecular bypass minimally invasive glaucoma surgeries for improved surgical results.

Keywords: angiography; aqueous angiography; fluorescein angiography; minimally invasive glaucoma surgeries.


Figures

Figure 1
Figure 1
Aqueous angiography in post-mortem eyes. (A) Aqueous angiography was performed by obtaining postmortem eyes, trimming excess extraocular tissue, and pinning posterior muscles and tissue to a Styrofoam face. Inferior, the AC-maintainer entered the AC. Note that the face had holes cut out where the eyes would be located to situate and secure the postmortem eye without excessive ocular surface strain. Discoloration of Styrofoam was from prior use and staining from fluorescent dyes. (B) Using the Spectralis HRA+OCT (Heidelberg Engineering), which is a clinical device for human imaging, the chin of the Styrofoam face was placed in the chin rest similar to how a live patient would be imaged in the clinic.
Figure 2
Figure 2
Aqueous angiography with fluorescein in bovine eyes. Images from different positions were taken on a representative cow eye using fluorescein for aqueous angiography demonstrating segmental and differentially emphasized angiographic patterns. Arrowheads denoted regions of perilimbal signal, and asterisks highlighted regions of distal signal. Arrows showed areas of relatively low perilimbal signal. The central image was a composite image of cSLO infrared (left side) and preinjection background (right side) images. Sup superior; Temp, temporal; Nas, nasal; Inf, inferior. Scale bar: 1 cm.
Figure 3
Figure 3
Aqueous angiography with ICG in bovine eyes. Images from different positions were taken on a representative cow eye using ICG for aqueous angiography demonstrating segmental and differentially emphasized angiographic patterns. Arrowheads denoted regions of perilimbal signal, and asterisks highlighted regions of distal signal. Arrows showed areas of relatively low perilimbal signal. The central image was a composite image of cSLO infrared (left side) and preinjection background (right side) images. Note that the preinjection background was even less intense than that of the stained Styrofoam (polygonal background pattern) that the eye was attached to. Scale bar: 1 cm.
Figure 4
Figure 4
Aqueous angiograph signal intensity rose over time in cow eyes. (A, B) Aqueous angiography with fluorescein over time demonstrated accumulated signal intensity (arrowheads). (C, D) Aqueous angiography with ICG over time also demonstrated accumulated signal intensity (arrowheads). (A–D) With fluorescein and ICG, areas with less signal intensity stayed stable (arrows). Total normalized pixel intensity values from 10 eyes each for (E) fluorescein and (F) ICG were recorded as a function of time at 10 mm Hg with ICG demonstrating a smaller and slower rise in signal intensity. Graphs showed mean ± SE. min, minutes. Scale bars: 1 cm.
Figure 5
Figure 5
Aqueous angiography comparing fluorescein (fluoro) to ICG. (A–D) Aqueous angiography from a tangential as opposed to a face-on view provided a better image of outflow pathway branching. Face-on images distorted aqueous angiography patterns due to the globe curvature. (A, B) Fluorescein aqueous angiography over time initially showed sharply demarcated angiographic patterns that became diffuse with time likely secondary to leakage. (C, D) Alternatively, ICG aqueous angiography signal increased in brightness over time but mostly maintained sharply demarcated patterns with better retained intraluminal presence. Scale bars: 1 cm.
Figure 6
Figure 6
Aqueous angiography and OCT in cow eyes. Aqueous angiography was conducted in cow eyes in parallel with anterior segment OCT with fluorescein (A, C, E, G) or ICG (I, K). (A, E, G, I) Angiographically-positive areas demonstrated (B, F, H, J) intrascleral lumens on OCT (arrows). However, angiographically lacking areas (C, K) were (D, L) devoid of intrascleral lumens on OCT.
Figure 7
Figure 7
Aqueous angiography localized to AHO pathways in cow eyes. Aqueous angiography was performed with 3 kD fixable fluorescent dextrans in cow eyes. Two representative eyes (A–C and D–F) are shown here. Angiographically positive (A, D; green lines) or diminished (A, D; red lines) regions were identified with aqueous angiography, marked, and prepared for paraffin sectioning. In the first eye (A–C), angiographically positive (green line in [A] corresponds to [B]) but not angiographically diminished (red line in [A] corresponds to [C]) regions showed trapping of dextrans within outflow pathways. In the second eye (D–F), angiographically positive (green line in [D] corresponds to [E]) but not angiographically lacking (red line in [D] corresponds to [F]) regions also showed trapping of dextrans within outflow pathways. Note similar degree of nonspecific fluorescence seen in strips of Descemet's membrane and iris edge in all cases (asterisks). As the fixable fluorescent dextrans were attached to nearby surfaces with fixation, nonspecific positive fluorescence lining the AC was expected after introduction of perfusion fixation. Scale bar: 100 μm.
Figure 8
Figure 8
Fluorescence Intensity of fluorescein, ICG, and combination. Average fluorescence intensity was detected using fluorescein and ICG capture mode on standard solutions of BSS, F-BSS, ICG-BSS, and COMBO at equal molar concentrations of the dyes. (A) Using fluorescein capture mode, BSS and ICG-BSS showed little fluorescence. (A) F-BSS and COMBO showed increased fluorescence that was not statistically different from each other. (B) Using ICG capture mode, BSS and F-BSS showed little fluorescence. (B) However, while ICG-BSS showed an expected increased fluorescence, COMBO showed an unexpected larger increase in fluorescence that was statistically greater than ICG-BSS alone.
Figure 9
Figure 9
Sequential Aqueous angiography with ICG followed by fluorescein (Fluoro) demonstrated similar patterns. Sequential aqueous angiography was performed first with ICG followed by fluorescein. (A–H) Sequential aqueous angiography was conducted in one cow eye with (B–D) ICG administration and ICG capture mode before (F–H) fluorescein administration and fluorescein capture mode over time. (A, E) Background images demonstrated lack of fluorescence with appropriate capture modes. (A–H) Comparing the ICG and fluorescein patterns, regions with (arrows) and without (asterisks) angiographic signal were similar. Tangential imaging with sequential aqueous angiography using ICG first followed by fluorescein in two additional eyes ([I, J] and [K, L]) also showed the same result in that regions with (arrows) and without (asterisks) angiographic signal appeared similar comparing the two dyes. Scale bars: 1 cm.

References

    1. Craven ER,, Katz LJ,, Wells JM,, Giamporcaro JE. Cataract surgery with trabecular micro-bypass stent implantation in patients with mild-to-moderate open-angle glaucoma and cataract: two-year follow-up. J Cataract Refract Surg. 2012. ; 38: 1339–1345. - PubMed
    1. Minckler D,, Mosaed S,, Dustin L,, Ms BF. Trabectome (trabeculectomy-internal approach): additional experience and extended follow-up. Trans Am Ophthalmol Soc. 2008. ; 106: 149–159, discussion 159–160. - PMC - PubMed
    1. Swaminathan SS,, Oh D-J,, Kang MH,, Rhee DJ. Aqueous outflow: segmental and distal flow. J Cataract Refract Surg. 2014. ; 40: 1263–1272. - PMC - PubMed
    1. Saraswathy S,, Tan JC,, Yu F,, et al. Aqueous angiography: real-time and physiologic aqueous humor outflow imaging. PLoS One. 2016. ; 11: e0147176. - PMC - PubMed
    1. Chang JY,, Folz SJ,, Laryea SN,, Overby DR. Multi-scale analysis of segmental outflow patterns in human trabecular meshwork with changing intraocular pressure. J Ocul Pharmacol Ther. 2014. ; 30: 213–223. - PubMed