. 2016 Nov 16:7:13426.
doi: 10.1038/ncomms13426.

17q21 asthma-risk variants switch CTCF binding and regulate IL-2 production by T cells

Affiliations

17q21 asthma-risk variants switch CTCF binding and regulate IL-2 production by T cells

Benjamin Joachim Schmiedel et al. Nat Commun. .

Abstract

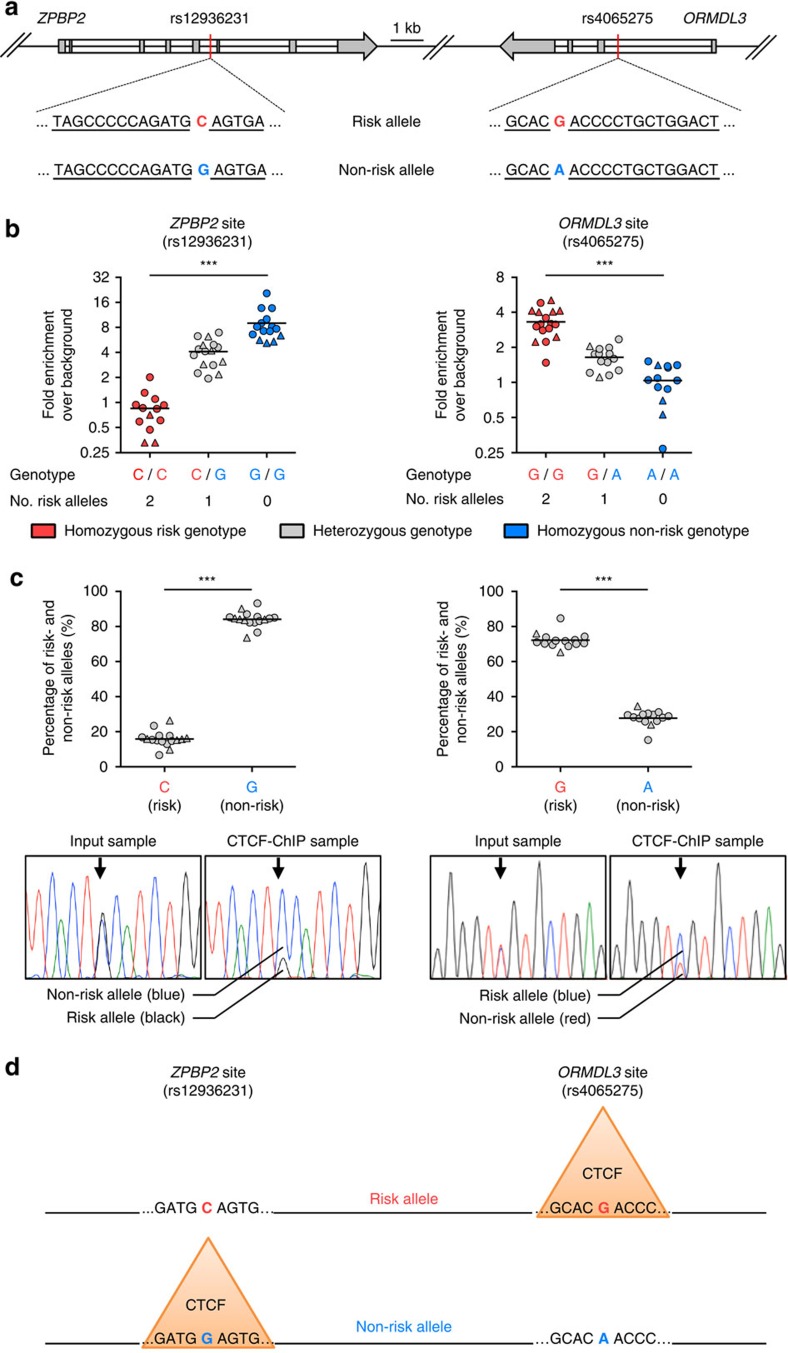
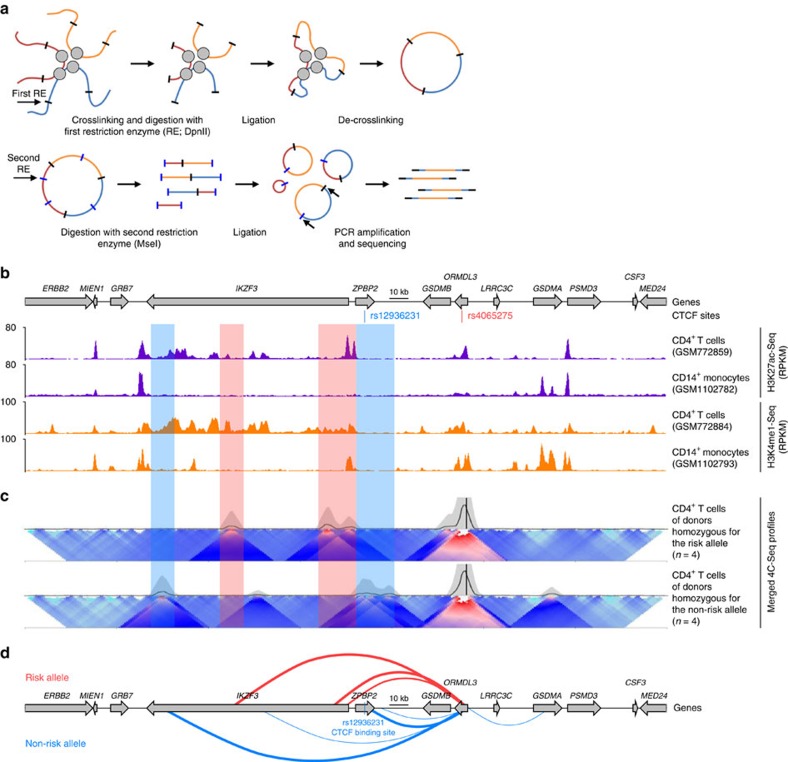
Asthma and autoimmune disease susceptibility has been strongly linked to genetic variants in the 17q21 haploblock that alter the expression of ORMDL3; however, the molecular mechanisms by which these variants perturb gene expression and the cell types in which this effect is most prominent are unclear. We found several 17q21 variants overlapped enhancers present mainly in primary immune cell types. CD4+ T cells showed the greatest increase (threefold) in ORMDL3 expression in individuals carrying the asthma-risk alleles, where ORMDL3 negatively regulated interleukin-2 production. The asthma-risk variants rs4065275 and rs12936231 switched CTCF-binding sites in the 17q21 locus, and 4C-Seq assays showed that several distal cis-regulatory elements upstream of the disrupted ZPBP2 CTCF-binding site interacted with the ORMDL3 promoter region in CD4+ T cells exclusively from subjects carrying asthma-risk alleles. Overall, our results suggested that T cells are one of the most prominent cell types affected by 17q21 variants.


Figures

Figure 1
Figure 1. 17q21 SNPs overlap immune cell enhancers.
(a) University of California Santa Cruz (UCSC) tracks showing chromosomal location and genes present in the 17q21 locus, containing a large haplotype block of asthma-associated SNPs; the location of asthma-risk SNP rs7216389 is indicated as blue line in the gene track. Black lines indicate SNPs' genomic location, and red lines are SNPs that overlap peaks of DNase hypersensitivity sites (DHS) from multiple cell types obtained from the ENCODE Encyclopedia (version 2) provided by the ENCODE Project Consortium (see Methods). Exemplary DHS tracks, H3K27ac and H3K4me1 enrichment tracks from CD4+ T cells, CD14+ monocytes and brain tissue (from ENCODE Project and NIH Epigenomics Roadmap Consortiums) are shown along with UCSC multispecies conservation tracks. (b) Distribution of asthma-associated 17q21 SNPs in different genomic regions. (c) The average number of DHS in the 17q21 locus of immune versus non-immune cell types (n=10 and n=52, respectively) and (d) the 62 primary cell types (indicated as dots, profiled by the ENCODE Project Consortium, see Methods) ordered based on the number of DHS in the 17q21 locus. The top hits and discussed cell types are named and marked in red. (e) Overlap of DHS and 17q21 SNPs. (f) Number of DHS that directly overlap 17q21 SNPs in various cell types (full list in Supplementary Data set 2b). Error bars are mean±s.e.m.; ***P<0.001 by Student's unpaired two-tailed t-test, and following Bonferroni correction for multiple testing.
Figure 2
Figure 2. 17q21 SNPs have pronounced effects on ORMDL3 expression in primary T and B cells.
(a) Real-time PCR quantification of ORMDL3 and GSDMB transcript levels (relative to the housekeeping gene YWHAZ) in the indicated primary immune cell types (n=34 donors), bronchial epithelial cells (BEC; n=3), lung cancer cells (A549; n=1) and human umbilical vein endothelial cells (HUVEC; n=1). (b) Correlation of ORMDL3 and GSDMB transcript levels between naive CD4+ T cells and CD8+ T cells. (c) Correlation between ORMDL3 and GSDMB transcript levels in naive CD4+ T cells and CD8+ T cells. (d) ORMDL3 and GSDMB transcript levels in the indicated cell types from donors categorized based on the genotype for asthma-associated SNP rs7216389 (homozygous risk (T/T): n=9, red bar; heterozygous (T/C): n=16, grey bar; homozygous non-risk (C/C): n=9, blue bar). (e) Heat maps show Log2 fold change in transcript levels of ORMDL3 and GSDMB relative to the average expression levels seen in the corresponding cell types from donors with the non-risk (C/C) genotype; the donors are ordered based on genotype and the number indicates the unique ID (Supplementary Data set 3). (f) ORMDL3 and GSDMB transcript levels in naive CD4+ T cells and in in vitro expanded and polarized TH1 or TH2 cells from matched donors (see Methods), categorized based on the genotype as in d. Each dot represents data from a single donor. Error bars are mean±s.e.m.; *P<0.05, **P<0.01, and ***P<0.001 by Student's unpaired two-tailed t-test; NS, not significant; r value indicates the Spearman correlation coefficient.
Figure 3
Figure 3. 17q21 SNPs affect the function of an intronic enhancer in ORMDL3.
(a) 17q21 SNPs (columns) that overlap with DHS (shown in dark blue squares) in different primary cell types (rows), as described in Fig. 1e,f. Green boxes highlight SNPs that overlap DHS enriched in lymphocytes and orange boxes highlight SNPs that overlap DHS in many immune and non-immune cell types. Bottom panel shows UCSC tracks of the 17q21 locus, along with asthma-associated SNPs that overlap DHS. H3K27ac enrichment tracks of CD4+ T cells and CD14+ monocytes (from NIH Epigenomics Roadmap) are shown below. Boxes highlight SNPs of interest that overlap DHS. (b) Tracks showing comparison of average H3K27ac enrichment values (RPKM) (in each 50-bp window spanning 1 kb region on either side of the SNPs of interest) between homozygous risk (rs7216389 T/T, n=36) and non-risk (rs7216389 C/C, n=7) samples. Arrow indicates location of the SNP; error bars are mean±s.e.m. (c) H3K27ac enrichment values for a 200-bp region around the indicated asthma-risk SNP. Each dot represents data from a single assay; error bars indicate mean±s.e.m.; numbers indicate average fold change in H3K27ac enrichment between carries with risk and non-risk allele.
Figure 4
Figure 4. CTCF-binding sites are switched by 17q21 SNPs.
(a) Schematic representation of the 17q21 locus containing CTCF-binding motifs (underlined sequence) that overlap with the linked SNPs rs12936231 (C/G; ZPBP2 site) and rs4065275 (G/A; ORMDL3 site); the asthma-risk SNP is indicated in red, the non-risk SNP in blue. (b) Real-time PCR quantification of DNA sequences, containing the 17q21 linked SNPs rs12936231 (ZPBP2 site) or rs4065275 (ORMDL3 site), after anti-CTCF ChIP of chromatin extracts obtained from polarized TH1, TH2 cells (shown as circles) and primary CD8+ T cells (shown as triangles; see Methods) of donors categorized based on allelic status of SNP overlapping the respective CTCF motif (as shown in a). Data are expressed as fold enrichment relative to an irrelevant background control; data were obtained from four independent experiments and each dot represents data from a single ChIP assay; n=44 assays from 15 subjects (see Methods and Supplementary Fig. 4c,d). (c) Percentage of DNA sequences containing the risk and non-risk SNPs at rs12936231 (ZPBP2 site) or rs4065275 (ORMDL3 site) following Sanger sequencing of DNA obtained following anti-CTCF ChIP assay performed in heterozygous donors shown in b (see Methods and Supplementary Fig. 4b); shown below are nucleotide traces from Sanger sequencing of ChIP and input DNA from a representative experiment. (d) Schematic representation of the switch in CTCF binding introduced by the linked asthma-risk SNPs (rs12936231 and rs4065275) in the 17q21 locus; orange triangles represent binding of CTCF to the preferred allele. ***P<0.001 by Mann–Whitney U-test.
Figure 5
Figure 5. Asthma-risk SNPs modify long-range ORMDL3 promoter-enhancer interactions.
(a) Schematic representation of the 4C-Seq assay and the choice of restriction enzymes used for various steps. (b) UCSC gene tracks of 17q21 locus (chr17: 37,849,238 - 38,189,238 (hg19); 340 kb) showing the CTCF-binding sites that overlap with the linked SNPs rs12936231 (C/G; ZPBP2 site) and rs4065275 (G/A; ORMDL3 site), along with H3K27ac and H3K4me1 enrichment tracks of CD4+ T cells and CD14+ monocytes. (c) Merged 4C-Seq domainograms, using colour-coded intensity values to indicate relative levels of interactions (red denotes the strongest interactions and dark blue to turquoise representing gradually decreasing frequencies), generated using 4Cseqpipe (see Methods) are displayed for CD4+ T cells from subjects homozygous for the risk (n=4) and non-risk alleles (n=4); the bait region (ORMDL3 promoter) is marked as a black line. Shaded boxes highlight regions that interact with the bait region at the ORMDL3 promoter in the risk and non-risk alleles (shown in red and blue colour, respectively). (d) Schematic representation of the DNA regions interacting with the ORMDL3 promoter in the asthma-risk (red colour) and non-risk alleles (blue colour), the CTCF-binding site in the ZPBP2 region of the non-risk alleles in shown as a blue line.
Figure 6
Figure 6. ORMDL3 negatively regulates IL-2 production by CD4+ T cells.
(a) Experimental design used for assessing effects of knocking down genes of interest in memory CD4+ T cells. (b) Real-time PCR quantification of ORMDL3 and GSDMB transcript levels (relative to the housekeeping gene YWHAZ) in memory CD4+ T cells 48 h after knock down with control siRNA pools, ORMDL3 or GSDMB siRNA pools (n=12 donors). (c) Effects of ORMDL3 knockdown on cytokine release by memory CD4+ T cells activated for 48 h with antibodies to CD3 and CD28; data are expressed as fold change (FC) relative to control siRNA-treated conditions; error bars indicate mean±s.e.m. (d) Absolute values of IL-2 protein levels in culture supernatants from cells treated with the indicated siRNA pools. Data are presented as means of biological duplicates. (e) Time course of IL2 mRNA expression in activated memory CD4+ T cells (n=24) following treatment with ORMDL3 (open circles) or control siRNA pools (closed circle); data from each donor for different time points after stimulation is shown in the right panel. (f) Representative FACS plots showing intracellular staining of IL-2 in memory CD4+ T cells activated for 6 or 18 h (after knockdown with siRNA pool for ORMDL3 or control siRNA); percentage of IL-2 producing cells in each donor is shown to the right (n=18). (g) Correlation of the levels of ORMDL3 transcripts (measured at baseline) and IL2 transcripts produced following ex vivo stimulation of memory CD4+ T cells (n=36) with phorbol myristate acetate (PMA) and Ionomycin for 4 h. (h) Effects of GSDMB knockdown on cytokine release by memory CD4+ T cells, as described in c. Each dot represents data from a single donor. r, Spearman correlation coefficient; *P<0.05, **P<0.01, and ***P<0.001 by Student's paired two-tailed t-test, and following Bonferroni correction for multiple testing in c,d and h (see Methods).

References

    1. Moffatt M. F. et al. Genetic variants regulating ORMDL3 expression contribute to the risk of childhood asthma. Nature 448, 470–U475 (2007). - PubMed
    1. Barrett J. C. et al. Genome-wide association study and meta-analysis find that over 40 loci affect risk of type 1 diabetes. Nat. Genet. 41, 703–707 (2009). - PMC - PubMed
    1. Franke A. et al. Genome-wide meta-analysis increases to 71 the number of confirmed Crohn's disease susceptibility loci. Nat. Genet. 42, 1118–1125 (2010). - PMC - PubMed
    1. McGovern D. P. et al. Genome-wide association identifies multiple ulcerative colitis susceptibility loci. Nat. Genet. 42, 332–337 (2010). - PMC - PubMed
    1. Anderson C. A. et al. Meta-analysis identifies 29 additional ulcerative colitis risk loci, increasing the number of confirmed associations to 47. Nat. Genet. 43, 246–252 (2011). - PMC - PubMed

Publication types