. 2016 Nov 16:7:13490.
doi: 10.1038/ncomms13490.

Epigenetic and genetic components of height regulation

Affiliations

Epigenetic and genetic components of height regulation

Stefania Benonisdottir et al. Nat Commun. .

Abstract

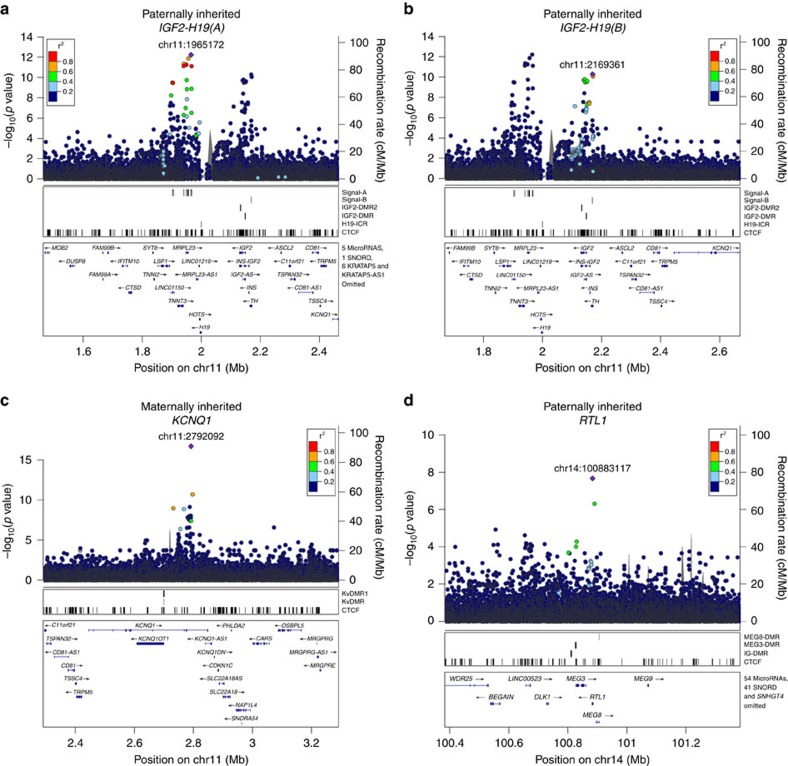
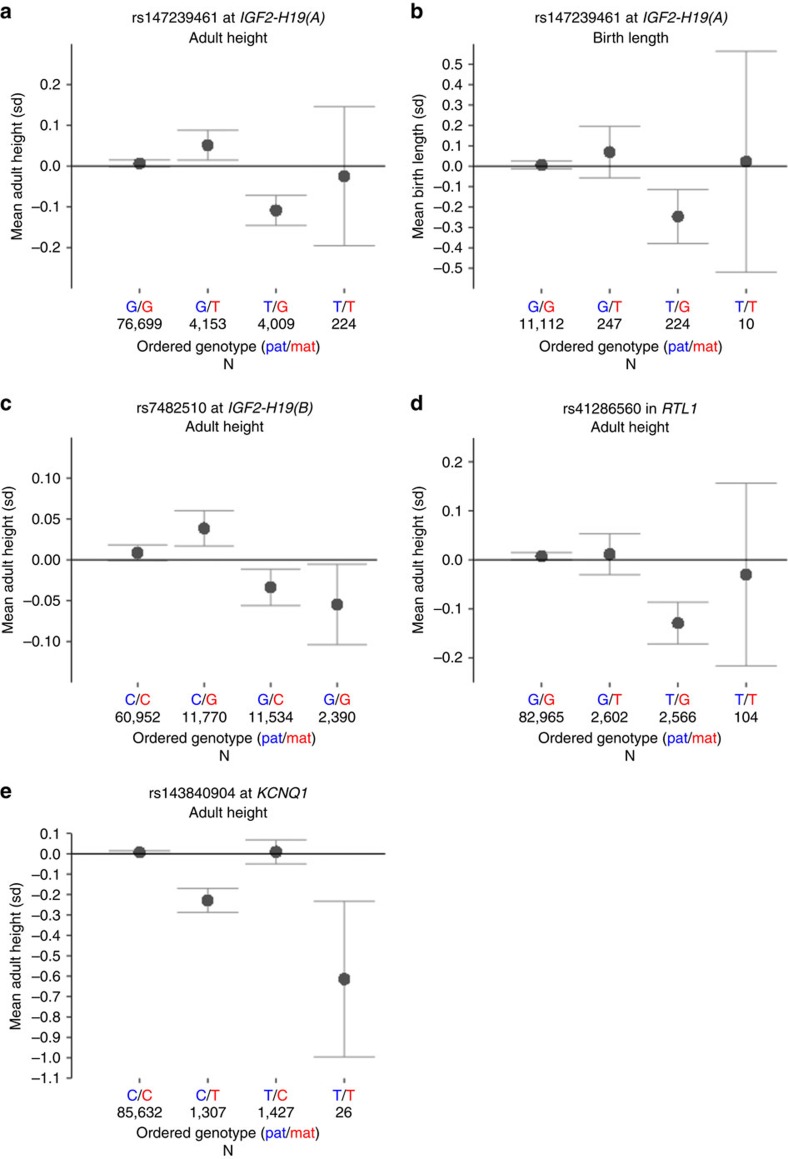
Adult height is a highly heritable trait. Here we identified 31.6 million sequence variants by whole-genome sequencing of 8,453 Icelanders and tested them for association with adult height by imputing them into 88,835 Icelanders. Here we discovered 13 novel height associations by testing four different models including parent-of-origin (|β|=0.4-10.6 cm). The minor alleles of three parent-of-origin signals associate with less height only when inherited from the father and are located within imprinted regions (IGF2-H19 and DLK1-MEG3). We also examined the association of these sequence variants in a set of 12,645 Icelanders with birth length measurements. Two of the novel variants, (IGF2-H19 and TET1), show significant association with both adult height and birth length, indicating a role in early growth regulation. Among the parent-of-origin signals, we observed opposing parental effects raising questions about underlying mechanisms. These findings demonstrate that common variations affect human growth by parental imprinting.


Conflict of interest statement

The following authors affiliated with deCODE genetics/Amgen are employed by the company: S.B., A.O., A.H., R.P.K., G.S., A.O., G.T., O.B.D., G.A.A, G.S., B.O.J., H.H., K.F.A., G.B.W., S.A.G., P.D.I. L.D.W., J.K.S., M.L.F., T.R., A.K., G.M., H. Helgason, U.T., D.F.G., P.S. and K.S.

Figures

Figure 1
Figure 1. Schematic diagram showing the position (hg38) of variants corresponding to height association signals (Signal-A and Signal-B).
The diagram depicts IGF2-H19 imprinted domain in relation to the imprinting control region of the domain (H19-ICR), imprinted differentially methylated regions (IGF-DMR and IGF-DMR2) and predicted CTCF binding sites. Signal-A corresponds to rs147239461, rs113666865, rs79515490, chr11:1940471, rs76592672, rs75711836, rs145861779, rs141703487, rs75676658 and Signal-B to the variant rs7482510 (Supplementary Data 6 for detail).
Figure 2
Figure 2. Locus-plots corresponding to four parent-of-origin signals associated with adult height.
(a) IGF2-H19(A), (b) IGF2-H19(B), (c) KCNQ1 and (d) RTL1. The plots depict association results (P-values) with adult height, based on a dataset of 88,835 Icelanders with height information. For each plot, the y-axis shows the −log10 P-values and x-axis the genomic position (hg38). The leading variants of independent signals are labelled as diamonds and coloured purple. Other variants are coloured according to correlation (r2) with the leading marker. A chi-squared test was used to calculate P-values.
Figure 3
Figure 3. Ordered genotype height effects of the four variants identified in the present study under a parent-of-origin model.
The x-axis in each plot shows the four possible ordered genotypes with the first allele being inherited from the father and the second from the mother. The y-axis shows adult height (s.d.) in plots (a,ce) and birth length (s.d.) in plot (b). Means were computed from the groups of imputed and family imputed Icelanders for which we have adult height and/or birth length measurements. Ordered genotypes were assigned to individuals based on allele probabilities (see Methods). Each grey dot represents the mean for individuals with the ordered genotype in question and the error-bars represent 95% confidence interval of the mean, taking the correction factor into account (Methods). The number of individuals behind the computations of each mean is shown on x-axis below each ordered genotype. Axes are not the same scale.

References

    1. Silventoinen K. et al. Heritability of adult body height: a comparative study of twin cohorts in eight countries. Twin Res. 6, 399–408 (2003). - PubMed
    1. Carmichael C. M. & McGue M. A cross-sectional examination of height, weight, and body mass index in adult twins. J. Gerontol. A. Biol. Sci. Med. Sci. 50, B237–B244 (1995). - PubMed
    1. Visscher P. M. et al. Assumption-free estimation of heritability from genome-wide identity-by-descent sharing between full siblings. PLoS Genet. 2, 316–325 (2006). - PMC - PubMed
    1. Perola M. et al. Combined genome scans for body stature in 6,602 European twins: evidence for common caucasian loci. PLoS Genet. 3, 1019–1028 (2007). - PMC - PubMed
    1. Wood A. R. et al. Defining the role of common variation in the genomic and biological architecture of adult human height. Nat. Genet. 46, 1173–1186 (2014). - PMC - PubMed

LinkOut - more resources