. 2016 Nov 16:6:37029.
doi: 10.1038/srep37029.

Modulation of NMDA channel gating by Ca2+ and Cd2+ binding to the external pore mouth

Affiliations

Modulation of NMDA channel gating by Ca2+ and Cd2+ binding to the external pore mouth

Ya-Chi Tu et al. Sci Rep. .

Abstract

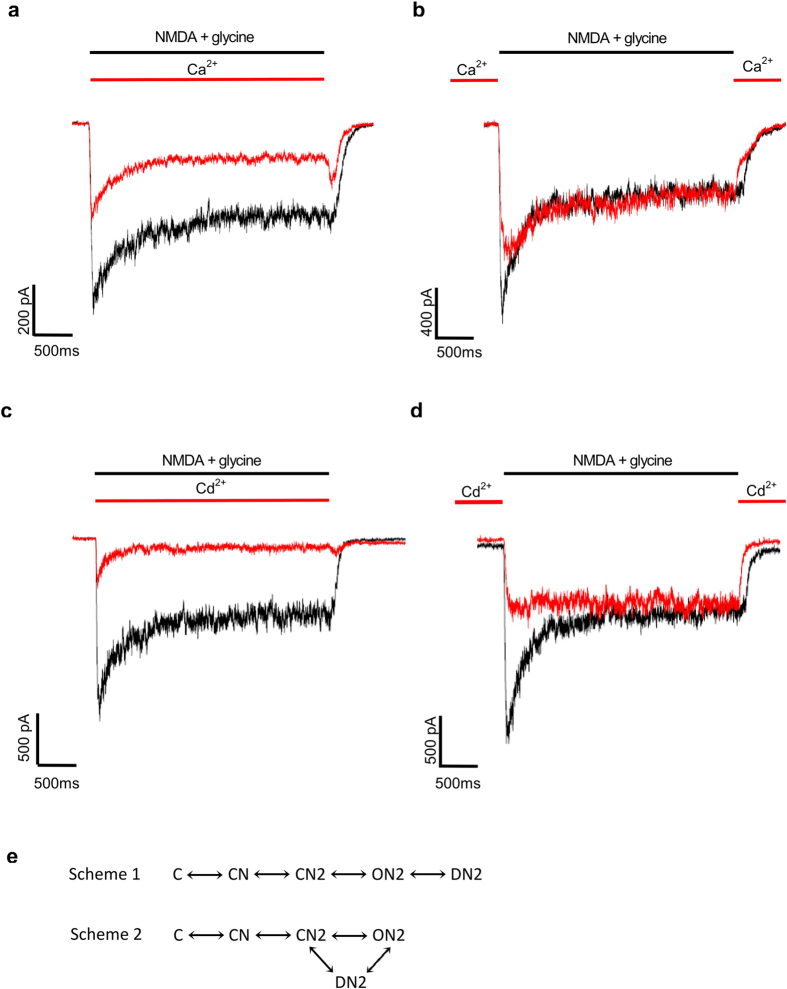
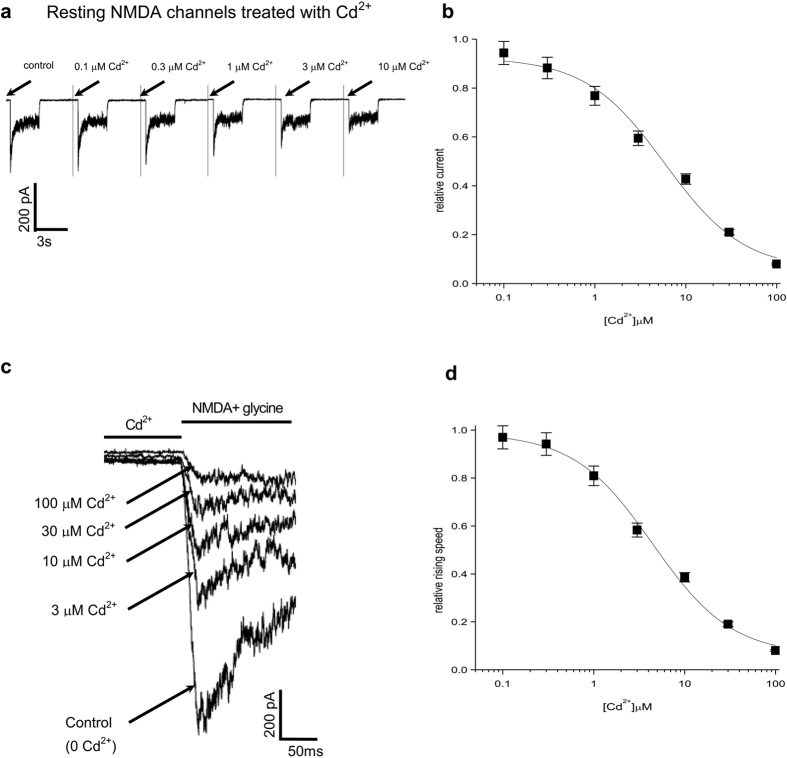
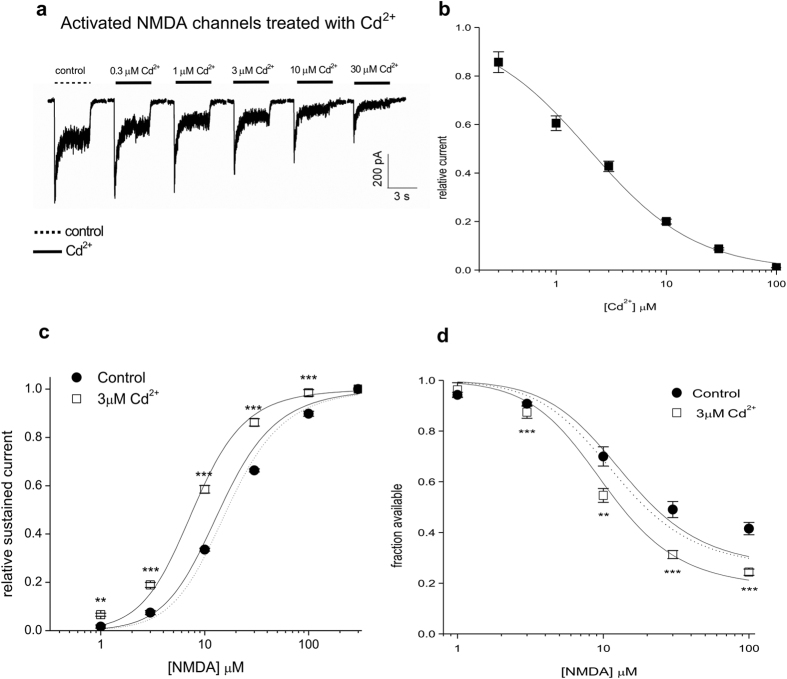
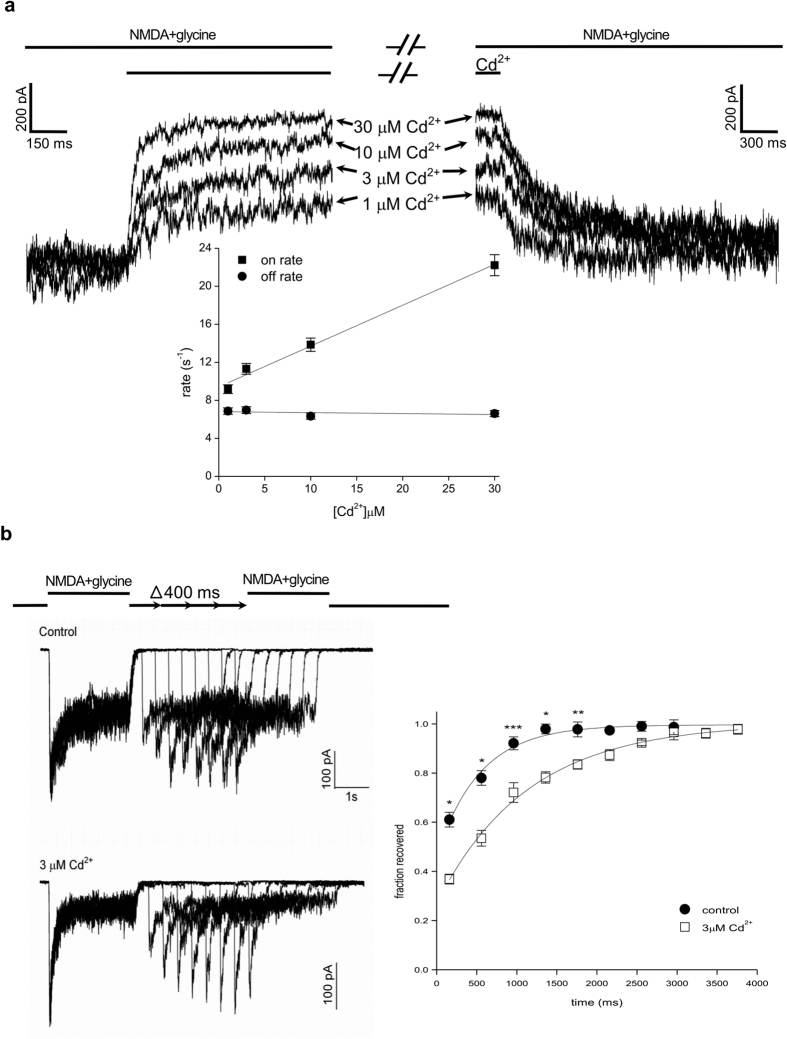
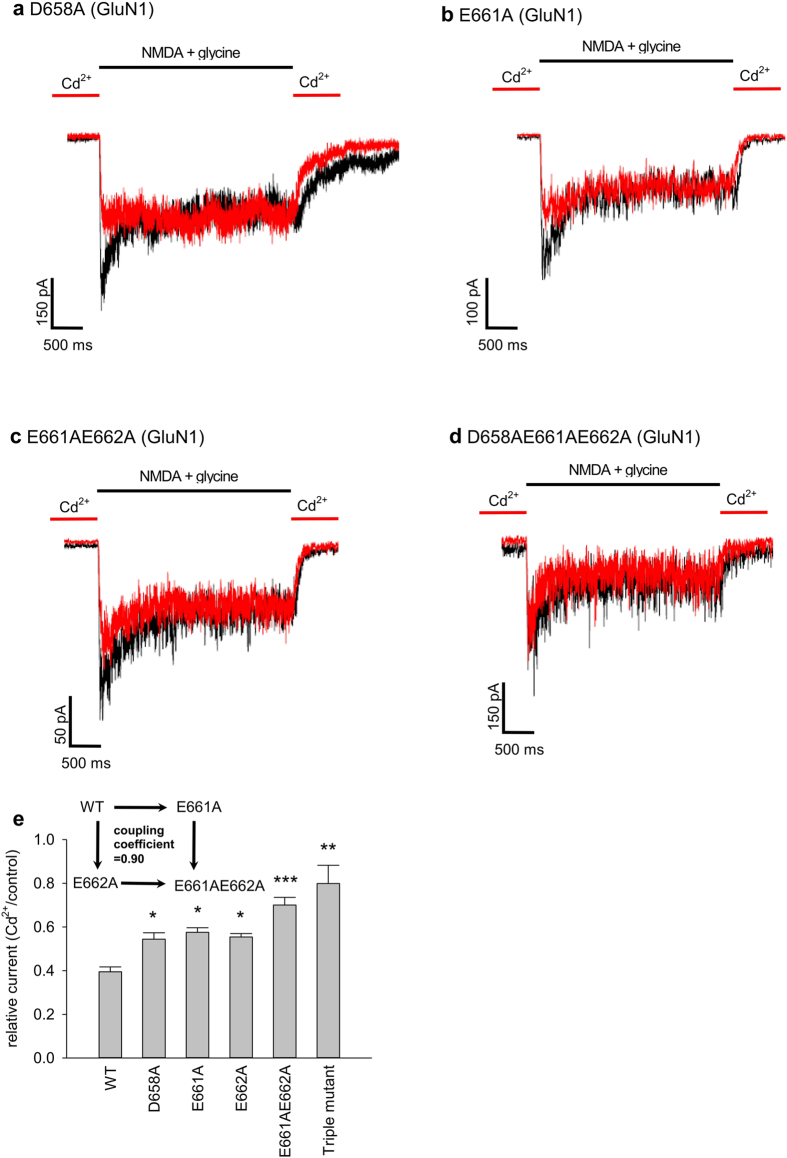
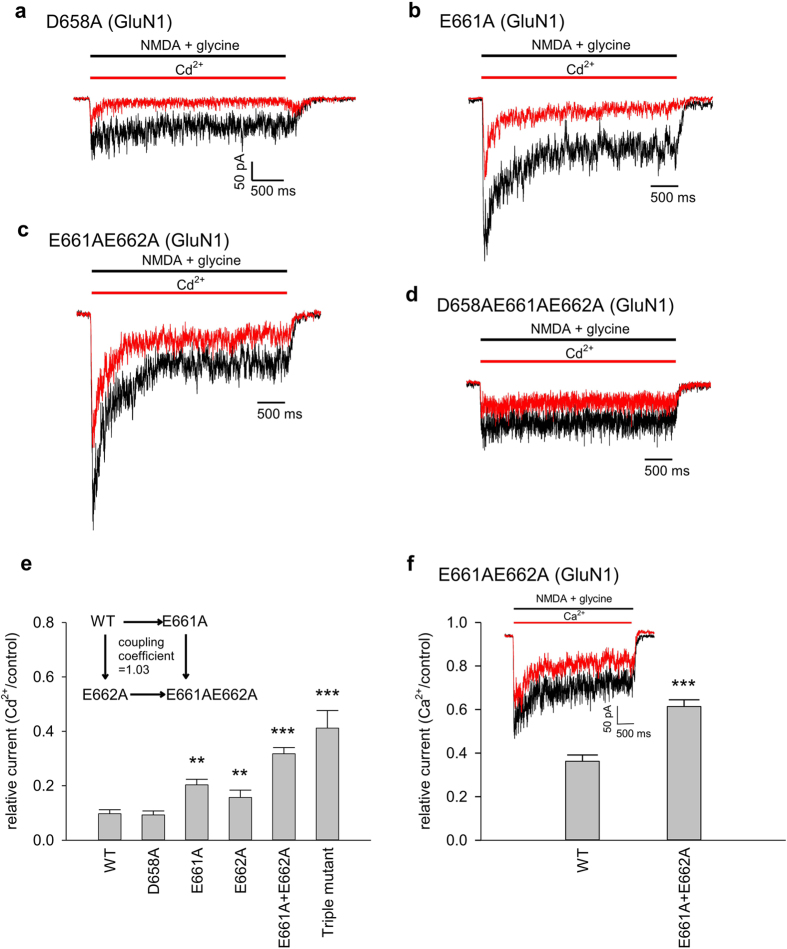
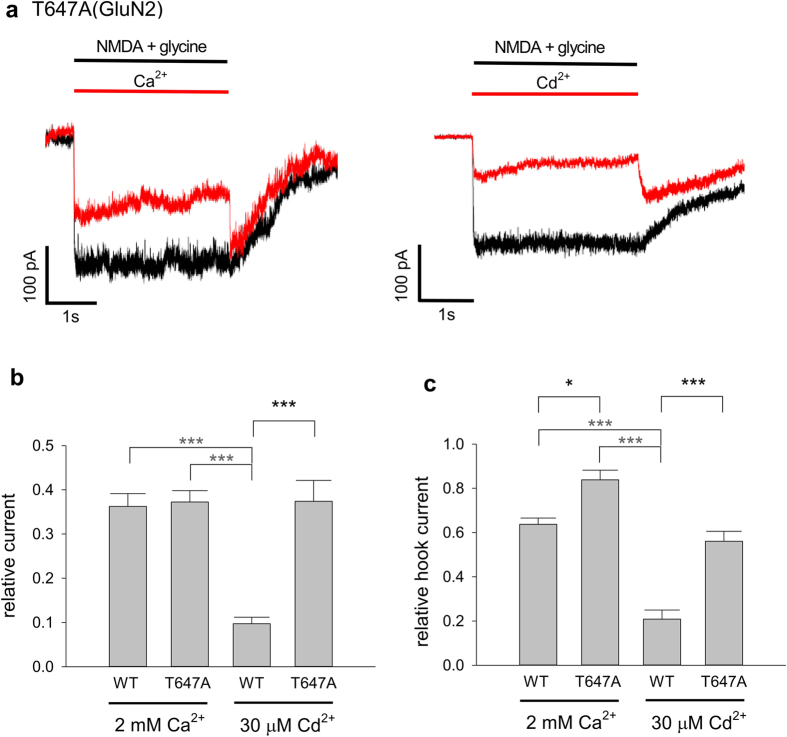
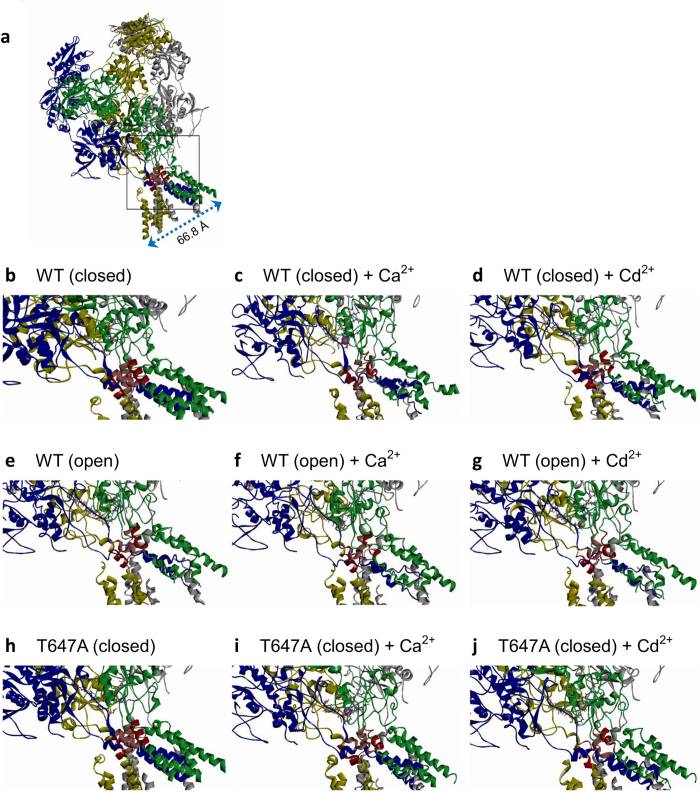
NMDA receptor channels are characterized by high Ca2+ permeability. It remains unclear whether extracellular Ca2+ could directly modulate channel gating and control Ca2+ influxes. We demonstrate a pore-blocking site external to the activation gate for extracellular Ca2+ and Cd2+, which has the same charge and radius as Ca2+ but is impermeable to the channel. The apparent affinity of Cd2+ or Ca2+ is higher toward the activated (a steady-state mixture of the open and desensitized, probably chiefly the latter) than the closed states. The blocking effect of Cd2+ is well correlated with the number of charges in the DRPEER motif at the external pore mouth, with coupling coefficients close to 1 in double mutant cycle analyses. The effect of Ca2+ and especially Cd2+ could be allosterically affected by T647A mutation located just inside the activation gate. A prominent "hook" also develops after wash-off of Cd2+ or Ca2+, suggesting faster unbinding rates of Cd2+ and Ca2+ with the mutation. We conclude that extracellular Ca2+ or Cd2+ directly binds to the DRPEER motif to modify NMDA channel activation (opening as well as desensitization), which seems to involve essential regional conformational changes centered at the bundle crossing point A652 (GluN1)/A651(GluN2).


Figures

Figure 1
Figure 1. Inhibition of the NMDA receptor currents by extracellular Cd2+ and Ca2+ presented to different gating states of the channel.
(a) and (c) NMDA receptor currents are elicited by a 3-s pulse of 300 μΜ NMDA plus 30 μΜ glycine (the “NMDA pulse”) every 15 s in the absence (black) or presence (red) of 2 mM extracellular Ca2+ (a) or 30 μΜ extracellular Cd2+ (c) during the pulse. (b) and (d) NMDA receptor currents are elicited by essentially the same protocols in parts a and c, but 2 mM extracellular Ca2+ (b) or 30 μΜ extracellular Cd2+ (d) is present between rather than during the NMDA pulses. (e) NMDA receptor gating schemes for data analysis (see Methods). N denotes NMDA (assuming the presence of saturating concentrations of glycine). C, CN, and CN2 denote the closed state of the channel, bound with zero, one, and two NMDA molecules, respectively, and ON2 and DN2 are the open and desensitized state of the channel with two bound NMDA molecules, respectively.
Figure 2
Figure 2. Dose-dependent inhibition of the NMDA receptor currents by Cd2+ binding to the closed state of the channel.
(a) NMDA currents are elicited by essentially the same protocols as in Fig. 1d but with different concentrations of Cd2+ applied in the interpulse phase. Cd2+ dose-dependently inhibits elicited peak currents, but the late phase of the currents is always essentially unaffected. (b) The amplitude of the peak current in Cd2+ is normalized to that in control to obtain the relative current, which is plotted against Cd2+ concentration (n = 7). The data points are fitted with a Hill equation (equation (5) in Methods) with Kd and n of ~6 μM and 1, respectively. (c) The existence of Cd2+ in the interpulse phase also decreases the initial activation speed of the macroscopic current in a Cd2+ concentration-dependent manner. (d) The apparent initial speed of activation in different concentration of Cd2+ in part c is normalized to that in control to give the relative activation speed, which is plotted against Cd2+ concentration (n = 4). The data points are fitted with a Hill equation (equation (5) in Methods) with Kd and n of ~4.5 μM and 1, respectively.
Figure 3
Figure 3. Cd2+ binding to the activated NMDA receptor channel with a higher affinity than to the closed channel.
(a) NMDA currents are elicited by essentially the same protocols as in Fig. 1c but with different concentrations of Cd2+ applied during the NMDA pulse. Cd2+ shows a dose-dependent inhibition of the peak as well as the sustained NMDA currents during the NMDA pulse. (b) The amplitude of the sustained current in Cd2+ is normalized to that in control to obtain the relative current, and is plotted against Cd2+ concentration (n = 7). The data points are fitted with a Hill equation (equation (5) in Methods) with Kd and n of ~1.6 μM and 1, respectively. The groups of Kd values obtained from fits of each individual data sets in Fig. 2b (7.6 ± 1.2 μΜ), 2d (3.4 ± 0.66 μΜ) and 3b (1.4 ± 0.16 μΜ) are also compared with one-way ANOVA followed by the Bonferroni-Holm test. There is significant difference between Figs 2b and 3b (P = 0.0042), and between Figs 2d and 3b (p = 0.028), but not between Fig. 2b and d (p = 0.065). (c) The activation curve is shifted by 3 μM Cd2+ (n = 4). P = 0.0087, 1.0 * 10−5, 7.8 * 10−10, 4.6 * 10−10, and 9.9 * 10−7 compared with control for NMDA concentrations of 1 to 100 μM, respectively. The curves are fits to the data points in control with equation (1) with a fixed apparent dissociation constant of NMDA (KN) of 47 μM (the dotted curve) or 40 μM (the solid curve, see Methods for more details), or to the data points in 3 μM Cd2+ with equation (2) with a KCd2+,o value of 2.5 μM and a r value of 8. (d) The desensitization curve is shifted by 3 μM Cd2+ (n = 4). P = 0.19, 0.00059, 0.0018, 1.7 * 10−5, and 0.00035 compared with control for NMDA concentrations of 1 to 100 μM, respectively. The lines are fits to the data points in control with equation (3) with a fixed Kn value of 35 μM (the dotted curve) or 40 μM (the solid curve, see Methods for more details), or to the data points in 3 μM Cd2+ with equation (4) with the same KCd2+,o and r values given in part c.
Figure 4
Figure 4. Cd2+ binding to the activated NMDA receptor channel via a simple bimolecular process.
(a) The kinetics of development of and recovery from inhibition of the NMDA currents were studied by fast application and removal of Cd2+, respectively, with theta glass tubes. (Inset) Both the decay phase of the current after application of Cd2+ and the increment phase of the current after wash-off of Cd2+ could be fitted with a monoexponential function to give the binding and unbinding rates (the inverses of the time constants), respectively. The binding and unbinding rates of Cd2+ are plotted against Cd2+ concentration and fitted with linear regression functions (n = 4). For the binding rates, the slope and intercept are 4.3 × 105 M−1s−1 and 9.4 s−1, respectively. For the unbinding rates, the intercept is 6.8 s−1, and the slope is essentially zero (~0.01 M−1s−1). (b) Delayed recovery from desensitization by Cd2+. Note the gradually increased NMDA receptor currents in the second NMDA pulse with the lengthening of the recovery period (See Methods for protocols). 3 μM Cd2+ is either absent (control, upper panel) or present (lower panel) in the external solution. The difference between the peak current in the second NMDA pulse and the late current in the first NMDA pulse is normalized to the difference between the peak current and the late current in the first NMDA pulse to give the fraction recovered, which is plotted against the duration of the recovery period (right panel, n = 3). The curves are monoexponential fits to the data points with time constants of ~540 and ~1140 ms in control and 3 μM Cd2+, respectively. P = 0.027, 0.018, 0.00021, 0.0250, 0.0058, 0.11, 0.16, 0.28, 0.83 and 0.8, respectively, for comparison between the data points of control and 3 μM Cd2+ with gradually lengthened recovery time.
Figure 5
Figure 5. Reduced inhibitory effect for extracellular Cd2+ binding to the closed NMDA channel with neutralizing mutations in the DRPEER motif.
(a) to (d) NMDA currents are elicited by the same protocols as that in Fig. 1d. The effect of 30 μM Cd2+ is less pronounced in the D658A and in the E661A mutant channels, and even so in the E661AE662A double and D658AE661AE662A triple mutant channels. (e) The relative current is defined by the ratio between the peak currents in 30 μM Cd2+ and in control (n = 3–13). Note the tendency of reduced Cd2+ effect with decreased number of negative charges in the motif. P = 0.034, 0.0013, 0.015, 0.00086, and 0.0093 for D658A, E661A, E662A, E661AE662A double, and D658AE661AE662A triple mutant channels compared with the wild-type (WT) channel, respectively. (Inset) The apparent dissociation constants between Cd2+ and the closed wild-type (WT), E661A, E662A, and E661AE662A mutant channels are simplistically derived with the Hill equation (assuming a Hill coefficient of 1, see Fig. 2) and the relative peak currents in 30 μM Cd2+, and are 19.6, 40.7, 37.3, and 70.2 μM, respectively. The double mutant cycle analysis shows a coupling coefficient ((KdWT × KdE661AE662A)/(KdE661A × KdE662A)) of 0.90 for the two point mutations E661A and E662A in terms of Cd2+ binding to the closed NMDA channel.
Figure 6
Figure 6. Reduced inhibitory effect for extracellular Cd2+ binding to the activated NMDA channel with neutralizing mutations in the DRPEER motif.
(a) to (d) NMDA receptor currents are elicited by the same protocols as those in Fig. 1c. The effect of 30 μM Cd2+ is less pronounced in the D658A and in the E661A mutant channels, and even so in the E661AE662A double and D658AE661AE662A triple mutant channels. (e) The relative current is defined by the ratio between the sustained currents in 30 μM Cd2+ and in control (n = 3–7). Note the tendency of reduced Cd2+ effect with decreased number of negative charges in the motif. P = 0.84, 0.0019, 0.0037, 9.1 * 10−6, and 0.00031 for D658A, E661A, E662A, E661AE662A double, and D658AE661AE662A triple mutant channels compared with the wild-type (WT) channel, respectively. (Inset) The apparent dissociation constants between Cd2+ and the activated wild-type (WT), E661A, E662A, and E661AE662A mutant channels are simplistically derived with the Hill equation (assuming a Hill coefficient of 1, see Fig. 2) and the relative sustained currents in 30 μM Cd2+, and are 3.2, 7.7, 5.6, and 13.9 μM, respectively. Double mutant cycle analysis shows a coupling coefficient ((KdWT × KdE661AE662A)/(KdE661A × KdE662A)) of 1.03 for the two point mutations E661A and E662A in terms of Cd2+ binding to the activated NMDA channel. (f) In the E661AE662A double mutant channels, NMDA currents are elicited by the same protocols as those in Fig. 1a (see inset currents). The relative current is defined by the ratio between the sustained currents in 2 mM extracellular Ca2+ and in control. The effect of Ca2+ is significantly decreased by the E661AE662A double mutation (n = 6; WT: n = 9). ***P = 5.1*10−5.
Figure 7
Figure 7. Reduced inhibitory effect of extracellular Ca2+ and Cd2+ and augmentation of “hook” currents upon wash-off of both the agonists (NMDA and glycine) and the blocking ions in the T647A mutant channel.
(a) NMDA currents are elicited by the same protocols as those in Fig. 1a and c. The inhibitory effect of Ca2+ (left) and Cd2+ (right) on the mutant channel currents is reduced (compared to Fig. 1). However, much more prominent “hook” currents immediately after wash-off of both the agonists (NMDA and glycine) and the blocking cations than that in Fig. 1 are noted. (b) The relative current is defined by the ratio between the sustained currents in the absence and the presence of the blocking cations. 2 mM Ca2+ shows similar effects on the wild-type (WT, n = 9, data from Fig. 6f) and T647A mutant channels (n = 3, P = 0.88). 30 μM Cd2+ has a significantly smaller effect on the T647A mutant channel (n = 8) compared to that on the WT channel (n = 6, data from Fig. 6e, P = 0.00037). (c) The relative hook current is defined by the ratio between the current peak after wash-off of both the agonists and the blocking cations and the sustained current right before the wash-off. N numbers are the same as those in part b. Both 2 mM Ca2+ (P = 0.028) and 30 μM Cd2+ (P = 0.00012) produce a significantly larger hook current in the T647A mutant channel than in the WT channel.
Figure 8
Figure 8. Molecular modeling of the NMDA channel, with emphasis on the region of the SYTANLAFF and DRPEER motifs.
The four different subunits of the NMDA channel are illustrated in four different colors, respectively (GluN1: grey and blue; GluN2: yellow and green), except that the SYTANLAFF motifs (the bundle crossing or the presumable activation “gate” regions) in GluN1 and GluN2 are colored in pink and red, respectively. The side chains of the DRPEER motifs (in GluN1 subunits) are shown in ball-and-stick sketches. The Ca2+ and Cd2+ ions are colored in purple and dark yellow, respectively. (a) The whole closed wild-type (WT) NMDA channel. The boxed area is enlarged for the following figures, which are also visualized with the same orientation. One may use the pitch of the α-helices (5.4 Å) as a scale, but should be aware that the figures are just two-dimensional presentations of three-dimensional structures. (bd) The closed WT NMDA channel in control (b), or with Ca2+ (c) or Cd2+ (d) binding to the DRPEER motifs. Note the shapely α-helical structures in the SYTANLAFF motifs and vicinity in the control condition, and the evident conformational changes (e.g. disruption of helices into loops) induced by Ca2+ or Cd2+ binding. (eg) The open/desensitized WT NMDA channel (i.e. the most stable conformation of the channel in the presence of 2 glutamates and 2 glycines, thus most likely a “mixed” conformation of both open and desensitized states) in control (e), or with Ca2+ (f) or Cd2+ (g) binding to the DRPEER motifs. Note the similarities in the conformational changes in the SYTANLAFF motifs and vicinity in part e to those in parts c and d. Also, Ca2+ or Cd2+ binding induces much less conformational changes in the open/desensitized than in the closed channels. (hj) The closed T647A mutant channel in control (h), or with Ca2+ (i) or Cd2+ (j) binding to the DRPEER motifs. Note the differences in the conformational changes induced by Ca2+ and Cd2+ binding (e.g. different patterns of disruption of the helices into loops) between the mutant and the WT channel.

References

    1. Wisden W. & Seeburg P. H. Mammalian ionotropic glutamate receptors. Curr Opin Neurobiol 3(3), 291–298 (1993). - PubMed
    1. Planells-Cases R., Sun W., Ferrer-Montiel A. V. & Montal M. Molecular cloning, functional expression, and pharmacological characterization of an N-methyl-D-aspartate receptor subunit from human brain. Proc Natl Acad Sci USA 90(11), 5057–5061 (1993). - PMC - PubMed
    1. Schoepfer. R. et al. Molecular biology of glutamate receptors. Prog Neurobiol 42(2), 353–357 (1994). - PubMed
    1. Zarei M. M. & Dani J. A. Ionic permeability characteristics of the N-methyl-D-aspartate receptor channel. J Gen Physiol 103(2), 231–248 (1994). - PMC - PubMed
    1. Gloor P. Epilepsy: relationships between electrophysiology and intracellular mechanisms involving second messengers and gene expression. Can J Neurol Sci. 16(1), 8–21 (1989). - PubMed

Publication types

LinkOut - more resources