. 2016 Nov 16:6:37007.
doi: 10.1038/srep37007.

Cell senescence is an antiviral defense mechanism

Affiliations

Cell senescence is an antiviral defense mechanism

Maite Baz-Martínez et al. Sci Rep. .

Abstract

Cellular senescence is often considered a protection mechanism triggered by conditions that impose cellular stress. Continuous proliferation, DNA damaging agents or activated oncogenes are well-known activators of cell senescence. Apart from a characteristic stable cell cycle arrest, this response also involves a proinflammatory phenotype known as senescence-associated secretory phenotype (SASP). This, together with the widely known interference with senescence pathways by some oncoviruses, had led to the hypothesis that senescence may also be part of the host cell response to fight virus. Here, we evaluate this hypothesis using vesicular stomatitis virus (VSV) as a model. Our results show that VSV replication is significantly impaired in both primary and tumor senescent cells in comparison with non-senescent cells, and independently of the stimulus used to trigger senescence. Importantly, we also demonstrate a protective effect of senescence against VSV in vivo. Finally, our results identify the SASP as the major contributor to the antiviral defense exerted by cell senescence in vitro, and points to a role activating and recruiting the immune system to clear out the infection. Thus, our study indicates that cell senescence has also a role as a natural antiviral defense mechanism.


Conflict of interest statement

The authors declare no competing financial interests.

Figures

Figure 1
Figure 1. Replicative senescent mouse fibroblasts are resistant to VSV infection.
(A) Growth curve of serially-passaged MEFs showing accumulated population doublings (PDLs) with time. (B) Microscopy images of serially-passaged MEFs showing morphology (left panels) and SA-beta-gal staining (right panels) of early passage (upper panels) and late passage senescent (bottom panels) MEFs. Quantification of the SA-beta-gal positive cells is shown below (at least 200 cells were counted per condition). (C) Viral titers (PFU/mL) determined in early or late passage senescent MEFs after the indicated periods of infection (hours post infection, hpi) at a multiplicity of infection (MOI) of 0.05 PFU/cell. (D) Western-blot analysis of VSV protein synthesis in early or late passage senescent MEFs after the indicated periods of infection at MOIs of 0.05 PFU/cell (upper panel) or 10 PFU/cell (lower panel). Actin is shown as loading control. (E) Percentage of apoptotic cells measured after mock or VSV infection at MOI of 10 PFU/cell, in early or late passage senescent MEFs. Data are mean values +/− SE from at least three different experiments. *p < 0.05, **p < 0.01, ***p < 0.001 Student’s t test.
Figure 2
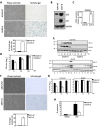
Figure 2. Chemotherapy-induced senescence of human tumor cells restricts VSV infection.
(A) Microscopy images of human tumor A549 cells showing morphology (left panels) and SA-beta-gal staining (right panels) of untreated (A549-NT, upper panels) and bleomycin-induced senescent (A549-B, bottom panels) A549 cells. Quantification of the SA-beta-gal positive cells is shown below (at least 200 cells were counted per condition). (B) Western-blot analysis of senescence markers p53 and p21 in untreated A549 cells (A549-NT) or after bleomycin treatment of A549 cells (A549-B). GAPDH is shown as loading control. (C) Expression levels of CDKN1A (coding for p21) mRNA relative to GAPDH (x10−3) as determined by qRT-PCR in untreated (A549-NT) or bleomycin-treated (A549-B) A549 cells. (D) Viral titers (PFU/mL) determined in untreated (A549-NT) or bleomycin-treated (A549-B) A549 cells after the indicated periods of infection at a MOI of 0.5 PFU/cell. (E) Western-blot analysis of VSV protein synthesis in untreated (A549-NT) or bleomycin-treated (A549-B) A549 cells after the indicated periods of infection at MOIs of 0.05 PFU/cell (upper panel) or 10 PFU/cell (lower panel). Actin is shown as loading control. (F) Microscopy images of MEFs showing morphology (left panels) and SA-beta-gal staining (right panels) of untreated (MEFs-NT, upper panels) and bleomycin-induced senescent (MEFs-B, bottom panels) MEFs. Quantification of the SA-beta-gal positive cells is shown below (at least 200 cells were counted per condition). (G) Viral titers (PFU/mL) determined in untreated (MEFs-NT) or bleomycin-treated (MEFs-B) MEFs after the indicated periods of infection at MOIs of 0.05 PFU/cell (left panel) or 10 PFU/cell (right panel). (G) Percentage of apoptotic cells measured after mock or VSV infection at MOI of 10 PFU/cell, in untreated (A549-NT) or bleomycin-treated (A549-B) A549 cells. Data are mean values +/− SE from at least three different experiments. *p < 0.05, **p < 0.01, ***p < 0.001 Student’s t test.
Figure 3
Figure 3. Reduced replication of VSV in oncogene-induced senescent MCF7 cells.
(A) Microscopy images of human tumor MCF7 cells showing morphology (left panels) and SA-beta-gal staining (right panels) of untreated (MCF7-NT, upper panels) and H-Ras-induced senescent MCF7 cells (MCF7-RAS, bottom panels). Quantification of the SA-beta-gal positive cells is shown below (at least 200 cells were counted per condition). (B) Western-blot analysis of H-Ras and downstream targets ERK/P-ERK, and of senescence markers p53 and p21 in untreated (MCF7-NT) or after H-Ras induction (MCF7-RAS) MCF7 cells. GAPDH is shown as loading control. (C) Expression levels of CDKN1A (coding for p21) mRNA relative to GAPDH (x10−3) as determined by qRT-PCR in untreated (MCF7-NT) or H-Ras-induced (MCF7-RAS) MCF7 cells. (D) Western-blot analysis of VSV protein synthesis in untreated (MCF7-NT) or H-Ras-induced (MCF7-RAS) MCF7 cells after the indicated periods of infection at MOIs of 0.05 PFU/cell (left panel) or 10 PFU/cell (right panel). Tubulin is shown as loading control. Data are mean values +/− SE from at least three different experiments. *p < 0.05, **p < 0.01, ***p < 0.001 Student’s t test.
Figure 4
Figure 4. Senescence reduces the cell infectivity of VSV.
(A) Fluorescent microscopy images of control untreated (A549-NT, left panels) or senescent bleomycin-treated (A549-BLEO, right panels) human tumor A549 cells showing virus spread at different times after infection with recombinant VSV expressing GFP (rVSV-GFP). (B) Percentage of rVSV-GFP positive cells after 6 or 24 hours post infection in control untreated (black bars) or senescent bleomycin-treated (white bars) human tumor A549 cells. (C) Percentage of rVSV-GFP positive cells after infection with MOIs of 0.05 or 0.5 PFU/cell in control early passage (black bars) or senescent late passage (white bars) MEFs. (D) Representative images of control (A549-NT, left panels) or bleomycin-induced senescent (A549-BLEO, right panels) A549 cells infected with VSV-GFP (MOI of 10 PFU/cell) taken at the indicated times. (E) Quantification of the intensity of GFP associated fluorescence per GFP positive cell (arbitrary units, a.u.). Data are mean values +/− SE from at least three different experiments. *p < 0.05, **p < 0.01, ***p < 0.001 Student’s t test.
Figure 5
Figure 5. The senescence-induced antiviral response is partially mediated by the SASP.
(A) Characterization of the expression of different SASP factors by qRT-PCR relative to GAPDH (x10−3) in control untreated (black bars) or senescent bleomycin-treated (white bars) A549 cells. (B) Cell viability of A549 cells cultured with conditioned medium (CM) from control untreated or senescent bleomycin-treated A549, after VSV infection at different MOIs. Viability of senescent bleomycin-treated A549 cells or A549 cells cultured in the presence of interferon are shown as controls. (C) Cell viability of MEFs cultures with CM from control early passage or senescent late passage MEFs, after VSV infection at MOIs of 0.01 or 10 PFU/cell relative to mock-infected cells. Data are mean values +/− SE from at least three different experiments. *p < 0.05, **p < 0.01, ***p < 0.001 Student’s t test.
Figure 6
Figure 6. Senescence induction in vivo restricts viral infection in mice.
(A) Lung sections from mice intratracheally treated with PBS (left panels) as control or bleomycin (right panels) to induce senescence, stained with masson trichrome (upper panels), SA-beta-gal (middle panels), of IHC against VSV-G (lower panels). (B) Viral titers (PFU/gr) determined from lungs of mice intratracheally treated with PBS (black bars) as control or bleomycin (white bars) to induce senescence, after 3 or 6 days of intranasal administration of VSV. (C) Characterization of immune cell populations in lungs from mice intratracheally treated with PBS (black bars) as control or bleomycin (white bars) to induce senescence, after 3 or 6 days of intranasal administration of VSV.

References

    1. Hayflick L. & Moorhead P. S. The serial cultivation of human diploid cell strains. Exp Cell Res 25, 585–621 (1961). - PubMed
    1. Collado M., Blasco M. A. & Serrano M. Cellular senescence in cancer and aging. Cell 130, 223–233 (2007). - PubMed
    1. Munoz-Espin D. et al. Programmed cell senescence during mammalian embryonic development. Cell 155, 1104–1118 (2013). - PubMed
    1. Storer M. et al. Senescence is a developmental mechanism that contributes to embryonic growth and patterning. Cell 155, 1119–1130 (2013). - PubMed
    1. Munoz-Espin D. & Serrano M. Cellular senescence: from physiology to pathology. Nat Rev Mol Cell Biol 15, 482–496 (2013). - PubMed

Publication types

Substances