

Vibrational resonance, allostery, and activation in rhodopsin-like G protein-coupled receptors
- PMID: 27849063
- PMCID: PMC5110974
- DOI: 10.1038/srep37290
Vibrational resonance, allostery, and activation in rhodopsin-like G protein-coupled receptors
Abstract
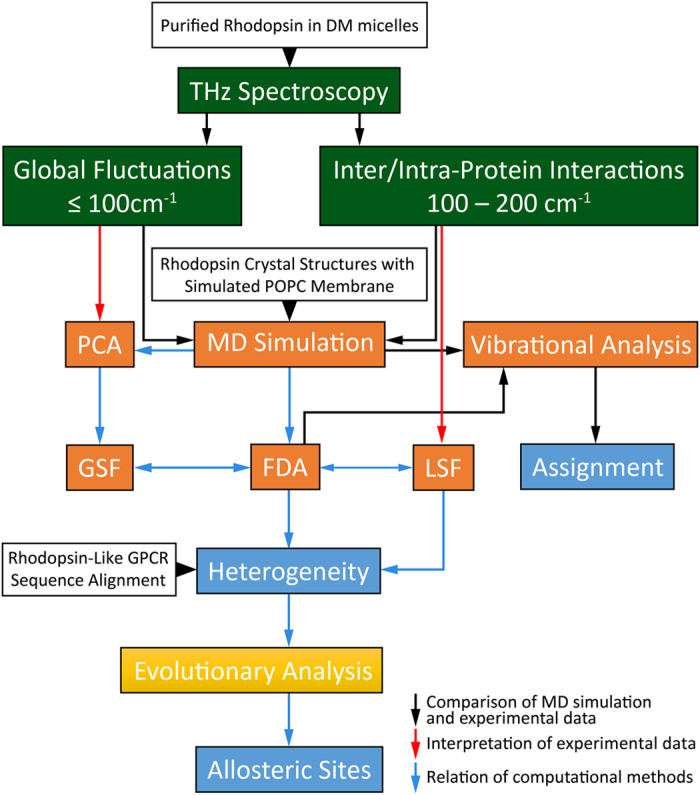
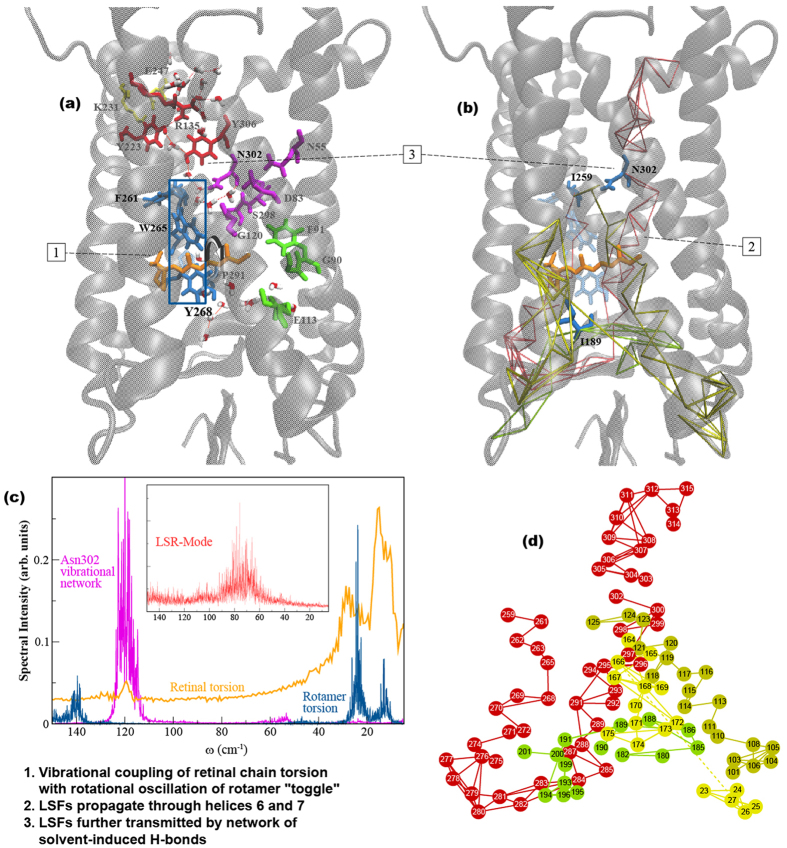
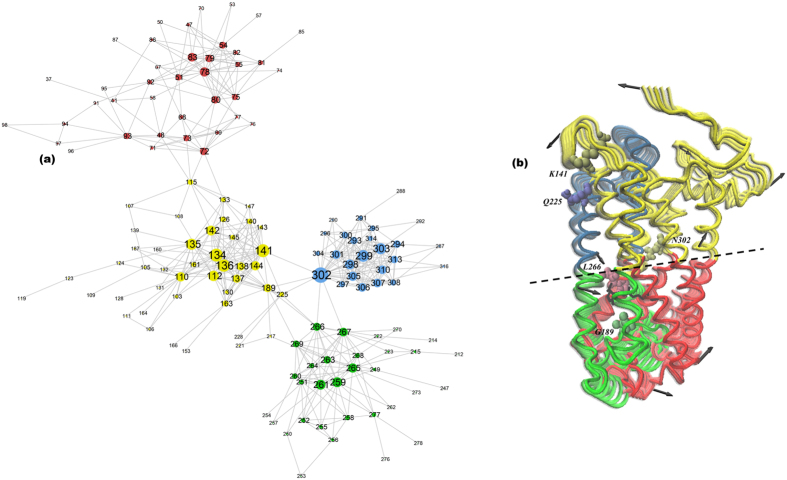
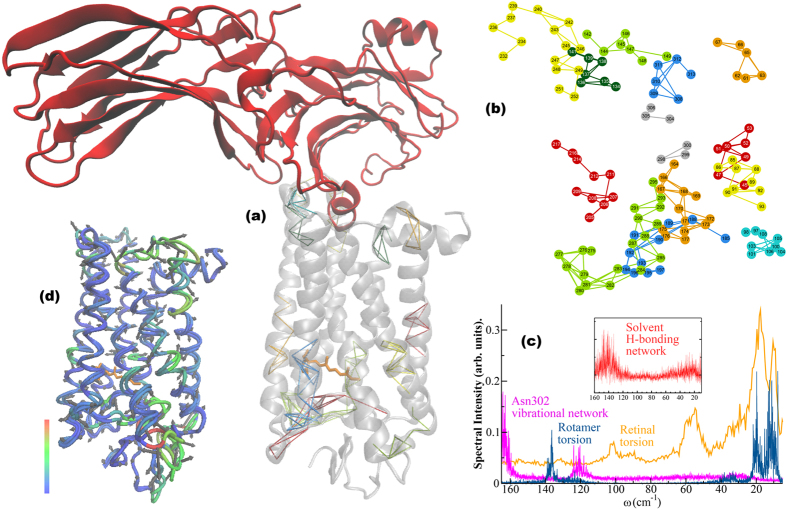
G protein-coupled receptors are a large family of membrane proteins activated by a variety of structurally diverse ligands making them highly adaptable signaling molecules. Despite recent advances in the structural biology of this protein family, the mechanism by which ligands induce allosteric changes in protein structure and dynamics for its signaling function remains a mystery. Here, we propose the use of terahertz spectroscopy combined with molecular dynamics simulation and protein evolutionary network modeling to address the mechanism of activation by directly probing the concerted fluctuations of retinal ligand and transmembrane helices in rhodopsin. This approach allows us to examine the role of conformational heterogeneity in the selection and stabilization of specific signaling pathways in the photo-activation of the receptor. We demonstrate that ligand-induced shifts in the conformational equilibrium prompt vibrational resonances in the protein structure that link the dynamics of conserved interactions with fluctuations of the active-state ligand. The connection of vibrational modes creates an allosteric association of coupled fluctuations that forms a coherent signaling pathway from the receptor ligand-binding pocket to the G-protein activation region. Our evolutionary analysis of rhodopsin-like GPCRs suggest that specific allosteric sites play a pivotal role in activating structural fluctuations that allosterically modulate functional signals.
Figures
Similar articles
-
Agonist-induced conformational changes in bovine rhodopsin: insight into activation of G-protein-coupled receptors.J Mol Biol. 2008 Oct 3;382(2):539-55. doi: 10.1016/j.jmb.2008.06.084. Epub 2008 Jul 7. J Mol Biol. 2008. PMID: 18638482
-
Revealing Conformational Transitions in G-Protein-Coupled Receptor Rhodopsin upon Phosphorylation.Biochemistry. 2020 Jan 28;59(3):297-302. doi: 10.1021/acs.biochem.9b00884. Epub 2019 Dec 26. Biochemistry. 2020. PMID: 31846310
-
Decay of an active GPCR: Conformational dynamics govern agonist rebinding and persistence of an active, yet empty, receptor state.Proc Natl Acad Sci U S A. 2016 Oct 18;113(42):11961-11966. doi: 10.1073/pnas.1606347113. Epub 2016 Oct 4. Proc Natl Acad Sci U S A. 2016. PMID: 27702898 Free PMC article.
-
Relevance of rhodopsin studies for GPCR activation.Biochim Biophys Acta. 2014 May;1837(5):674-82. doi: 10.1016/j.bbabio.2013.09.002. Epub 2013 Sep 13. Biochim Biophys Acta. 2014. PMID: 24041646 Review.
-
G protein coupled receptor structure and activation.Biochim Biophys Acta. 2007 Apr;1768(4):794-807. doi: 10.1016/j.bbamem.2006.10.021. Epub 2006 Nov 15. Biochim Biophys Acta. 2007. PMID: 17188232 Free PMC article. Review.
Cited by
-
Structural Insights and Influence of Terahertz Waves in Midinfrared Region on Kv1.2 Channel Selectivity Filter.ACS Omega. 2024 Feb 12;9(8):9702-9713. doi: 10.1021/acsomega.3c09801. eCollection 2024 Feb 27. ACS Omega. 2024. PMID: 38434859 Free PMC article.
-
Allosteric communication regulates ligand-specific GPCR activity.FEBS J. 2021 Apr;288(8):2502-2512. doi: 10.1111/febs.15826. Epub 2021 Apr 5. FEBS J. 2021. PMID: 33738925 Free PMC article. Review.
-
Structural Perspective on Revealing and Altering Molecular Functions of Genetic Variants Linked with Diseases.Int J Mol Sci. 2019 Jan 28;20(3):548. doi: 10.3390/ijms20030548. Int J Mol Sci. 2019. PMID: 30696058 Free PMC article. Review.
-
Chlorophyll-Derivative Modulation of Rhodopsin Signaling Properties through Evolutionarily Conserved Interaction Pathways.Front Mol Biosci. 2017 Dec 12;4:85. doi: 10.3389/fmolb.2017.00085. eCollection 2017. Front Mol Biosci. 2017. PMID: 29312953 Free PMC article.
-
Theoretical Description of Changes in Conformation and Symmetry of Supramolecular Systems During the Reception of a Molecular Signal.Int J Mol Sci. 2025 Jul 3;26(13):6411. doi: 10.3390/ijms26136411. Int J Mol Sci. 2025. PMID: 40650191 Free PMC article.
References
-
- Perez D. M. & Karnik S. S. Multiple Signaling States of G-Protein-Coupled Receptors. Pharmacol. Rev. 57, 147–161 (2005). - PubMed
-
- Marinissen M. J. & Gutkind J. S. G-protein-coupled receptors and signaling networks: emerging paradigms. Trends Pharmacol. Sci. 22, 368–376 (2001). - PubMed
-
- Benovic J. L. G-protein-coupled receptors signal victory. Cell 151, 1148–1150 (2012). - PubMed
-
- Ghosh E., Kumari P., Jaiman D. & Shukla A. K. Methodological advances: the unsung heroes of the GPCR structural revolution. Nat. Rev. Mol. Cell Biol. 16, 69–81 (2015). - PubMed
-
- Doré A. S. et al.. Structure of class C GPCR metabotropic glutamate receptor 5 transmembrane domain. Nature 511, 557–562 (2014). - PubMed
MeSH terms
Substances
LinkOut - more resources
Full Text Sources
Other Literature Sources
