. 2016 Dec 13;113(50):14306-14311.
doi: 10.1073/pnas.1607512113. Epub 2016 Nov 14.

RNA modification enzyme TruB is a tRNA chaperone

Affiliations

RNA modification enzyme TruB is a tRNA chaperone

Laura Carole Keffer-Wilkes et al. Proc Natl Acad Sci U S A. .

Abstract

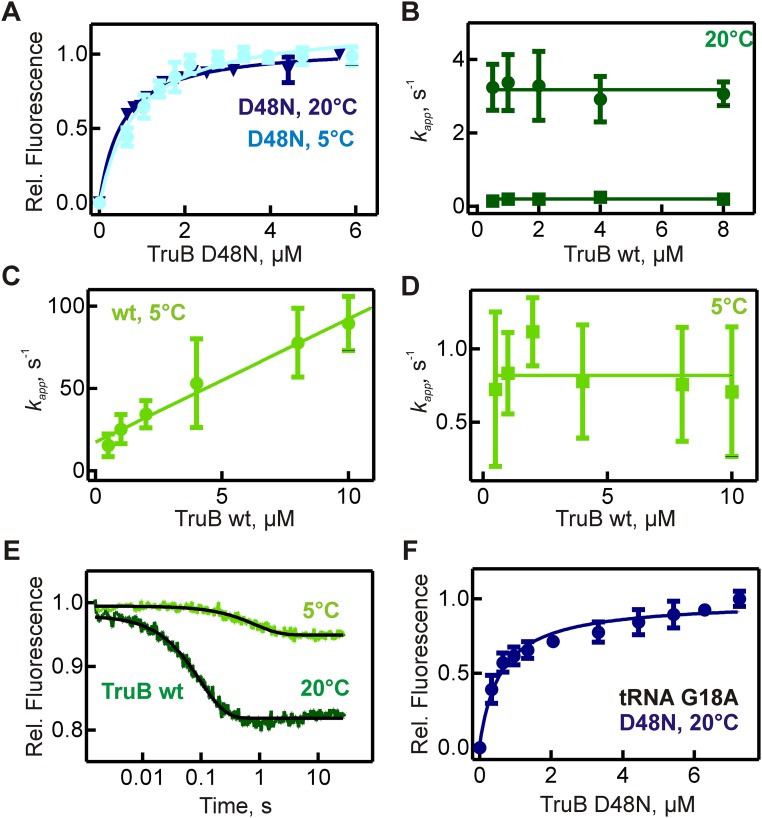
Cellular RNAs are chemically modified by many RNA modification enzymes; however, often the functions of modifications remain unclear, such as for pseudouridine formation in the tRNA TΨC arm by the bacterial tRNA pseudouridine synthase TruB. Here we test the hypothesis that RNA modification enzymes also act as RNA chaperones. Using TruB as a model, we demonstrate that TruB folds tRNA independent of its catalytic activity, thus increasing the fraction of tRNA that can be aminoacylated. By rapid kinetic stopped-flow analysis, we identified the molecular mechanism of TruB's RNA chaperone activity: TruB binds and unfolds both misfolded and folded tRNAs thereby providing misfolded tRNAs a second chance at folding. Previously, it has been shown that a catalytically inactive TruB variant has no phenotype when expressed in an Escherichia coli truB KO strain [Gutgsell N, et al. (2000) RNA 6(12):1870-1881]. However, here we uncover that E. coli strains expressing a TruB variant impaired in tRNA binding and in in vitro tRNA folding cannot compete with WT E. coli. Consequently, the tRNA chaperone activity of TruB is critical for bacterial fitness. In conclusion, we prove the tRNA chaperone activity of the pseudouridine synthase TruB, reveal its molecular mechanism, and demonstrate its importance for cellular fitness. We discuss the likelihood that other RNA modification enzymes are also RNA chaperones.

Keywords: RNA chaperone; RNA folding; RNA modification; pseudouridine; tRNA.


Conflict of interest statement

The authors declare no conflict of interest.

Figures

Fig. 1.
Fig. 1.
In vitro tRNA folding in the presence and absence of TruB. tRNA was unfolded and then allowed to refold in the absence of TruB (black squares) or in presence of 200 nM each of TruB WT (green circles), catalytically inactive TruB D48N (blue triangles), TruB ΔPUA lacking the C-terminal PUA domain (gray squares), or TruB K64E that is severely impaired in tRNA binding (orange diamonds). At different times of the folding reactions, the aminoacylation reaction was started to determine the amount of folded tRNA that can be aminoacylated rapidly (y axis intercept of the aminoacylation time courses shown in Fig. S1). Here the fraction of folded tRNA is plotted over time. Fitting with an exponential equation revealed a higher rate of folding in the presence of TruB WT (0.26 ± 0.05 min−1), TruB D48N (0.26 ± 0.05 min−1), and TruB ΔPUA (0.34 ± 0.08 min−1) in contrast to a rate of folding of 0.1 ± 0.07 min−1 in the absence of TruB, resulting in a significantly higher end level of folded tRNA under these conditions for TruB WT, TruB D48N, and TruB ΔPUA.
Fig. S1.
Fig. S1.
In vitro tRNA folding in the presence and absence of TruB. tRNA (680 nM) was unfolded and then allowed to refold at 0 °C before the start of the aminoacylation reaction. Aminoacylation time courses were fit with an exponential equation to determine the initial level of aminoacylated tRNA. This initial level reflects the proportion of correctly folded tRNA that is instantaneously aminoacylated in the presence of a large excess of Phe-tRNAPhe synthetase (Fig. 1). The remaining tRNA is only slowly aminoacylated because folding of these tRNAs is the rate-limiting step (23). (A) Fraction of folded tRNA in the absence (black squares) or presence of 200 nM TruB WT (green circles; same as in Fig. 1), as well as in the presence of two negative controls: 200 nM S. cerevisiae Nhp2 (red triangles), which binds tRNA nonspecifically, and 200 nM E. coli EF-Ts (purple triangles), which does not bind tRNA. (B) The folding of tRNA was repeated in the presence of only 50 nM protein similar to the cellular concentrations of TruB: no TruB (black squares), TruB WT (green circles), TruB D48N (blue inverted triangles), TruB ΔPUA (gray squares), and TruB K64E (orange diamonds). (C) Nitrocellulose filter binding to quantify binding of S. cerevisiae Nhp2 to [3H]-tRNA revealed a KD of 0.4 ± 0.1 μM. (D–F) Representative time courses of aminoacylation reactions following refolding for 0 (squares), 2 (circles), 5 (triangles), or 20 min (diamonds): (D) without TruB, (E) with TruB WT, or (F) with catalytically inactive TruB D48N.
Fig. 2.
Fig. 2.
Determining the kinetic mechanism of the TruB–tRNA interaction. (A) Time courses of TruB interacting with RNAPhe containing a 2AP at position 57 were monitored using a stopped-flow apparatus; 2AP-tRNA (0.3 µM final concentration) was rapidly mixed with TruB WT (30 μM final concentration). Time courses were fitted with a two-exponential function (wt, 5 °C) or a three-exponential function (wt, 20 °C). (B) Dissociation of substrate tRNA from TruB was monitored by rapidly mixing TruB D48N in complex with 2AP-tRNA with an excess of unlabeled tRNAPhe (for dissociation rates, see Table 1). (C) Rapid-kinetic stopped-flow analysis of 2AP-labeled tRNAPhe G18A binding to TruB WT at 20 °C. Final concentrations were 1.5 µM tRNA and 5 µM enzyme. Fitting of the time course with a three-exponential function (gray line) yielded the following apparent rates: kapp1 = 123 ± 3 s−1, kapp2 = 10.5 ± 0.3 s−1, and kapp3 = 0.22 ± 0.004 s−1.
Fig. S2.
Fig. S2.
Rapid kinetic analysis of 2AP-tRNA binding to and dissociation from TruB WT. (A) Equilibrium fluorescence titrations of 200 nM tRNAPhe containing a 2AP at position 57 with increasing concentrations of TruB D48N obtaining a KD of 0.5 ± 0.1 µM at 20 °C and 0.8 ± 0.1 µM at 5 °C. (B) Apparent rates for the second (kapp2, circles) and third (kapp3, squares) phases of the TruB–tRNA interaction at 20 °C (Fig. 3B). The apparent rates for the second phase (3.2 ± 0.1 s−1 at 20 °C) are concentration independent, consistent with a unimolecular conformational change in the tRNA. The fluorescence decrease observed at 20 °C (kapp3) reflects release of modified tRNA, which is rate limited by catalysis as described previously (18), and is concentration independent with an average apparent rate of 0.20 ± 0.01 s−1. (C) Apparent rates (kapp1) of tRNA binding to TruB at 5 °C were plotted against enzyme concentration. Fitting to a linear equation determined k1 and k1 (Table 1). The apparent rates for the first phase increase linearly with the TruB concentration as expected for a bimolecular binding event allowing us to determine the association (k1) and dissociation rate constants (k1) from the slope and y intercept, respectively (Table 1). (D) Apparent rates for second phase (kapp2) of the TruB–tRNA interaction at 5 °C were plotted against enzyme concentration. As reported for experiments performed at 20 °C, the apparent rates for the second phase (0.8 ± 0.1 s−1 at 5 °C) are also concentration independent and therefore reflect the unfolding of the tRNA elbow region. (E) Dissociation of product tRNA from TruB was monitored by rapidly mixing TruB WT in complex with 2AP-tRNA with an excess of unlabeled tRNAPhe at 5 °C (light green) and 20 °C (dark green). The dissociation rate was determined by fitting the time course with a single-exponential function (smooth black line). The dissociation rate constant of substrate tRNA (Fig. 2B and Table 1) is significantly lower than the dissociation rate constant k1 for the initial tRNA-TruB encounter at 5 °C and therefore corresponds to the reversal of the conformational change in the second step of binding (k2). Knowing k2 allows us to determine the forward rate constant k2 (Table 1 and Materials and Methods). (F) Equilibrium fluorescence titration of 2AP-labeled tRNAPhe G18A (final concentration of 200 nM) with increasing concentrations of TruB D48N at 20 °C. The relative fluorescence change at 365 nm was plotted against enzyme concentration to determine a dissociation constant of 0.6 ± 0.3 µM.
Fig. 3.
Fig. 3.
Bacterial fitness depends on tRNA binding by TruB. (A) Apparent rates of pseudouridine formation (kapp) by TruB variants from single-turnover experiments (Fig. S1 B and C) were plotted against TruB concentration to determine the KM. (B) Binding of tritium-labeled tRNA (10 nM) to TruB was determined through nitrocellulose filter binding. Hyperbolic fitting yielded the KD: 2.4 ± 0.3 μM for TruB WT and 9 ± 1 μM for TruB ΔPUA. (C) Coculture competition assays between WT E. coli and the E. coli truB KO strain (black), the truB KO strain expressing TruB WT protein, TruB K64E, or TruB ΔPUA. (D) In vivo tRNA pseudouridine 55 formation in tRNAPhe assessed by CMCT modification in E. coli WT and truB KO strains expressing TruB variants. Similar results were obtained with probing for pseudouridylation in tRNACys (Fig. S5).
Fig. S3.
Fig. S3.
Pseudouridylation assays with TruB variants. (A) The basic residues R40, K64, K130, and K176 were substituted with glutamate to impair tRNA binding to TruB. The catalytic residue D48 is also depicted, whereas the C-terminal PUA domain is shown in gray. The figure was generated with PyMOL using PDB ID code 1K8W (16). (B) Multiple-turnover pseudouridylation assays (600 nM tritium-labeled tRNAPhe, 20 nM TruB) with TruB WT (green circles), TruB R40E (red crosses), TruB K64E (orange diamonds), TruB K130E (purple triangles), and TruB K176E (turquoise reverse triangles). (C) Pseudouridine formation by TruB variants with substitutions in the tRNA binding interface was monitored by a tritium release assay at 37 °C under single-turnover conditions (1 µM tRNAPhe with 5 µM TruB). Time courses were recorded for TruB WT (green circles) and TruB variants as indicated in color in B. (D) Pseudouridine formation by TruB K64E under single-turnover conditions at several enzyme concentrations (from light to dark orange): 3 (diamonds), 5 (circles), 10 (squares), 15 (triangles), and 20 µM (reverse triangles). (E) Single turnover tritium release assay at increasing TruB ΔPUA concentrations (from light to dark gray): 3 (diamonds), 5 (circles), 10 (squares), and 15 µM (triangles). Time courses in B and C were fitted with a single-exponential function to determine the apparent rate of pseudouridine formation (kapp).
Fig. S4.
Fig. S4.
Expression of TruB WT and variants in WT and truB KO strains. (A) Agarose [2.5% (wt/vol)] gel electrophoresis of the RT-PCR products (360 bp) for mRNA of (untagged) TruB variants. DNA was visualized by ethidium bromide staining. As positive control, a PCR of pET28a-EcTruB plasmid was performed (far left). RT-PCR of the truB KO strain (second lane), as well as PCRs using RNA templates from truB KO cells expressing TruB variants (far right) served as negative controls. The middle part of the gel shows RT-PCRs for expression of TruB variants as indicated in truB KO cells and WT TruB from E. coli MG1655 strain. The same gel analysis was done in triplicate, which revealed an expression level of 93 ± 3% on the mRNA level for TruB K64E variant (lane 7), compared with that of the WT TruB from E. coli MG1655 strain (lane 8). (B) Western blot analysis of the C-terminally FLAG•tagged TruB variants. (Left) When probed with anti-FLAG antibody, expression levels for the WT and K64E variants were similar (2 μL lysate). (Right) To ensure that comparable amounts of lysate were used, we repeated the Western blot using 25 μL lysate using an antibody against E. coli protein YchF. Note that a much higher sample volume was required to visualize YchF and that the YchF antibody recognizes a second unknown E. coli protein (top band). Semiquantitative analysis of relative band intensities for FLAG-tagged TruB compared with YchF in both TruB WT samples and the TruB K64E samples indicates that protein expression levels are comparable.
Fig. S5.
Fig. S5.
Detection of pseudouridine 55 in tRNAPhe and tRNACys in vivo. Pseudouridine formation at position 55 in tRNAPhe (F) and tRNACys (C) was monitored by CMCT modification and primer extension using RNA extracted from E. coli. tRNA was either from WT E. coli (labeled TruB WT) or from truB KO strains expressing TruB variants from a plasmid as indicated on the top. The intensity of the band resulting from a primer extension stop corresponding to pseudouridine 55 was quantified (Table S2).
Fig. S6.
Fig. S6.
Interaction of TruB with tRNA labeled with fluorescein at its 3′ end. (A) Equilibrium fluorescence titration of fluorescein-labeled tRNAPhe with TruB D48N. The relative fluorescence at 515 nm was plotted against enzyme concentration and fitted with a hyperbolic function to obtain the KD of 0.1 ± 0.02 μM. (B) TruB WT (final concentration, 5 µM; green) or TruB ΔPUA (final concentration, 10 µM; gray) was rapidly mixed in a stopped-flow apparatus with fluorescein-labeled tRNA (final concentration, 0.3 µM). Fluorescein was excited at 480 nm, and emission was monitored using a LG-500 nm cutoff filter. The fluorescence change of TruB WT was fitted with a single exponential function. (C) Apparent rates of TruB WT interacting with fluorescein-tRNA are plotted against enzyme concentration.
Fig. S7.
Fig. S7.
Rapid kinetic analysis of TruB ΔPUA interacting with tRNA. (A) Time courses of 2AP-tRNA (0.3 µM final concentration) interacting with of TruB ΔPUA (10 µM final concentration) at 20 °C (dark gray) and 5 °C (light gray). The time courses were fitted with a three-exponential (20 °C, dotted black line) and a two-exponential function (5 °C, smooth black line), respectively. (B) The apparent rates for the first phase (kapp1, triangles) and the second phase (kapp2, squares) of tRNA binding to TruB ΔPUA at 5 °C were plotted against enzyme concentration. Linear fitting of (kapp1) yielded k1 and k1 (Table 1). (C) Apparent rates for the second (kapp2, diamonds) and third (kapp3, squares) phases of TruB ΔPUA interacting with tRNA at 20 °C. (D) Dissociation of 2AP-tRNA•TruB ΔPUA complex was observed on rapidly mixing with a large excess of unlabeled tRNAPhe. Time courses at both 20 °C (dark gray) and 5 °C (light gray) were fitted with a single exponential plus linear function to determine the dissociation rate.
Fig. S8.
Fig. S8.
Assessing binding of TruB to different RNAs. Catalytically inactive TruB D48N was incubated with [3H]-labeled RNAs and binding was analyzed by nitrocellulose filtration. The natural substrate E. coli tRNAPhe (filled circles) was used as a positive control. No binding was detected with a short single-stranded RNA (open squares) or a structured, ∼200-nt fragment of the 23S rRNA corresponding to the peptidyltransferase center (open triangles). In conclusion, although TruB is known to interact with all elongator tRNAs, it is not binding nonspecifically to other RNAs.
Fig. 4.
Fig. 4.
Mechanism of TruB acting as a tRNA chaperone while introducing pseudouridine 55. Rapid tRNA binding is followed by local tRNA unfolding in the elbow region that allows TruB to gain access to the modification site. By flipping out nucleotides 55–57 in the T arm when binding to TruB (PDB ID code 1K8W), the tertiary interactions between T and D arm in tRNA (PDB ID code 4TRA) are disrupted (Bottom), and the tRNA is opened such that TruB gains access to U55. Because the reversion of the tRNA rearrangement (k-2) is faster than catalysis (kΨ) (Table 1), TruB allows the tRNA to repeatedly open and refold before becoming pseudouridylated. This repeated folding-unfolding transition in the elbow region of tRNA constitutes the tRNA chaperone activity of the pseudouridine synthase TruB.
Fig. S9.
Fig. S9.
Circular dichroism spectra of TruB variants. Proteins were diluted to 1 µM with 50 mM sodium phosphate buffer: TruB WT (green solid line), TruB R40E (red solid line), TruB K64E (orange dotted line), TruB K130E (purple solid line), and TruB K176E (turquoise dotted line).

Comment in

References

    1. Rajkowitsch L, et al. RNA chaperones, RNA annealers and RNA helicases. RNA Biol. 2007;4(3):118–130. - PubMed
    1. Machnicka MA, et al. MODOMICS: A database of RNA modification pathways--2013 update. Nucleic Acids Res. 2013;41(Database issue):D262–D267. - PMC - PubMed
    1. Ishitani R, Yokoyama S, Nureki O. Structure, dynamics, and function of RNA modification enzymes. Curr Opin Struct Biol. 2008;18(3):330–339. - PubMed
    1. Charette M, Gray MW. Pseudouridine in RNA: What, where, how, and why. IUBMB Life. 2000;49(5):341–351. - PubMed
    1. Carlile TM, et al. Pseudouridine profiling reveals regulated mRNA pseudouridylation in yeast and human cells. Nature. 2014;515(7525):143–146. - PMC - PubMed

Publication types

MeSH terms

LinkOut - more resources