

Temperature response of soil respiration largely unaltered with experimental warming
- PMID: 27849609
- PMCID: PMC5137763
- DOI: 10.1073/pnas.1605365113
Temperature response of soil respiration largely unaltered with experimental warming
Abstract
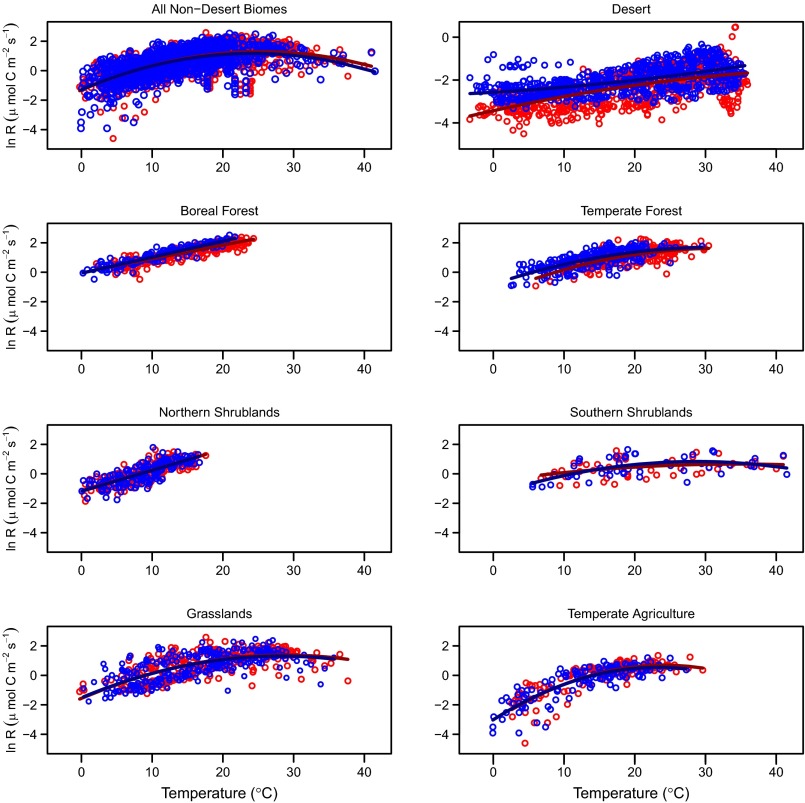
The respiratory release of carbon dioxide (CO2) from soil is a major yet poorly understood flux in the global carbon cycle. Climatic warming is hypothesized to increase rates of soil respiration, potentially fueling further increases in global temperatures. However, despite considerable scientific attention in recent decades, the overall response of soil respiration to anticipated climatic warming remains unclear. We synthesize the largest global dataset to date of soil respiration, moisture, and temperature measurements, totaling >3,800 observations representing 27 temperature manipulation studies, spanning nine biomes and over 2 decades of warming. Our analysis reveals no significant differences in the temperature sensitivity of soil respiration between control and warmed plots in all biomes, with the exception of deserts and boreal forests. Thus, our data provide limited evidence of acclimation of soil respiration to experimental warming in several major biome types, contrary to the results from multiple single-site studies. Moreover, across all nondesert biomes, respiration rates with and without experimental warming follow a Gaussian response, increasing with soil temperature up to a threshold of ∼25 °C, above which respiration rates decrease with further increases in temperature. This consistent decrease in temperature sensitivity at higher temperatures demonstrates that rising global temperatures may result in regionally variable responses in soil respiration, with colder climates being considerably more responsive to increased ambient temperatures compared with warmer regions. Our analysis adds a unique cross-biome perspective on the temperature response of soil respiration, information critical to improving our mechanistic understanding of how soil carbon dynamics change with climatic warming.
Keywords: biome; climate change; experimental warming; soil respiration; temperature sensitivity.
Conflict of interest statement
The authors declare no conflict of interest.
Figures
References
-
- Schlesinger WH, Bernhardt E. Biogeochemistry, An Analysis of Global Change. 3rd Ed Elsevier; Waltham, MA: 2013.
-
- Hashimoto S, et al. Global spatiotemporal distribution of soil respiration modeled using a global database. Biogeosciences. 2015;12(13):4121–4132.
-
- Bond-Lamberty B, Thomson A. Temperature-associated increases in the global soil respiration record. Nature. 2010;464(7288):579–582. - PubMed
-
- Davidson EA, Janssens IA. Temperature sensitivity of soil carbon decomposition and feedbacks to climate change. Nature. 2006;440(7081):165–173. - PubMed
-
- Friedlingstein P, et al. Climate–carbon cycle feedback analysis: Results from the C 4 MIP model intercomparison. J Clim. 2006;19(14):3337–3353.
Publication types
Grants and funding
LinkOut - more resources
Full Text Sources
Other Literature Sources
