. 2016 Dec 1;540(7631):144-149.
doi: 10.1038/nature20565. Epub 2016 Nov 16.

In vivo genome editing via CRISPR/Cas9 mediated homology-independent targeted integration

Affiliations

In vivo genome editing via CRISPR/Cas9 mediated homology-independent targeted integration

Keiichiro Suzuki et al. Nature. .

Abstract

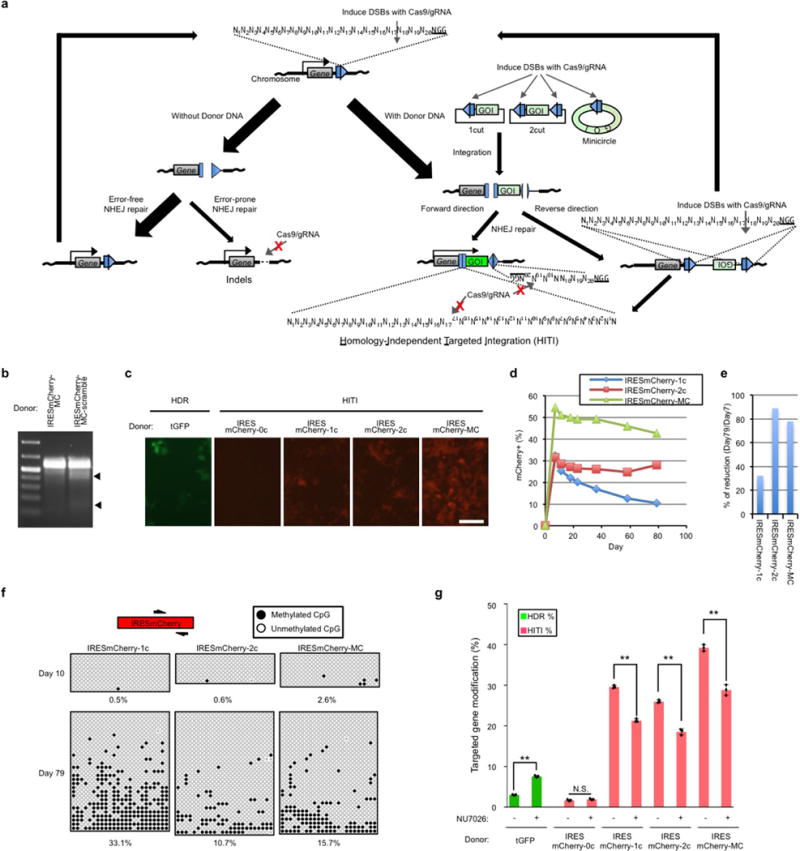
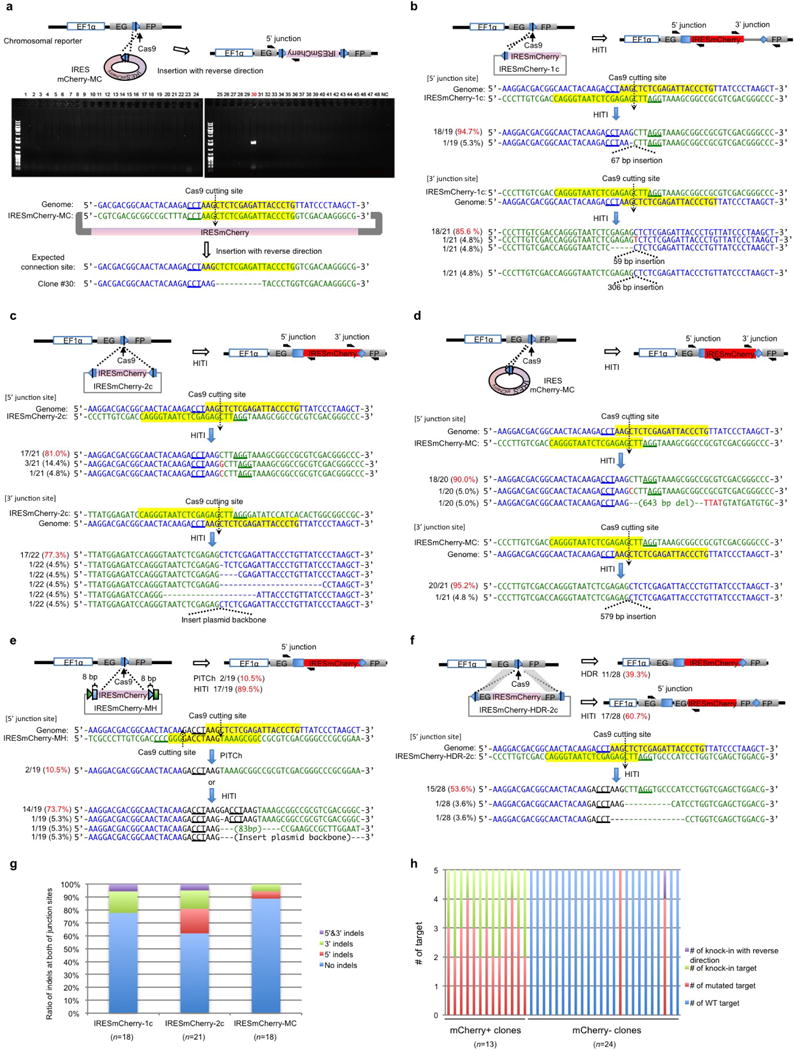
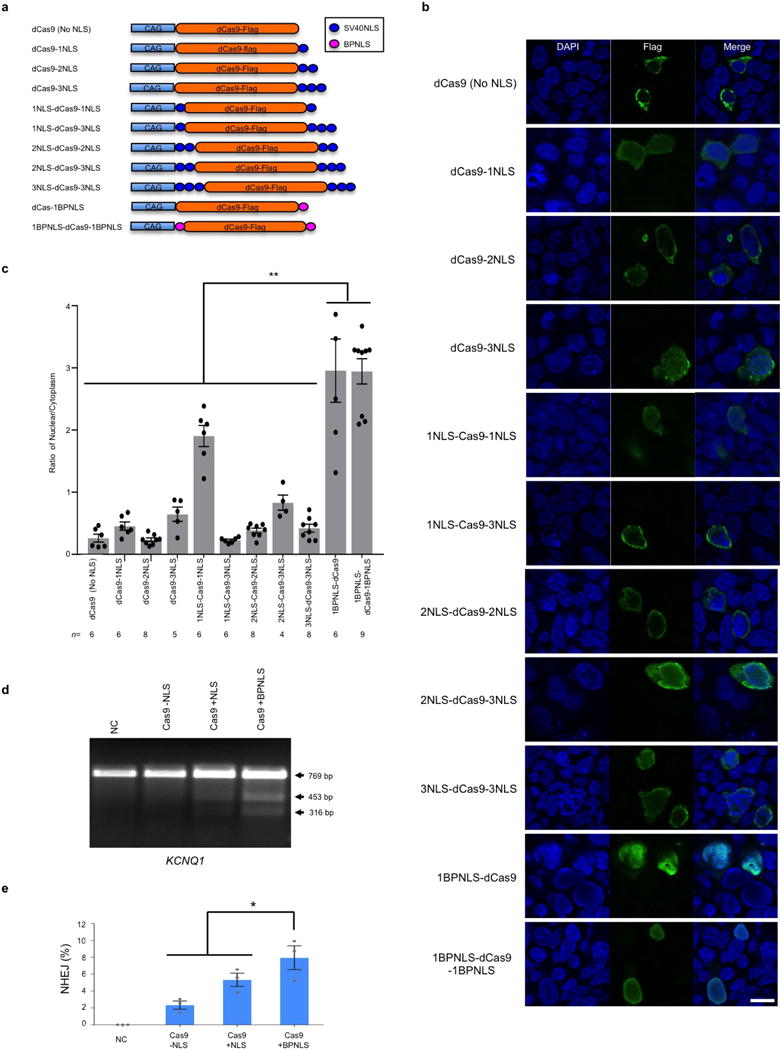
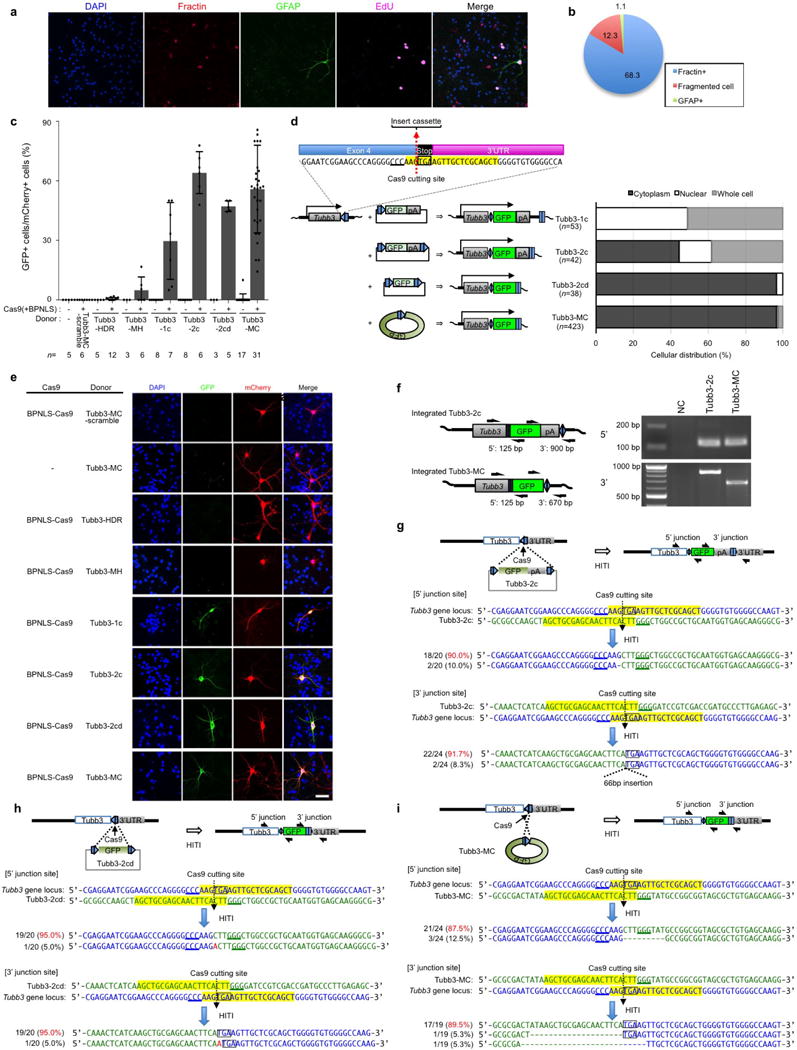
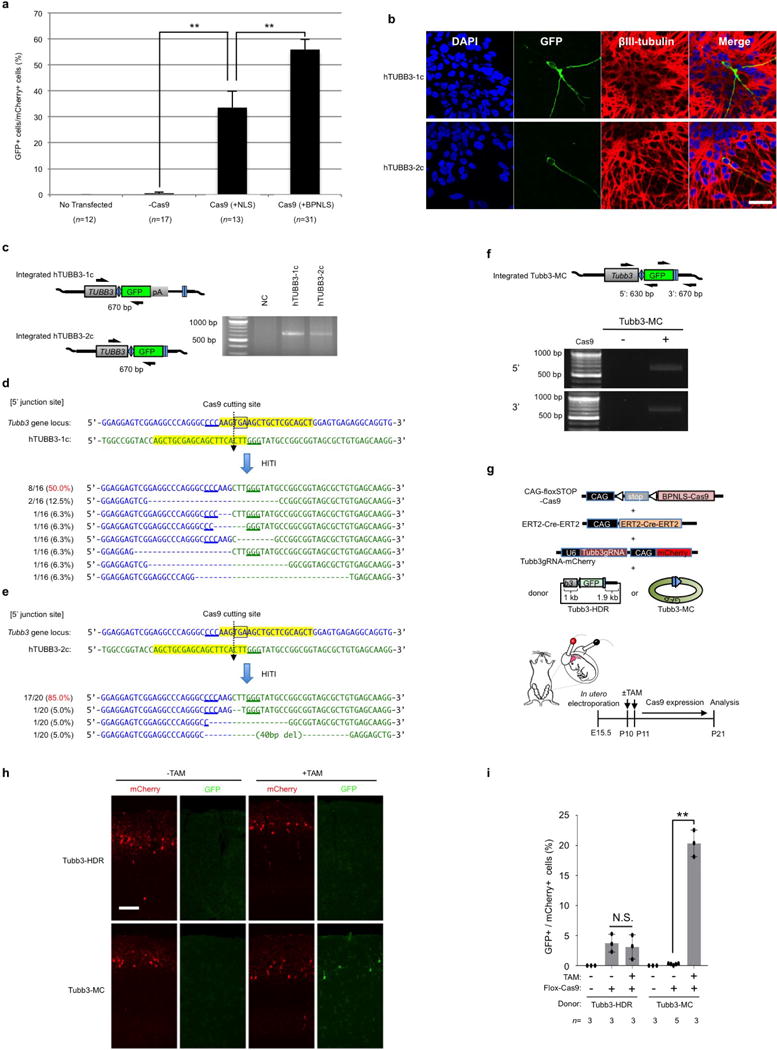
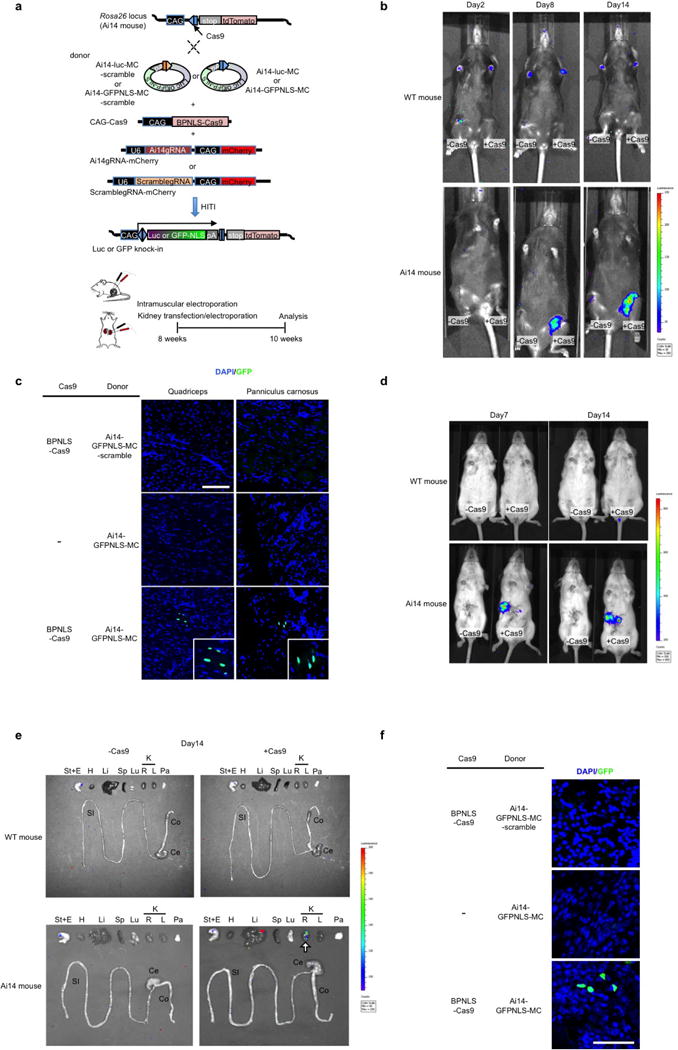
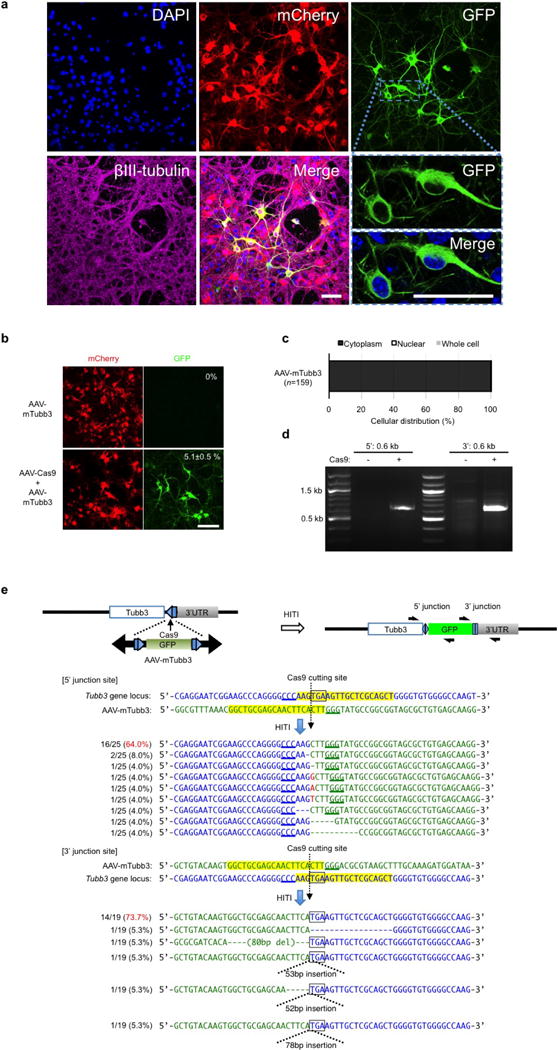
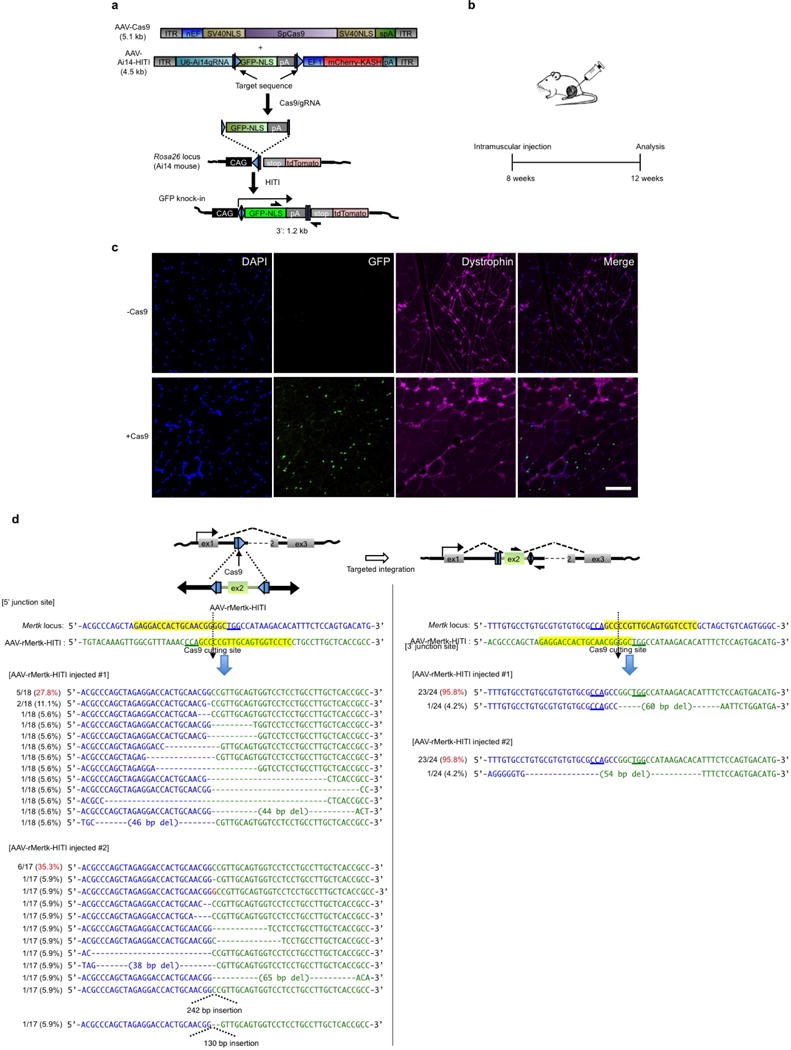
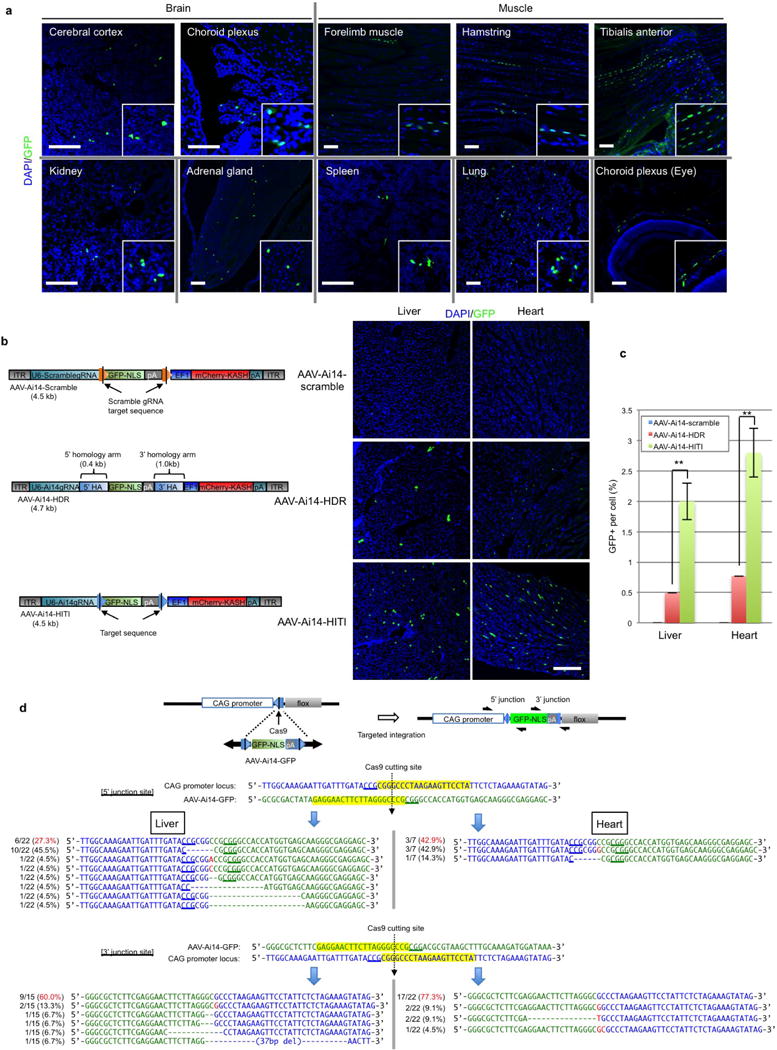
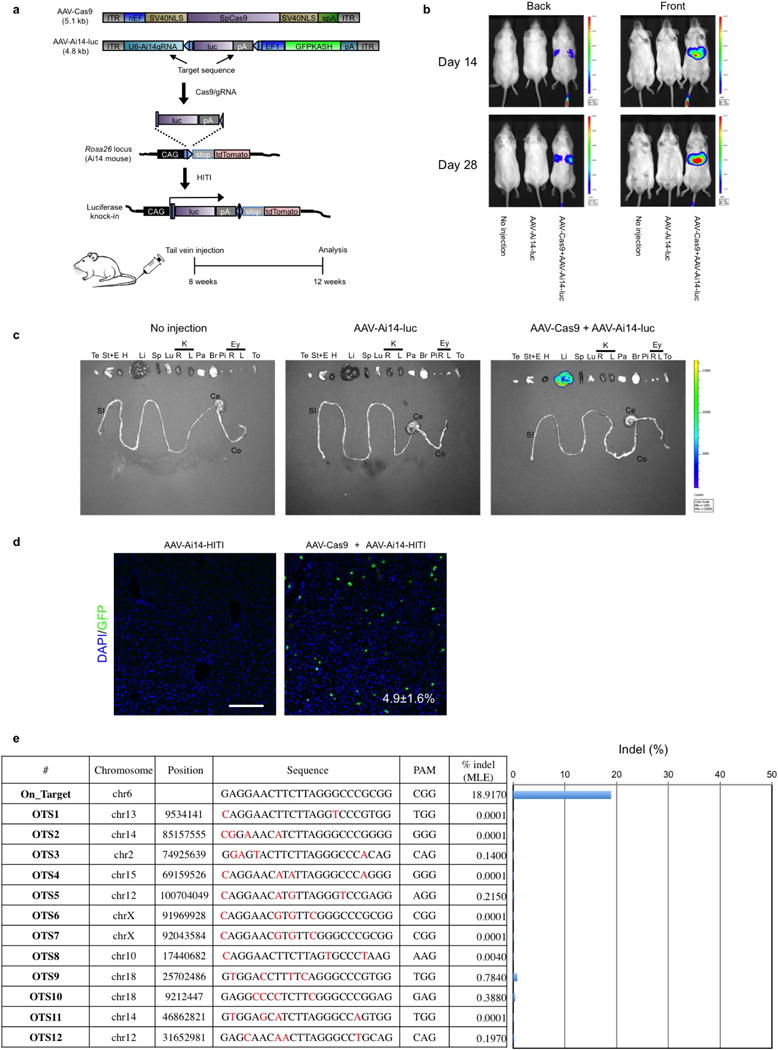
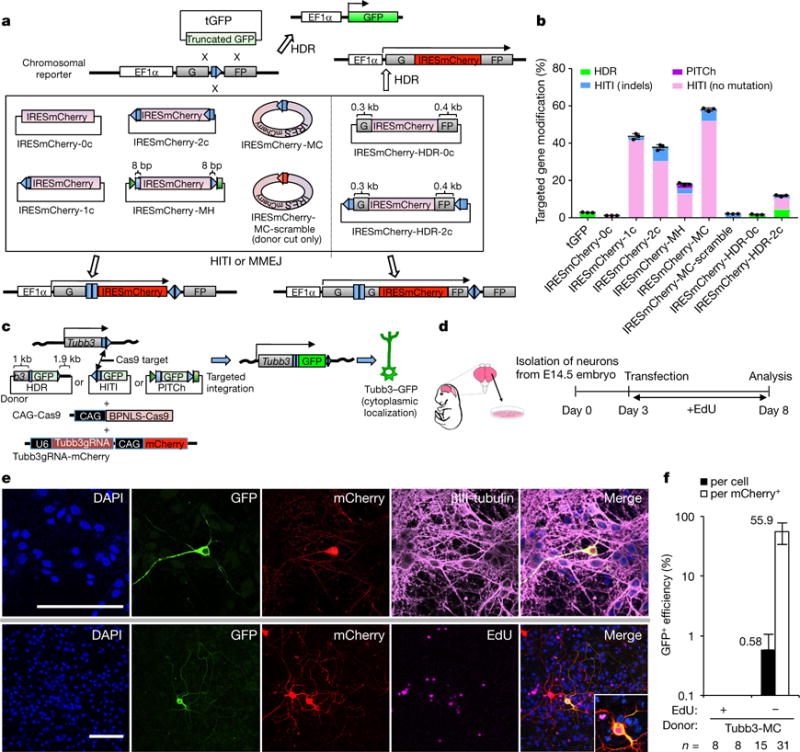
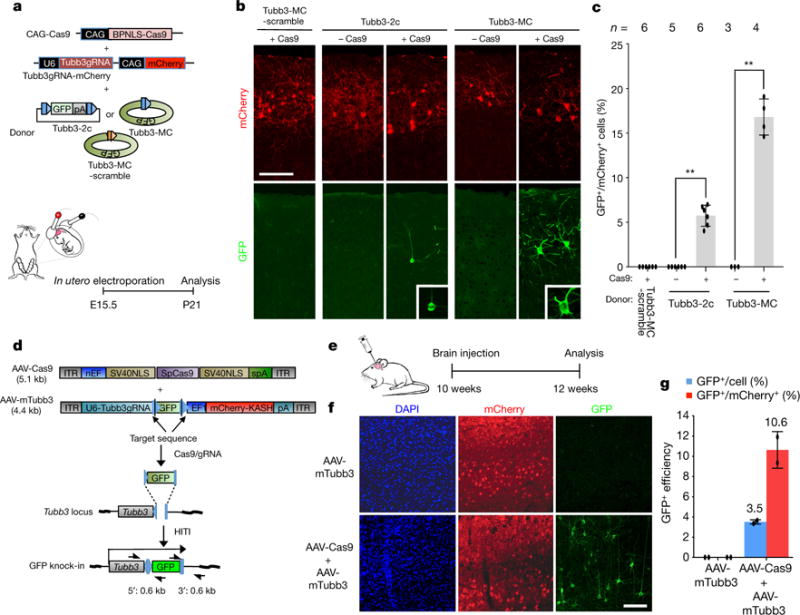
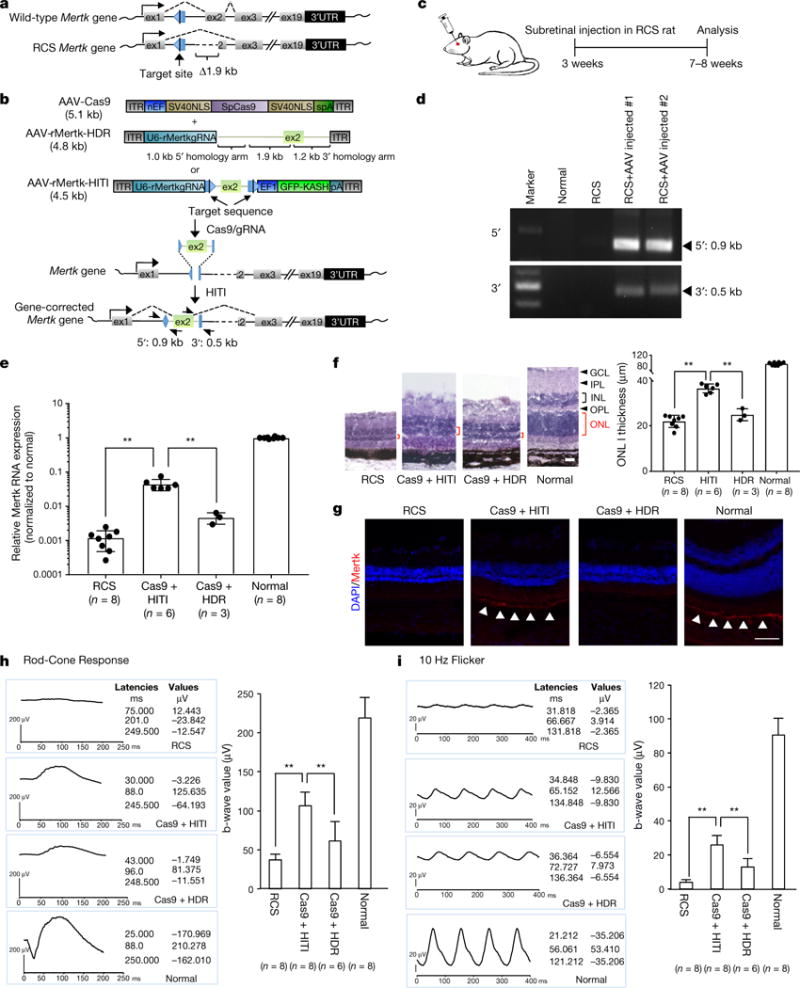
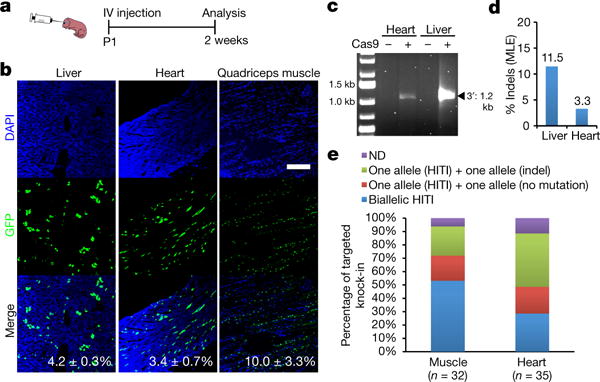
Targeted genome editing via engineered nucleases is an exciting area of biomedical research and holds potential for clinical applications. Despite rapid advances in the field, in vivo targeted transgene integration is still infeasible because current tools are inefficient, especially for non-dividing cells, which compose most adult tissues. This poses a barrier for uncovering fundamental biological principles and developing treatments for a broad range of genetic disorders. Based on clustered regularly interspaced short palindromic repeat/Cas9 (CRISPR/Cas9) technology, here we devise a homology-independent targeted integration (HITI) strategy, which allows for robust DNA knock-in in both dividing and non-dividing cells in vitro and, more importantly, in vivo (for example, in neurons of postnatal mammals). As a proof of concept of its therapeutic potential, we demonstrate the efficacy of HITI in improving visual function using a rat model of the retinal degeneration condition retinitis pigmentosa. The HITI method presented here establishes new avenues for basic research and targeted gene therapies.


Conflict of interest statement

The authors declare no competing financial interests. Readers are welcome to comment on the online version of the paper.

Figures

Extended Data Figure 1
Extended Data Figure 1. Optimization of donor vectors for HITI in HEK293 cells
a, Schematic of NHEJ-mediated targeted genome editing and different HITI donor vectors with Streptococcus pyogenes Cas9. Blue pentagon, Cas9/gRNA target sequence. Black line within blue pentagon, Cas9 cleavage site. GOI, gene of interest; DSBs, double strand breaks; Indels, insertions and deletions. b, Surveyor nuclease assay performed with Cas9, Scramble-gRNA, and different donor plasmids (IRESmCherry-MC or IRESmCherry-MC-scramble) in the GFP-correction HEK293 line. The two lower bands are cleaved DNA products by Surveyor nuclease, indicating that Cas9/Scramble-gRNA cut scramble target sequence on the donor, but not genomic sequence. c, Representative immunofluorescence images of the targeted gene integration in the GFP-correction HEK293 line by HDR and HITI. Scale bar, 100 μm. d, Time course studies of the percentages of mCherry+ cells with different HITI targeting vectors. e, The percentage of mCherry+ cells on day 79 versus day 7. f, The CpG methylation status of the mCherry gene at early (day 10) and late passages (day 79) with different HITI targeting vectors. Two black half-arrows indicate primers for bisulphite sequencing. g, The effect of the NHEJ inhibitor (NU7026; 30 μM) on knock-in efficiencies by HDR and HITI. Results were obtained from three replicate wells and presented as mean ± s.d. The input data points were shown as black dots. N.S., not significant. **P<0.01, unpaired Student’s t-test. For gel source image, see Supplementary Fig. 1. For source data, see Supplementary Table 5.
Extended Data Figure 2
Extended Data Figure 2. Sequencing analyses of the IRESmCherry knock-in clones via HITI in HEK293 cells
a, Analysis of the direction of targeted insertion for HITI with IRESmCherry-MC donor. Detection of reverse integrated IRESmCherry-MC from mCherry single-cell colonies via PCR. Only one (no. 30, highlighted in red) out of 48 mCherry clones (non-transfected, non-edited or reverse integrated) was integrated in reverse direction with a 10-bp deletion at junction site revealed by PCR and sequencing analysis. b, Sequences of the 5′ and 3′ junction sites of mCherry+ clones after IRESmCherry knock-in by HITI in the GFP-correction HEK293 line with IRESmCherry-1c donor. The blue pentagon and sequence highlighted in yellow indicate the Cas9/gRNA target sequence. The black line within the blue pentagon indicates the Cas9 cleavage site. The PAM sequence is underlined. c, Sequences of the 5′ and 3′ junction sites of mCherry+ clones after IRESmCherry knock-in by HITI in the GFP-correction HEK293 line with IRESmCherry-2c donor. d, Sequences of the 5′ and 3′ junction sites of mCherry+ clones after IRESmCherry knock-in by HITI in the GFP-correction HEK293 line with IRESmCherry-MC donor. e, Sequences of the 5′ junction site of mCherry+ clones after IRESmCherry knock-in by PITCh or HITI in the GFP-correction HEK293 line with IRESmCherry-MH donor. f, Sequences of the 5′ junction site of mCherry+ clones after IRESmCherry knock-in by HDR or HITI in the GFP-correction HEK293 line with IRESmCherry-HDR-2c donor. g, The fidelity of 5′ and 3′ junction sites of mCherry+ clones after IRESmCherry knock-in by HITI in the GFP-correction HEK293 line with IRESmCherry-1c, IRESmCherry-2c and IRESmCherry-MC donor. n, number of analysed clones. h, IRESmCherry-MC donor was transfected into the GFP-correction HEK293 line which has five copies of the target sequence in the genome. The ratio of IRESmCherry knock-in and mutation at all target loci of mCherry+ clones and the ratio of unmodified, mutated and reverse integrated target loci of mCherry clones were examined by sequencing. n, number of analysed clones. For gel source images, see Supplementary Fig. 1. For source data, see Supplementary Table 6.
Extended Data Figure 3
Extended Data Figure 3. Optimization of nuclear transport of Cas9
a, Schematic representation of a series of dCas9-Flag constructs with different nuclear localization signals. b, Representative immunofluorescence images of the transfected HEK293 cells stained with Flag antibody to visualize dCas9 localization. DNA was counterstained with DAPI. Scale bar, 50 μm. c, The nuclear/cytoplasm ratio of dCas9 with different NLS signals. n, number of analysed cells. Results were presented as mean ± s.e.m. The input data points were shown as black dots. **P < 0.01, unpaired Student’s t-test. d, e, Characterization of Cas9 nuclease activity in human ES cells. Agarose gel image (d) and quantification (e) show Surveyor nuclease assay performed with the gRNA targeting KCNQ1 gene and Cas9 with different NLSs, that is, Cas9 -NLS (Cas9 (no NLS)), Cas9 +NLS (1NLS-Cas9-1NLS) and Cas9 +BPNLS (1BPNLS-Cas9-1BPNLS). The two lower bands are cleaved DNA products by Surveyor nuclease. NHEJ (%) indicates the percentage of Cas9/gRNA-mediated gene modification. Results were obtained from three technical replicates and presented as mean ± s.e.m. The input data points were shown as black dots. *P < 0.05, paired Student’s t-test. For gel source image, see Supplementary Fig. 1. For source data, see Supplementary Table 7.
Extended Data Figure 4
Extended Data Figure 4. In-depth analyses of GFP knock-in in mouse primary neurons
a, b, Characterization of cultured primary neurons. Representative immunofluorescence images (a) and quantification (b) show that all of the neurons are EdU negative in this culture condition. All EdU+ cells were GFAP-positive glia, fractin-positive apoptotic cells, or fragmented cells. Results were obtained from 15 technical replicates and presented as mean. c, The percentage of knock-in cells (GFP+) per transfected cells (mCherry+) with HDR donor (Tubb3-HDR), PITCh donor (Tubb3-MH), 1-cut donor (Tubb3-1c), 2-cut donor (Tubb3-2c), 2-cut donor without polyA (Tubb3-2cd), or minicircle donor (Tubb3-MC). n, number of technical replicates. Results were presented as mean ± s.d. The input data points were shown as black dots. d, Left panel, schematic showing inserted DNA sequences, with or without bacteria backbone, with different HITI donors. Blue pentagon and yellow highlight, Cas9/gRNA target sequence. Black line within blue pentagon, Cas9 cleavage site. Underlined sequence, PAM sequence. pA, polyA. Right panel, subcellular distribution of TUBB3-GFP. n, number of analysed cells. e, Representative fluorescence images of the primary neurons transfected with BPNLS-Cas9, gRNA, and different donor plasmids (Tubb3-MC-scramble, Tubb3-HDR, Tubb3-MH, Tubb3-1c, Tubb3-2c, Tubb3-2cd or Tubb3-MC). Different intracellular localization patterns of TUBB3-GFP were observed for different donors. Scale bar, 100 μm. f, Left panel, schematic of knock-in by Tubb3-2c and Tubb3-MC donor at the 5′ and 3′ ends of Tubb3 coding region. Black half-arrows indicate PCR primers for detecting integrated sequences. Right panel shows the PCR result. gi, Sequences of the 5′ and 3′ junction sites after GFP knock-in by HITI in mouse primary neurons with Tubb3-2c (g), Tubb3-2cd (h) and Tubb3-MC (i) donor plasmids. For gel source images, see Supplementary Fig. 1. For source data, see Supplementary Table 8.
Extended Data Figure 5
Extended Data Figure 5. HITI-mediated GFP knock-in in neurons in vitro and in vivo
a, The percentage of knock-in (GFP+) cells in mouse primary neurons per transfected cells (mCherry+) with empty vector (−Cas9), Cas9 (+NLS) and Cas9 (+BPNLS). n, number of technical replicates. Results were presented as mean ± s.e.m. **P< 0.01, unpaired Student’s t-test. b, Representative immunofluorescence images of human ES cell-derived pan neurons transfected with BPNLS-Cas9, gRNA, and different donor plasmids (hTUBB3-1c or hTUBB3-2c). Scale bar, 100 μm. c, PCR analysis of integrated GFP gene at TUBB3 locus in human ES cell-derived pan neurons. d, e, Sequences of the 5′ junction sites after GFP knock-in by HITI in human ES cell-derived pan neurons with TUBB3-1c donor (d) and TUBB3-2c donor (e). f, Upper panel, schematic of GFP knock-in at the 3′ end of the Tubb3 coding region via Tubb3-MC donor in the neonatal mouse brain. Black half-arrows indicate PCR primers for detecting integrated sequences. Lower panel, genomic PCR results showing transgene integration at both 5′ and 3′ ends. g, Schematic of in vivo targeted GFP knock-in by HITI in the neonatal mouse brain. CAG-floxSTOP-Cas9, inducible BPNLS-Cas9 expression plasmid. ERT2-Cre-ERT2, tamoxifen (TAM) inducible Cre expression plasmid. Donor plasmids: Tubb3-HDR or Tubb3-MC. Tamoxifen was injected at P10 and P11. Mice were analysed at P21. h, Representative fluorescence images of GFP knock-in at the Tubb3 locus in neonatal mouse brain by inducible Cas9 expression with HDR donor (Tubb3-HDR) or minicircle HITI donor (Tubb3-MC). Scale bar, 100 μm. i, Relative knock-in efficiencies of HDR and HITI donors with or without tamoxifen treatment. n, number of pups obtained from two pregnant mice. Results were presented as mean ± s.d. The input data points were shown as black dots. **P <0.01. N.S., not significant. Unpaired student’s t-test. For gel source images, see Supplementary Fig. 1. For source data, see Supplementary Table 9.
Extended Data Figure 6
Extended Data Figure 6. HITI via in vivo DNA transfection
a, Schematic for in vivo targeted GFP-NLS or luciferase gene knock-in by HITI. CAG-Cas9, gRNA (Ai14gRNA or Scramble-gRNA)-mCherry and minicircle donor (Ai14-GFPNLS-MC-scramble, Ai14-luc-MC-scramble, Ai14-GFPNLS-MC or Ai14-luc-MC) were locally delivered to mouse kidney or muscle via pressure-mediated transfection and/or electroporation at 8 postnatal weeks and analysed 2 weeks later. b, In vivo imaging of luciferase signals at day 2, day 8, and day 14 postintramuscular injection of luciferase HITI constructs. Right leg (−Cas9) was injected with empty plasmid, Ai14gRNA-mCherry, and Ai14-luc-MC. Left leg (+Cas9) was injected with CAG-Cas9, Ai14gRNA-mCherry, and Ai14-luc-MC. Top, control wild-type (WT) mouse. Bottom, Ai14 mouse. c, Representative immunofluorescence images of GFP expression after intramuscular electroporation of GFP-NLS HITI constructs into Ai14 mouse quadriceps (left panel) and panniculus carnosus (right panel). Top panel, donor-cut only control (CAG-Cas9, Scramble-gRNA-mCherry, and Ai14-GFPNLS-MC-scramble). Middle panel, no Cas9 control (empty plasmid, Ai14gRNA-mCherry, and Ai14-GFPNLS-MC). Bottom panel, GFP-NLS HITI (CAG-Cas9, Ai14gRNA-mCherry, and Ai14-GFPNLS-MC). Insets, higher magnification images. Scale bar, 100 μm. d, In vivo imaging of luciferase signals at days 7 and 14 after pressure-mediated kidney transfection of luciferase HITI constructs. Left mouse (−Cas9) was delivered with empty plasmid, Ai14gRNA-mCherry and Ai14-luc-MC. Right mouse (+Cas9) was delivered with CAG-Cas9, Ai14gRNA-mCherry and Ai14-luc-MC. Top, control wild-type mouse. Bottom, Ai14 mouse. e, Ex vivo luciferase imaging of stomach and oesophagus (St+E), heart (H), liver (Li), spleen (Sp), lungs (Lu), right (R) and left (L) kidney (K), pancreas (Pa), small intestine (SI), caecum (Ce) and colon (Co). Arrow shows luciferase signal in the right kidney. Top, wild-type mouse. Bottom, Ai14 mouse. f, Representative immunofluorescence images of GFP expression after electroporation of GFP-NLS HITI constructs into Ai14 mouse kidney. Top panel, donorcut only control (CAG-Cas9, Scramble-gRNA-mCherry and Ai14-GFPNLS-MC-scramble). Middle panel, no Cas9 control (empty plasmid, Ai14gRNA-mCherry and Ai14-GFPNLS-MC). Bottom panel, GFp-NLS HITI (CAG-Cas9, Ai14gRNA-mCherry and Ai14-GFPNLS-MC). Scale bar, 100 μm.
Extended Data Figure 7
Extended Data Figure 7. AAV8-mediated HITI in cultured mouse primary neurons
a, Representative immunofluorescence images of neurons infected with AAV-Cas9 and AAV-mTubb3. AAVs were packaged with serotype 8. Insets, higher magnification images. Scale bar, 50 μm. b, Representative immunofluorescence images of GFP knock-in at the Tubb3 locus in pan neurons after AAV8 infections. Top panel, AAV-mTubb3 only. Bottom panel, AAV-Cas9 and AAV-mTubb3. Scale bar, 100 μm. The absolute GFP knock-in efficiency was shown in the upper right corner of the picture. Results were obtained from three technical replicates and presented as mean ± s.d. c, Intracellular distribution of the GFP expression after AAV8 infection (AAV-Cas9 and AAV-mTubb3). n, number of analysed cells. d, Validation of correct gene knock-in by PCR. e, Sequences of the 5′ and 3′ junction sites after GFP knock-in by HITI. For gel source image, see Supplementary Fig. 1. For source data, see Supplementary Table 10.
Extended Data Figure 8
Extended Data Figure 8. HITI via in vivo local injection of AAVs
a, Schematic of AAV vectors for inserting GFP-NLS downstream of the CAG promoter at the Ai14 Rosa26 locus. The AAVs were packaged with serotype 8. Half-arrows indicate PCR primers to validate correct gene knock-in. b, Schematic of the experimental design for in vivo targeted GFP-NLS gene knock-in by HITI via intramuscular (IM) injection in Ai14 mice. AAV8s (AAV-Cas9 and AAV-Ai14-HITI) were injected into quadriceps at 8 postnatal weeks and analysed at 12 weeks. c, Immunofluorescence analysis of GFP expression after IM delivery of AAV8s. Top panel, no Cas9 control (AAV-Ai14-HITI only). Bottom panel, GFP-NLS HITI (AAV-Cas9 and AAV-Ai14-HITI). Dystrophin was used as a marker for muscle cytoskeletal protein. Scale bar, 100 μm. d, Schematic and sequencing analyses of 5′ and 3′ junctions of the integration sites for Mertk exon 2 inserted by HITI in the eyes of RCS rats.
Extended Data Figure 9
Extended Data Figure 9. HITI-mediated GFP-NLS knock-in via systemic intravenous injection in neonatal Ai14 mice
a, Representative immunofluorescence images of GFP expression in the brain, muscle, kidney, adrenal gland, spleen, lung and choroid plexus of the eye after intravenous injection of AAV-Cas9 and AAV-Ai14-HITI. AAVs were packaged with serotype 8. Insets, higher magnification images. Scale bar, 100 μm. b, Comparison of HDR-and HITI-mediated targeted gene knock-in via systemic intravenous injection in neonatal mice. Left panel shows a schematic of AAV vectors for knock-in GFP downstream of the CAG promoter at the Ai14 Rosa26 locus. AAV-Ai14-scramble was used as a donor cut-only control. The HDR donor (AAV-Ai14-HDR) has homology arms at both ends of the GFP-NLS-pA cassette. The AAVs were packaged with serotype 8 and co-infected with AAV-Cas9 via IV, same as Fig. 4a. c, Absolute knock-in efficiency measured by the percentage of GFP+ cells in the liver and heart by HDR or HITI. Results were obtained from five slides and presented as mean ± s.d. **P < 0.01, unpaired Student’s t-test. d, Sequencing analyses of the 5′ and 3′ junction sites of heart and liver cells after GFP-NLS knock-in by HITI via intravenous AAV injections. For source data, see Supplementary Table 11.
Extended Data Figure 10
Extended Data Figure 10. HITI via in vivo systemic injection of AAVs in mice
a, Schematic of AAVs for knock-in luciferase downstream of the CAG promoter at the Ai14 Rosa26 locus. AAVs (AAV-Cas9 and AAV-Ai14-luc) were systemically delivered via tail vein injection in 8-week-old Ai14 mice and analysed at 12 weeks. The AAVs were packaged with serotype 9. b, In vivo imaging of luciferase signals at days 14 and 28 post-tail vein injection of luciferase HITI constructs. c, Ex vivo luciferase imaging analysis of testis (Te), stomach and oesophagus (St+E), heart (H), liver (Li), spleen (Sp), lungs (Lu), right (R) and left (L) kidney (K), pancreas (Pa), brain (Br), pituitary (Pi), right (R) and left (L) eye, (Ey), Tongue (To), small intestine (SI), caecum (Ce) and colon (Co). d, Representative immunofluorescence images of GFP expression in the liver after tail vein injection of HITI GFP-NLS gene knock-in AAV9. The absolute efficiency of GFP knock-in was shown in the bottom right corner. Results were obtained from five slides and presented as mean ± s.d. Scale bar, 200 μm. e, A list of on-and off-target sites that were used to determine the indel frequency of HITI mediated genome modifications using genomic DNA isolated from the liver. The nucleotide letters shown in red are the individual mismatches in predicted off-target sites.
Figure 1
Figure 1. HITI-mediated in vitro genome editing
a, Schematic of gene targeting by HDR, PITCh, or HITI in the GFP-correction HEK293 line. Blue pentagon, Cas9/gRNA target sequence. Black line within blue pentagon, Cas9 cleavage site. HITI donors: IRESmCherry-0c, IRESmCherry-1c, IRESmCherry-2c or IRESmCherry-MC. HDR-donors: tGFP and IRESmCherry-HDR-0c. A PITCh-donor: IRESmCherry-MH. The green square and triangle, CRISPR/Cas9 target sites to create 8-bp microhomology at both ends of the IRESmCherry cassette. HDR and HITI dual donors: IRESmCherry-HDR-2c. Genome cut-only control donor: IRESmCherry-0c. Donor cut-only control donor: IRESmCherry-MC-scramble. Red pentagon, Scramble-gRNA target sequence. b, Gene targeting efficiency by HDR, PITCh, or HITI (with or without indels at junction sites). Results were obtained from three replicate wells and presented as mean ± s.d. The input data points were shown as black dots. c, Schematic of targeted GFP knock-in by HDR, PITCh, or HITI in cultured primary neurons. d, Experimental scheme for GFP knock-in in cultured primary neurons. e, Representative immunofluorescence images of neurons transfected with Tubb3-GFP HITI constructs: BPNLS-Cas9, Tubb3gRNA-mCherry, and Tubb3-MC plasmids. Inset, higher magnification image. Scale bar, 100 μm. f, Targeted GFP knock-in efficiencies indicated by percentage of GFP+ cells among transfected cells (mCherry+) or all cells (DAPI+) in EdU+ or EdU neurons. n, technical replicates. Results were presented as mean ± s.d. For source data, see Supplementary Table 1.
Figure 2
Figure 2. HITI-mediated in vivo genome editing in neurons
a, Schematic of targeted GFP knock-in by HITI in fetal brain via in utero electroporation. b, Representative immunofluorescence images of neurons showing correct GFP knock-in at the Tubb3 locus. Insets, higher magnification images. Scale bar, 100 μm. mCherry, transfected cells. c, Relative knock-in efficiency measured by the percentage of GFP+ cells among mCherry+ cells. n, number of pups obtained from two pregnant mice. Results were presented as mean ± s.d. The input data points were shown as black dots. **P < 0.01, unpaired Student’s t-test. d, Schematic of HITI-AAV vectors for knock-in GFP to the downstream of Tubb3 gene. Black half-arrows, PCR primers. e, Schematic of in vivo HITI via local AAV injections in adult mouse brain. f, Representative immunofluorescence images of neurons in HITI-AAV injected brain sections. Scale bar, 100 μm. g, Relative and absolute knock-in efficiencies measured by the percentage of GFP+ cells among mCherry+ cells or all DAPI+ cells, respectively. Results were obtained from two animals and presented as mean ± s.d. The input data points were shown as black dots. For source data, see Supplementary Table 2.
Figure 3
Figure 3. HITI-mediated gene correction of a rat model of retinitis pigmentosa
a, Schematic representation of the Mertk gene locus in both wild-type and RCS rats. Blue pentagon, Cas9/gRNA target sequence. Black line within blue pentagon, Cas9 cleavage site. b, Schematic of Mertk gene correction AAV vectors. Black half-arrows, PCR primers. c, Experimental scheme for Mertk gene correction in RCS rats. d, Validation of correct gene knock-in by genomic PCR. e, Relative Mertk mRNA expression. n, number of animals. Results were presented as mean ± s.d. The input data points were shown as black dots. **P < 0.01, unpaired Student’s t-test. f, Retinal morphology and outer nuclear layer (ONL) thickness. Red bracket, ONL. GCL, ganglion cell layer; IPL, inner plexiform layer; INL, inner nuclear layer; OPL, outer plexiform layer. Scale bars, 20 μm. n, number of animals. Results were presented as mean ± s.d. The input data points were shown as black dots. **P < 0.01, unpaired Student’s t-test. g, Representative immunofluorescence images of MERTK expression in retinal pigment epithelium (RPE) of RCS eyes. Scale bars, 50 μm. h, Improved rod and cone mix response (left, wave forms; right, quantification bars) in HITI-AAVs injected eyes. n, number of animals. Results were presented as mean ± s.d. **P < 0.01, unpaired Student’s t-test. i, Improved 10 Hz flicker cone response in HITI-AAVs injected eyes. n, number of animals. Results were presented as mean ± s.d. **P < 0.01, unpaired Student’s t-test. For full gel images, see Supplementary Fig. 1. For source data, see Supplementary Table 3.
Figure 4
Figure 4. AAV-mediated systemic HITI in vivo
a, Schematic of in vivo targeted GFP-NLS knock-in by HITI via intravenous (IV) AAV injections to Ai14 mice. b, Representative immunofluorescence images of GFP expression in the liver, heart, and quadriceps muscle after intravenous injection of HITI-AAVs (serotype 9). The absolute efficiencies of GFP knock-in per cell (liver and heart) and per nucleus (quadriceps muscle) were shown. Results were obtained from five sections per sample and presented as mean ± s.d. Scale bar, 200 μm. c, Validation of correct gene knock-in in heart and liver by genomic PCR. d, Frequencies of indel per target sequence of liver and heart by deep sequencing. e, Single-cell genotyping of GFP+ cells from HITI-AAVs injected Ai14 mouse muscle and heart. n, number of the analysed single cells. ND, not determined. For full gel image, see Supplementary Fig. 1. For source data, see Supplementary Table 4.

Comment in

Similar articles

Cited by

References

    1. Naldini L. Gene therapy returns to centre stage. Nature. 2015;526:351–360. - PubMed
    1. Cox DBT, Platt RJ, Zhang F. Therapeutic genome editing: prospects and challenges. Nat Med. 2015;21:121–131. - PMC - PubMed
    1. Mali P, et al. RNA-guided human genome engineering via Cas9. Science. 2013;339:823–826. - PMC - PubMed
    1. Cong L, et al. Multiplex genome engineering using CRISPR/Cas systems. Science. 2013;339:819–823. - PMC - PubMed
    1. Lombardo A, et al. Site-specific integration and tailoring of cassette design for sustainable gene transfer. Nat Methods. 2011;8:861–869. - PubMed

Publication types