. 2016 Nov 16;12(11):e1005989.
doi: 10.1371/journal.ppat.1005989. eCollection 2016 Nov.

Diversification in the HIV-1 Envelope Hyper-variable Domains V2, V4, and V5 and Higher Probability of Transmitted/Founder Envelope Glycosylation Favor the Development of Heterologous Neutralization Breadth

Affiliations

Diversification in the HIV-1 Envelope Hyper-variable Domains V2, V4, and V5 and Higher Probability of Transmitted/Founder Envelope Glycosylation Favor the Development of Heterologous Neutralization Breadth

S Abigail Smith et al. PLoS Pathog. .

Abstract

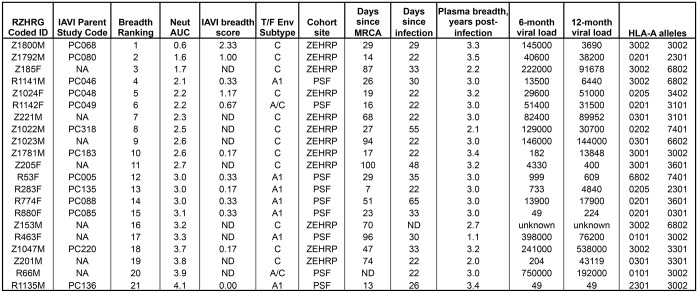
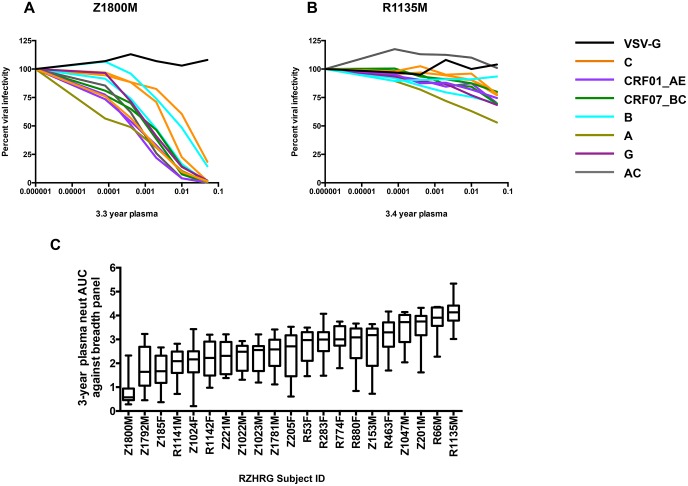
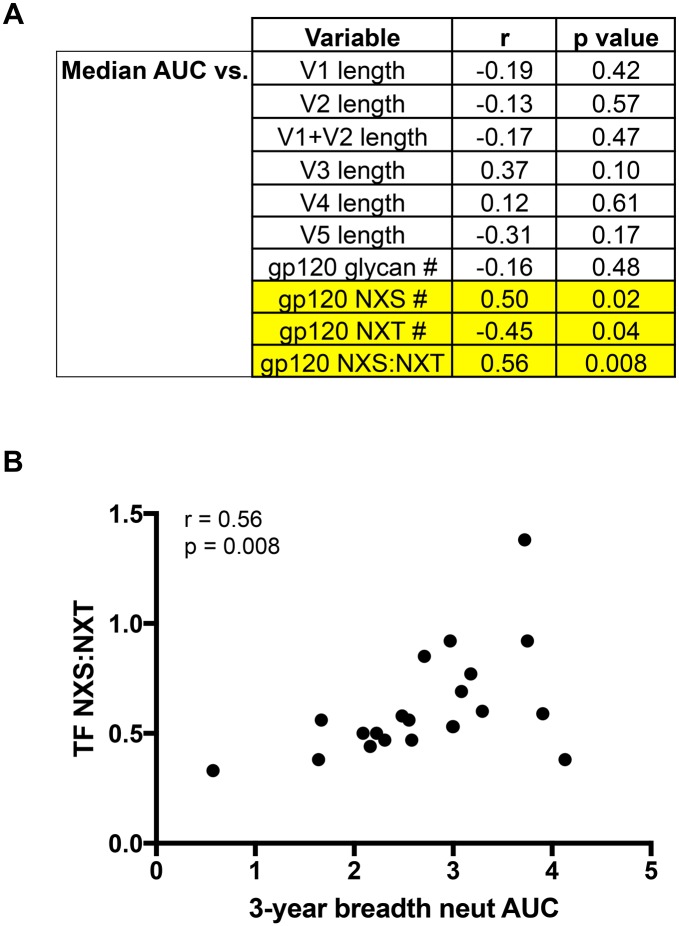
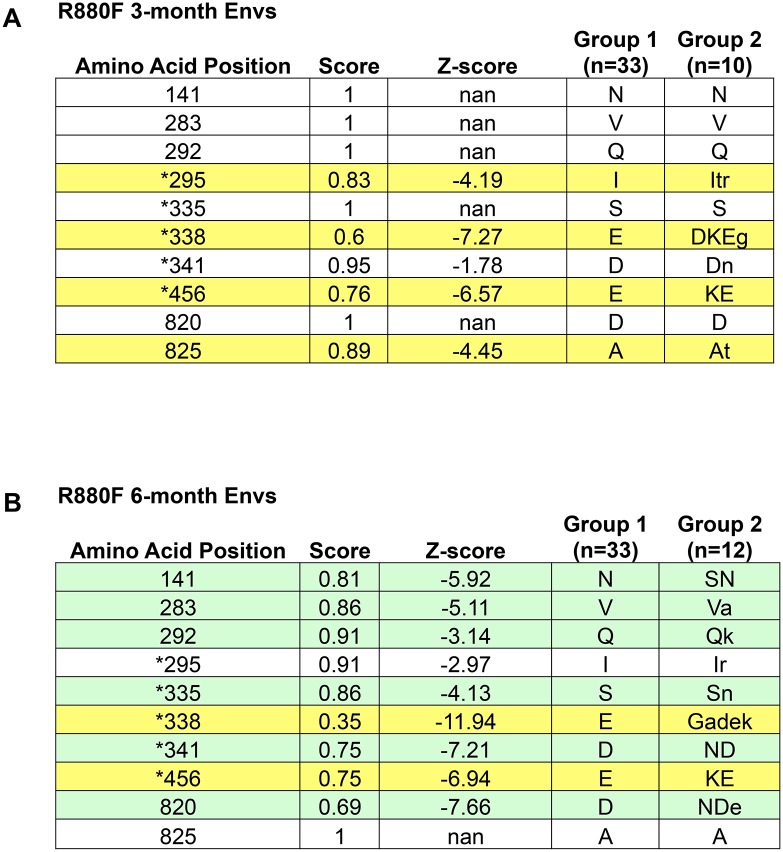
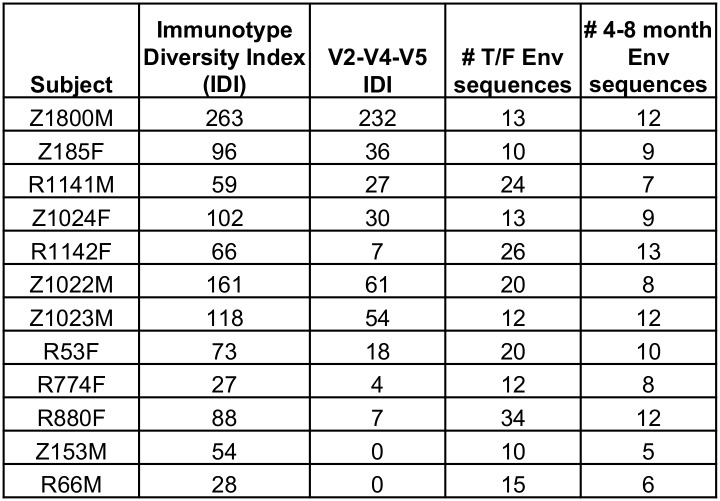
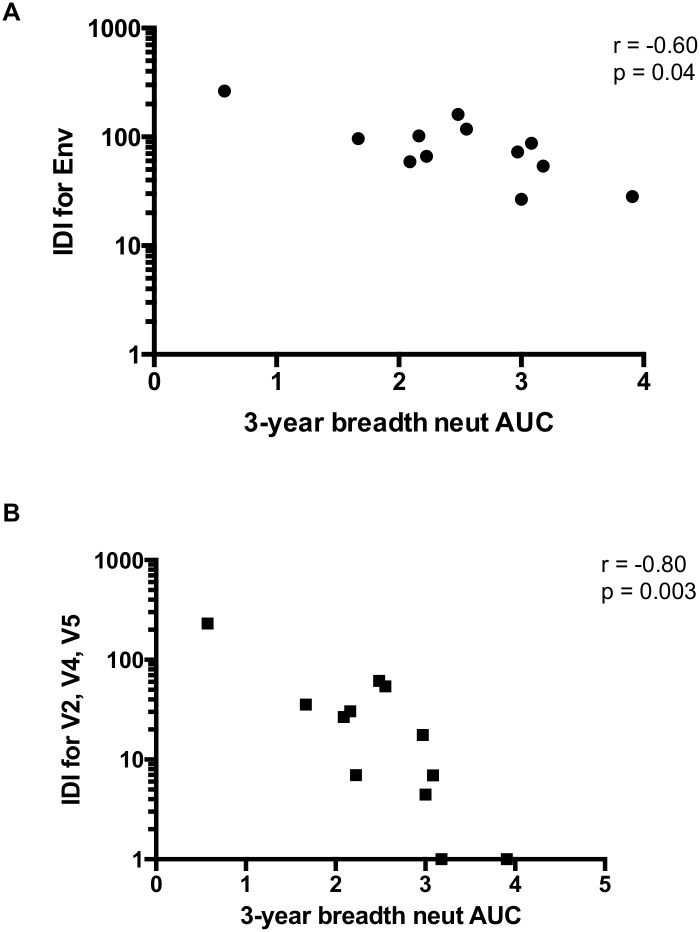
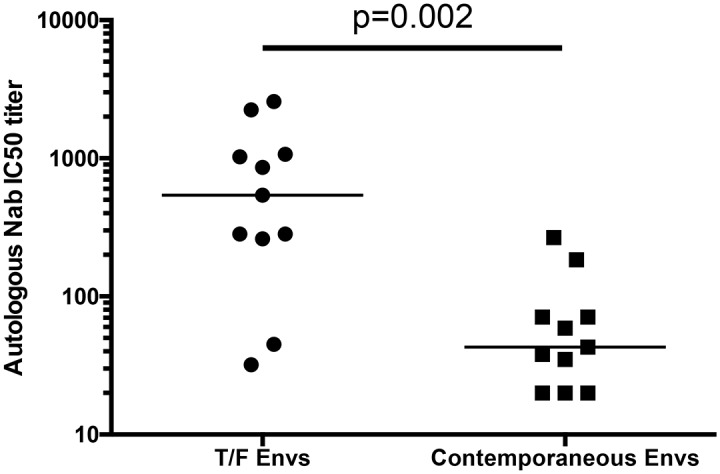
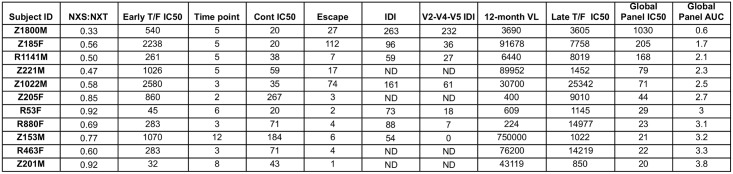
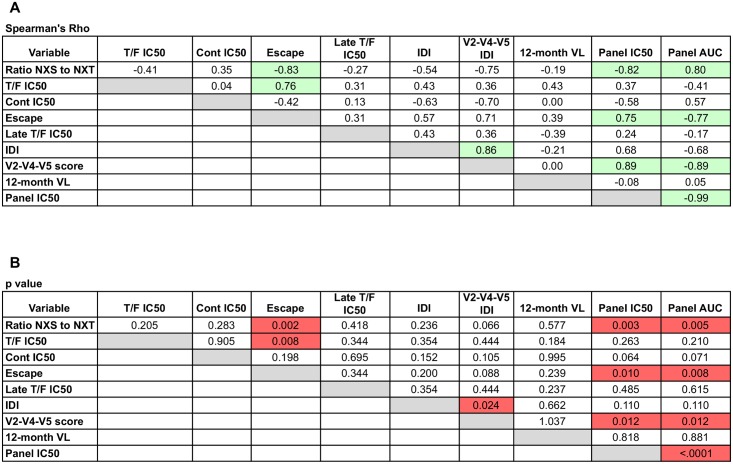
A recent study of plasma neutralization breadth in HIV-1 infected individuals at nine International AIDS Vaccine Initiative (IAVI) sites reported that viral load, HLA-A*03 genotype, and subtype C infection were strongly associated with the development of neutralization breadth. Here, we refine the findings of that study by analyzing the impact of the transmitted/founder (T/F) envelope (Env), early Env diversification, and autologous neutralization on the development of plasma neutralization breadth in 21 participants identified during recent infection at two of those sites: Kigali, Rwanda (n = 9) and Lusaka, Zambia (n = 12). Single-genome analysis of full-length T/F Env sequences revealed that all 21 individuals were infected with a highly homogeneous population of viral variants, which were categorized as subtype C (n = 12), A1 (n = 7), or recombinant AC (n = 2). An extensive amino acid sequence-based analysis of variable loop lengths and glycosylation patterns in the T/F Envs revealed that a lower ratio of NXS to NXT-encoded glycan motifs correlated with neutralization breadth. Further analysis comparing amino acid sequence changes, insertions/deletions, and glycan motif alterations between the T/F Env and autologous early Env variants revealed that extensive diversification focused in the V2, V4, and V5 regions of gp120, accompanied by contemporaneous viral escape, significantly favored the development of breadth. These results suggest that more efficient glycosylation of subtype A and C T/F Envs through fewer NXS-encoded glycan sites is more likely to elicit antibodies that can transition from autologous to heterologous neutralizing activity following exposure to gp120 diversification. This initiates an Env-antibody co-evolution cycle that increases neutralization breadth, and is further augmented over time by additional viral and host factors. These findings suggest that understanding how variation in the efficiency of site-specific glycosylation influences neutralizing antibody elicitation and targeting could advance the design of immunogens aimed at inducing antibodies that can transition from autologous to heterologous neutralizing activity.


Conflict of interest statement

The authors have declared that no competing interests exist.

Figures

Fig 1
Fig 1. Summary of HIV-1 infected participants.
The Rwanda-Zambia HIV Research Group (RZHRG) coded identification numbers for all subjects are shown, along with the associated code assigned in [36]. Individuals are listed in the order of their breadth ranking, based on the median AUC values, when plasma was tested against a panel of 12 globally representative tier 2 Envelopes (Fig 2C). The International AIDS Vaccine Initiative (IAVI) breadth score is taken from [36]. Relevant information is shown in subsequent columns, including the subtype of the T/F Env: cohort site (Zambia-Emory HIV Research Project or ZEHRP; Projet San Francisco or PSF): days since most recent common ancestor (MRCA) calculated using the Los Alamos HIV Database tool Poisson Fitter v2 [58]: days since infection estimated using methods described by [59]; time point in years post-infection when breadth was assessed; as well as the 6- and 12-month plasma viral loads (copies per ml) and HLA-A alleles determined as described in [60]. NA indicates not applicable; ND indicates not determined.
Fig 2
Fig 2. Evaluation of heterologous neutralization breadth in plasma samples from 21 recently HIV-1 infected individuals.
Infectivity curves depicting neutralization activity against a panel of 12 global reference Env pseudoviruses described in [51] in the TZM-bl assay are shown for subjects Z1800M (A) and R1135M (B). These two subjects were chosen to demonstrate the highest and lowest level of neutralization breadth. Each curve represents neutralization of one of the 12 reference Envs, and is color coded by the subtype or circulating recombinant form (CRF) designation, as indicated in the key. Neutralization of VSV-G pseudotyped virus is shown as a negative control with a black curve. The y-axis indicates percent viral infectivity relative to 100%, which is the amount of luciferase produced in pseudovirus-infected TZM-bl cells in the absence of test plasma. The x-axis indicates the reciprocal dilution of the individual’s plasma plotted on a log10 scale. The Area Under the Curve (AUC) was calculated from each infectivity curve to quantify neutralization potency and breadth. The median and range for the neutralization AUC values calculated for each subject’s plasma against the 12 Env reference panel are in shown in (C). High AUC values indicate weak neutralization activity, while low AUC values indicate strong neutralization activity. All AUC values are shown in S1A Fig, with the accompanying IC50 titers shown in S1B Fig.
Fig 3
Fig 3. Correlation of T/F Env features with neutralization breadth.
T/F Env amino acid sequence features for 21 subjects were defined using the LANL N-GlycoSite and Variable Region Characteristics online tools. A) Spearman’s correlations were performed between neutralization breadth AUC and variable loop lengths, number of total, (NXS + NXT), NXS, and NXT glycan motifs (excluding X = proline) in gp120, and the ratio of NXS motifs divided by NXT motifs. Spearman’s r values and p values are shown for each comparison. P values < 0.05 are considered significant. B) Scatter plot of median 3-year breadth AUC value vs ratio of NXS:NXT sites in the transmitted/founder Env. Spearman correlation r = 0.56, p = 0.008.
Fig 4
Fig 4. Validation of the Immunotype Diversity Index approach to quantify Env diversification using R880F.
Subject R880F was chosen to validate the Sequence Harmony approach because the earliest neutralizing antibody response was previously mapped to an epitope located at the base of the V3 loop [11]. Positions indicated with an asterisk were identified and evaluated in the previous study. Thirty-three SGA derived T/F Env amino acid sequences from R880F (Group 1) were aligned with 10 sequences from 3-months post-infection (A), or 12 sequences from 6-months post-infection (B) (Group 2). In (A), Sequence Harmony analysis identified four positions, highlighted yellow, that were significantly different (Z<-3) between the two populations at 3-months. Two of these positions were determined to be autologous neutralizing antibody escape mutations at 3-months via mutagenesis (295 and 338), whereas 456 could not be directly attributed to neutralizing antibody or cytotoxic T lymphocyte selective pressure. In (B), Sequence Harmony analysis identified two positions that remained significant from 3 months (highlighted yellow), six positions that became significant at 6 months (highlighted green), and two positions that lost significance at 6 months (not highlighted). Positions 335, 338, and 341 were all determined to be neutralizing antibody escape mutations at 6 months.
Fig 5
Fig 5. Immunotype Diversity Index scores for 12 subjects.
For each position where Z-scores were less than -3 in Sequence Harmony analysis, the nature of the change, in addition to shifts in glycans and the significance of the difference, was taken into account when calculating the Immunotype Diversity Index. Changes (conservative = 0.5; non-conservative, deletions, purifying selection = 1, glycan shift or deletion = 1) were multiplied by absolute value of Z-scores to factor in significance, and added together for a final IDI. These values ranged from 28 to 263. When IDI was restricted to significant positions within V2, V4, and V5, the values ranged from 0 to 232. The number of T/F Env sequences and longitudinal Env sequences from 4–8 months included in this analysis are indicated.
Fig 6
Fig 6. Correlation of Immunotype Diversity Index scores with neutralization breadth.
A) Spearman’s correlation of IDI scores with median AUC breadth scores (n = 12) revealed a relationship between early Env diversity and later development of neutralization breadth (r = -0.60, p = 0.04). B) This correlation was stronger when IDI scores only included diversity found within the V2, V4, and V5 variable loops (r = -0.80, p = 0.003). Two patients with V2-V4-V5 scores of zero were given a value of 1 for illustrative purposes on the log10 scale.
Fig 7
Fig 7. Autologous early neutralization of T/F Envs vs. contemporaneous Envs.
For 11 patients, sampling allowed neutralization assays to be performed on T/F Envs, and Envs from an early time-point (range 2 to 12 months, median 5 months), with the early time-point plasma listed in Fig 8. Wilcoxon matched-pairs signed rank test revealed a significant difference between neutralization IC50 titer of the early plasma vs. T/F Envs, compared to the same plasma against the contemporaneous Envs (p = 0.002).
Fig 8
Fig 8. Summary of quantitative factors that potentially contribute to neutralization breadth.
Autologous plasma neutralization IC50 titers for the T/F Env and contemporaneous Envs from an early time point ranging from 2 to 12 months (median 5 months) is shown for 11 patients, along with the ratio of NXS to NXT glycan sites in the T/F gp120, the magnitude of escape (T/F Env IC50 divided by contemporaneous Env IC50), full Env and V2-V4-V5 IDI values, and the 12-month plasma viral load. The neutralization IC50 titer of 3-year plasma against the autologous T/F Env and the heterologous global reference Env panel is shown, in addition to the neutralization AUC against the global reference panel.
Fig 9
Fig 9. Spearman’s correlation analysis of quantitative factors and neutralization breadth.
A) Spearman’s rho values are shown for each pairwise correlation analysis between variables. B) p-values are shown for each pairwise correlation analysis between variables. A p value < 0.05 was considered significant.

Similar articles

Cited by

References

    1. Mansky LM, Temin HM (1995) Lower in vivo mutation rate of human immunodeficiency virus type 1 than that predicted from the fidelity of purified reverse transcriptase. J Virol 69: 5087–5094. - PMC - PubMed
    1. Jetzt AE, Yu H, Klarmann GJ, Ron Y, Preston BD, et al. (2000) High rate of recombination throughout the human immunodeficiency virus type 1 genome. J Virol 74: 1234–1240. - PMC - PubMed
    1. Robertson DL, Anderson JP, Bradac JA, Carr JK, Foley B, et al. (2000) HIV-1 nomenclature proposal. Science 288: 55–56. - PubMed
    1. Worobey M, Gemmel M, Teuwen DE, Haselkorn T, Kunstman K, et al. (2008) Direct evidence of extensive diversity of HIV-1 in Kinshasa by 1960. Nature 455: 661–664. 10.1038/nature07390 - DOI - PMC - PubMed
    1. Starcich BR, Hahn BH, Shaw GM, McNeely PD, Modrow S, et al. (1986) Identification and characterization of conserved and variable regions in the envelope gene of HTLV-III/LAV, the retrovirus of AIDS. Cell 45: 637–648. - PubMed

Substances