. 2016 Nov 15;45(5):1122-1134.
doi: 10.1016/j.immuni.2016.10.032.

Regulatory T Cells Exhibit Distinct Features in Human Breast Cancer

Affiliations

Regulatory T Cells Exhibit Distinct Features in Human Breast Cancer

George Plitas et al. Immunity. .

Abstract

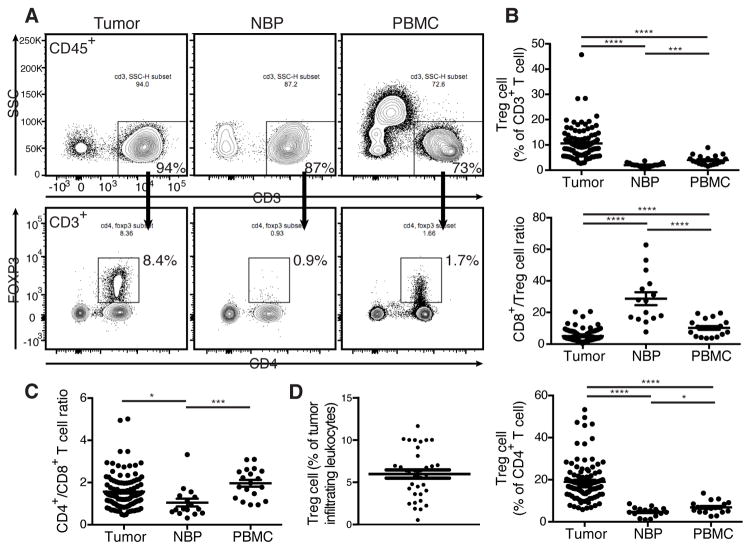
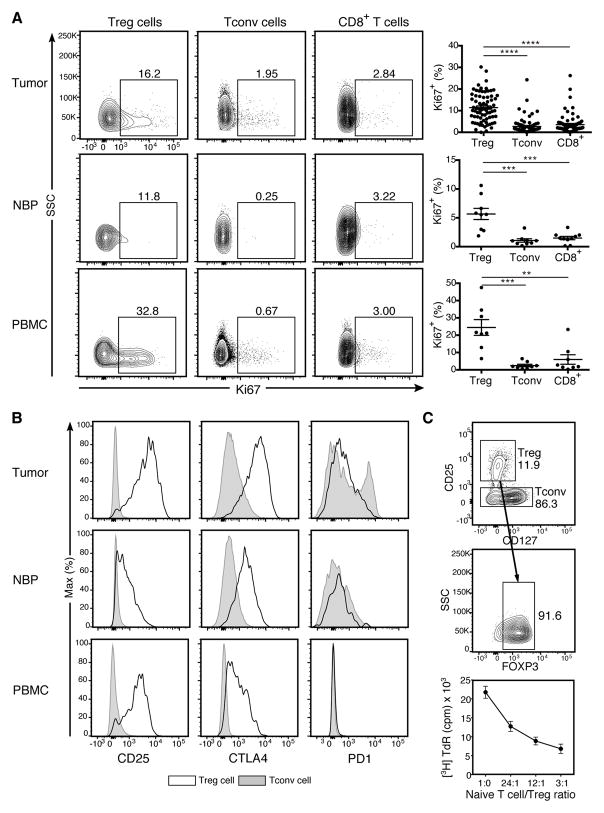
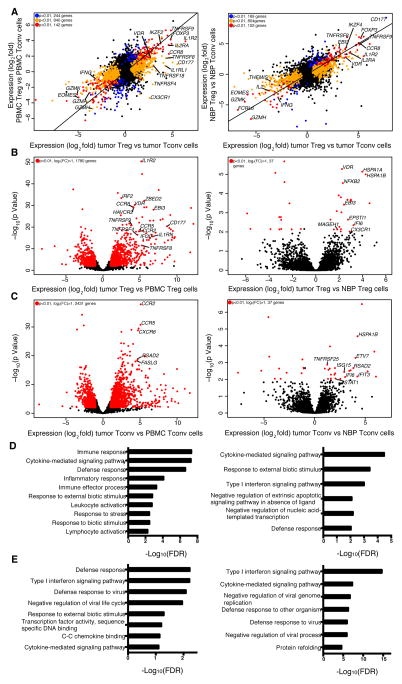
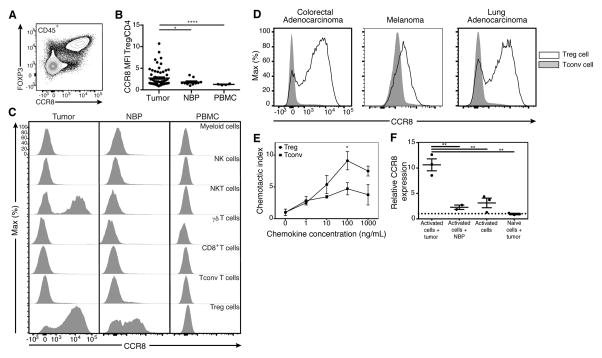
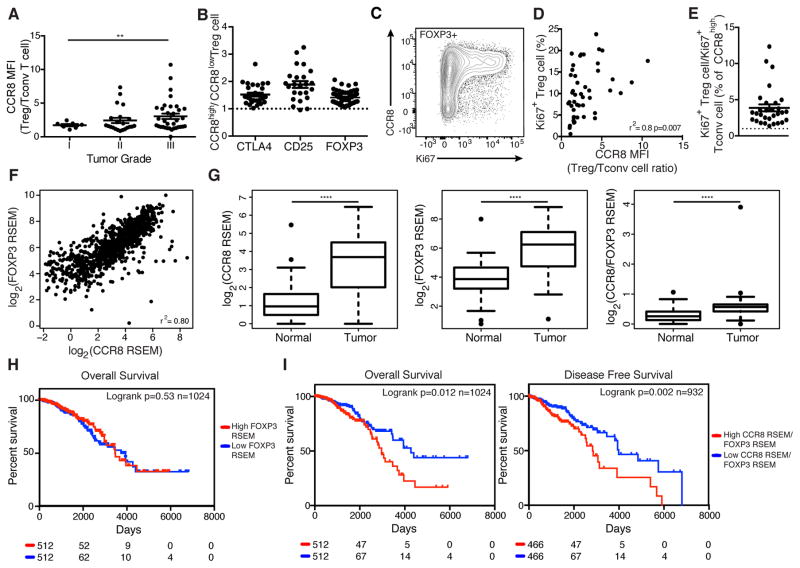
Regulatory T (Treg) cells reside in lymphoid organs and barrier tissues where they control different types of inflammatory responses. Treg cells are also found in human cancers, and studies in animal models suggest that they contribute to cancer progression. However, properties of human intratumoral Treg cells and those present in corresponding normal tissue remain largely unknown. Here, we analyzed features of Treg cells in untreated human breast carcinomas, normal mammary gland, and peripheral blood. Tumor-resident Treg cells were potently suppressive and their gene-expression pattern resembled that of normal breast tissue, but not of activated peripheral blood Treg cells. Nevertheless, a number of cytokine and chemokine receptor genes, most notably CCR8, were upregulated in tumor-resident Treg cells in comparison to normal tissue-resident ones. Our studies suggest that targeting CCR8 for the depletion of tumor-resident Treg cells might represent a promising immunotherapeutic approach for the treatment of breast cancer.


Figures

Figure 1
Figure 1. Treg cells densely populate human breast tumors
Freshly isolated human primary breast tumor, NBP, and peripheral blood mononuclear cells (PBMC) were analyzed by flow cytometry. (A) Representative flow cytometric analysis of lymphocytes from tumor, NBP, and PBMC isolated from a patient with primary breast cancer. (Data are representative of findings in samples analyzed from 105 patients). (B) Scatter plots indicating the cumulative frequency of Treg cells among all T cells and the CD8+:Treg cell ratio. (C) Ratio of CD4+ to CD8+ T cells in tumor, NBP, and PBMC. Data represent the analysis of over 100 individual patients; error bars represent SEM; *p<0.05; **p<0.01, ***p<0.001, ns: non significant (unpaired two-tailed Student’s t test). (D) Cumulative frequency of Treg cells among all tumor-infiltrating leukocytes. Please also see Table S1.
Figure 2
Figure 2. Treg cell frequency correlates with grade and type of human breast cancer
(A) Scatter plots representing the frequency of T cell subsets based on biologic subtype (ER+, Estrogen receptor >1% positive Her2 non-amplified; Her2+, Her2 amplified either by 3+ staining on immunohistochemistry or FISH Her2-to-CEP17 ratio > 2.2; TNBC, ER<1%, PR<1%, Her2 non-amplified) and based on histologic grade. C) Scatter plots representing the frequency of proliferating Treg cells in tumors based on histologic grade and biologic subtype. Frequencies are the % of Treg cells that are Ki67+. Data represent the analysis of over 100 individual patients; error bars represent SEM; *p<0.05; **p<0.01, ***p<0.001, ns non significant (unpaired two-tailed Student’s T test). The 57 high grade tumors included 33 ER+, 18 TNBC, and 6 Her2+ samples.
Figure 3
Figure 3. Tumor resident Treg cells are activated and potently suppressive
(A) Representative flow cytometric analysis of lymphocytes from tumor, NBP, and peripheral blood isolated from a patient with primary breast cancer and summary plot indicating the proportion of lymphocytes from tumor, NBP and peripheral blood that are Ki67+. Data represent the analysis of over 70 individual patients; error bars represent SEM; *p<0.05; **p<0.01, ***p<0.001, ns non significant (unpaired two-tailed Student’s T test). (B) Mean fluorescence intensity (MFI) of staining for activation markers on cells gated on Treg (open histograms) and CD4+ conventional T (Tconv) cells (shaded histograms) in breast tumor, NBP and peripheral blood. Individual dots represent data are from individual tumor specimens. (C) Tumor resident CD4+CD25hi Treg cells were flow cytometry isolated and their capacity to suppress proliferation of naïve Tconv cells in vitro was assessed by 3H-thymidine incorporation on day 4 (n=3, plot is representative of 3 independent experiments).
Figure 4
Figure 4. Tumor Infiltrating Treg and non-Treg CD4 cells are transcriptionally similar to tissue resident cells
(A) Left: genes differentially expressed in tumor resident Treg cells vs. tumor resident Tconv cells compared to genes differentially expressed in peripheral blood Treg cells vs. Tconv cells (n=4, n=6, n=6, n=4, respectively). Right: genes differentially expressed in tumor resident Treg cells vs. Tconv cells compared to genes differentially expressed in NBP Treg cells vs. NBP Tconv cells (n=8, n=9, n=4, n=5, respectively). The indicated cell subpopulations were sorted based on CD4, CD25 CD45RO and CD127 expression. Gene expression was measured by RNAseq using IonTorrent (left) and Illumina HiSeq (right) platforms; differential gene expression analysis was performed with the DESeq2 package, where p-values represent FDR. A normalized gene count cutoff of 50 was used. Genes down- or up-regulated in tumor resident Treg cells are shown in orange (p<0.01), while genes down- or up-regulated in peripheral blood or NBP Treg cells are shown in blue (p<0.01). Genes down- or up-regulated in both tumor and peripheral blood or NBP Treg cells are shown in red (p<0.01). The numbers of genes differentially expressed are indicated. (B, C) Left: volcano plot comparing the p-value versus fold-change for genes from tumor resident Treg (B) and Tconv cells (C) relative to peripheral blood Treg (B) and Tconv cells (C) (n=4, n=6 respectively for both comparisons). Right: volcano plot comparing the p-value versus fold-change for genes from tumor resident Treg (B) and Tconv cells (C) relative to NBP Treg (n=8, n=5, respectively) (B) and Tconv cells (n=9, n=6, respectively) (C). Genes labeled in red are significantly differentially expressed between tumor and peripheral blood or NBP Treg and Tconv cells (p<0.01). (D, E) Gene Set enrichment analysis was performed using the GOrilla bioinformatics tool for significantly up-regulated genes in tumor Treg cells relative to peripheral blood Treg cells on left or NBP Treg cells on right (p-value<0.05, mean normalized read count>50) as the target gene set and all genes expressed in the RNA-seq data as the background set (expressed genes are defined as genes with mean normalized read count>20). Please also see Figure S1, S2.
Figure 5
Figure 5. TCR beta repertoires of tumor and NBP Treg and Tconv cells are oligoclonal and non-overlapping
(A) Within-patient similarity of TCR beta CDR3 repertoires between Treg and Tconv cells in breast tumors and NBP was assessed by measuring relative abundance of clones shared between the pairs of samples and displayed as F2 similarity index. P-values were calculated using an unpaired two-tailed Student’s t test. (B) Fraction of the TCR beta CDR3 repertoire occupied by the 10 most abundant clones. Please also see Figure S3.
Figure 6
Figure 6. CCR8 expression by tumor resident Treg cells is specific and functional
(A) CCR8 staining of CD45+ cells from a human breast tumor. (B) MFI of CCR8 expression on multiple cell types in tumor, NBP, and peripheral blood isolated from a patient with primary breast cancer. (C) Summary plot of MFI ratio of CCR8 expression on Treg cells to Tconv cells in breast tumors, NBP and peripheral blood. Data represent the analysis of over 70 individual patients; error bars represent SEM; *p<0.05; **p<0.01, ***p<0.001, ns non significant (unpaired two-tailed Student’s t test). (D) MFI of CCR8 expression gated on Treg cells (open histograms) and Tconv cells (shaded histograms) in colorectal adenocarcinoma, melanoma and lung adenocarcinoma. (E) CD3+ T cells were isolated by flow cytometry from a primary breast tumor and their migratory capacity was assessed in in vitro transwell migration assays. Plot is representative of 5 independent experiments; error bars represent SEM; *p<0.05; **p<0.01, ***p<0.001, ns non significant (unpaired two-tailed Student’s T test). (F) Effect of breast tumor soluble factors on CCR8 expression by Treg cells was assessed by culturing tumor slices and naïve Treg cells isolated from peripheral blood in transwell chambers separated by a 0.4 um membrane. CCR8 mRNA in Treg cells was measured by qPCR on day 5 with ADAR as a reference gene and calibrated to expression in non-activated Treg cells. Data represent 3 independent experiments; error bars represent SEM; *p<0.05; **p<0.01, ***p<0.001, ns non significant (unpaired two-tailed Student’s T test). Please also see Figure S4, S5, S6.
Figure 7
Figure 7. Treg CCR8 expression correlates with clinic-pathologic features of human breast cancer and is associated with poor disease free and overall survival
(A) Summary plot of MFI ratio of CCR8 expression on Treg cells to Tconv cells in breast tumors based on histologic grade. Data represent the analysis of 61 individual patients; error bars represent SEM; *p<0.05; **p<0.01, ***p<0.001, ns non significant (unpaired two-tailed Student’s T test). (B) MFI ratio of various Treg cell activation marker expression by CCR8high vs. CCR8low Treg cells in individual breast tumors. Data represent the analysis of 57 individual patients. (C) CCR8 and Ki67 staining of CD4+Foxp3+ T cells from a human breast tumor. (D) Correlation of MFI ratio of CCR8 expression on Treg cells to Tconv cells and % of Ki67+ Treg cells in individual breast tumors. Data represent the analysis of 48 individual patients. (E) Ratio of percent of CCR8high Treg cells that are Ki67+ to percent of CCR8low Treg cells that are Ki67+ in individual breast tumors. Data represent the analysis of 30 individual patients. (F) Correlation of CCR8 and FOXP3 normalized mRNA expression in the TCGA breast cancer dataset (Spearman’s r2=0.80, n=1024). mRNA normalization was estimated by the TCGA using the RSEM (RNA-seq by expectation maximization) method. (G) Boxplots comparing CCR8, FOXP3 or CCR8 to FOXP3 ration normalized mRNA amount in breast tumors versus adjacent NBP. Data represent the analysis of 111 individual patients; *p<0.05; **p<0.01, ***p<0.001, ****p<0.0001, ns non significant (paired two-tailed Student’s T test). (H) Overall survival of breast cancer patients stratified by median tumor FOXP3 normalized mRNA amount (Log-rank p=0.53, n=1024, Mantel-Cox test) (I) Overall survival (Log-rank p=0.012, n=1024, Mantel-Cox test) and disease-free survival (Log-rank p=0.002, n=932, Mantel-Cox test) of breast cancer patients stratified by median tumor CCR8/FOXP3 normalized mRNA ratio. Please also see Figure S7.

Comment in

References

    1. Bates GJ, Fox SB, Han C, Leek RD, Garcia JF, Harris AL, Banham AH. Quantification of regulatory T cells enables the identification of high-risk breast cancer patients and those at risk of late relapse. Journal of clinical oncology : official journal of the American Society of Clinical Oncology. 2006;24:5373–5380. - PubMed
    1. Bohling SD, Allison KH. Immunosuppressive regulatory T cells are associated with aggressive breast cancer phenotypes: a potential therapeutic target. Modern pathology : an official journal of the United States and Canadian Academy of Pathology, Inc. 2008;21:1527–1532. - PubMed
    1. Bolotin DA, Poslavsky S, Mitrophanov I, Shugay M, Mamedov IZ, Putintseva EV, Chudakov DM. MiXCR: software for comprehensive adaptive immunity profiling. Nature methods. 2015;12:380–381. - PubMed
    1. Bos PD, Plitas G, Rudra D, Lee SY, Rudensky AY. Transient regulatory T cell ablation deters oncogene-driven breast cancer and enhances radiotherapy. The Journal of experimental medicine. 2013;210:2435–2466. - PMC - PubMed
    1. Burzyn D, Benoist C, Mathis D. Regulatory T cells in nonlymphoid tissues. Nature immunology. 2013;14:1007–1013. - PMC - PubMed

Publication types