. 2016 Nov 15;45(5):1135-1147.
doi: 10.1016/j.immuni.2016.10.021.

Transcriptional Landscape of Human Tissue Lymphocytes Unveils Uniqueness of Tumor-Infiltrating T Regulatory Cells

Affiliations

Transcriptional Landscape of Human Tissue Lymphocytes Unveils Uniqueness of Tumor-Infiltrating T Regulatory Cells

Marco De Simone et al. Immunity. .

Abstract

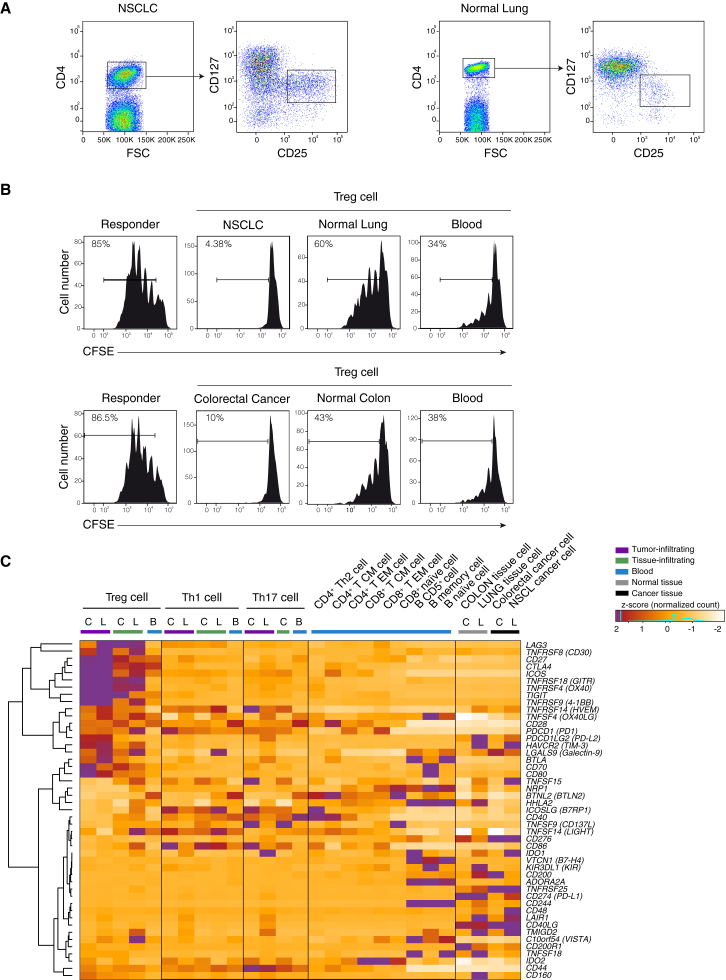
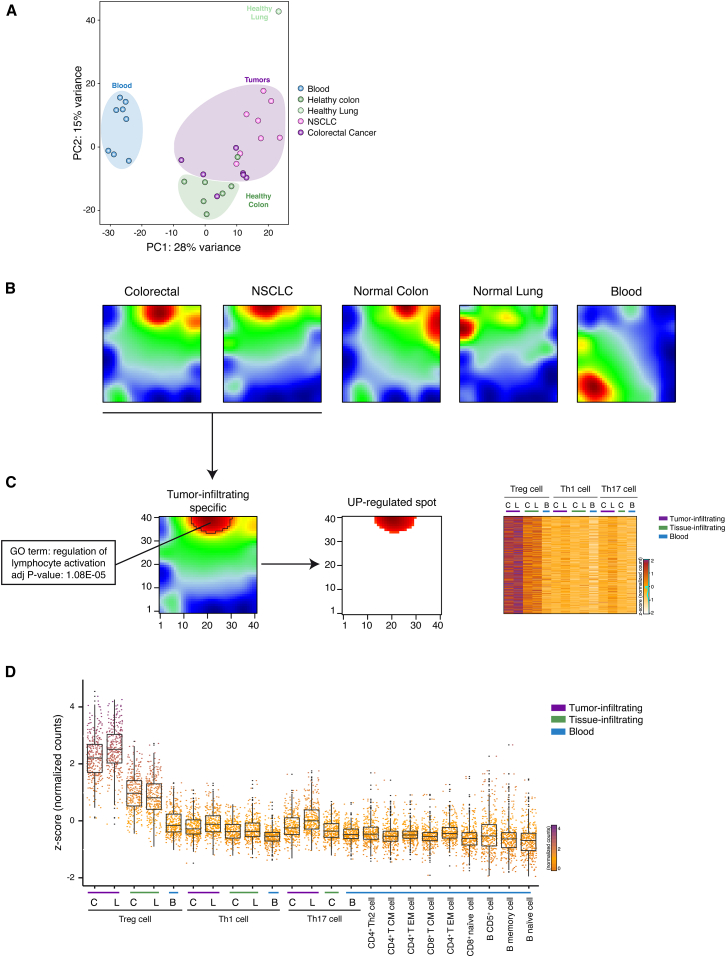
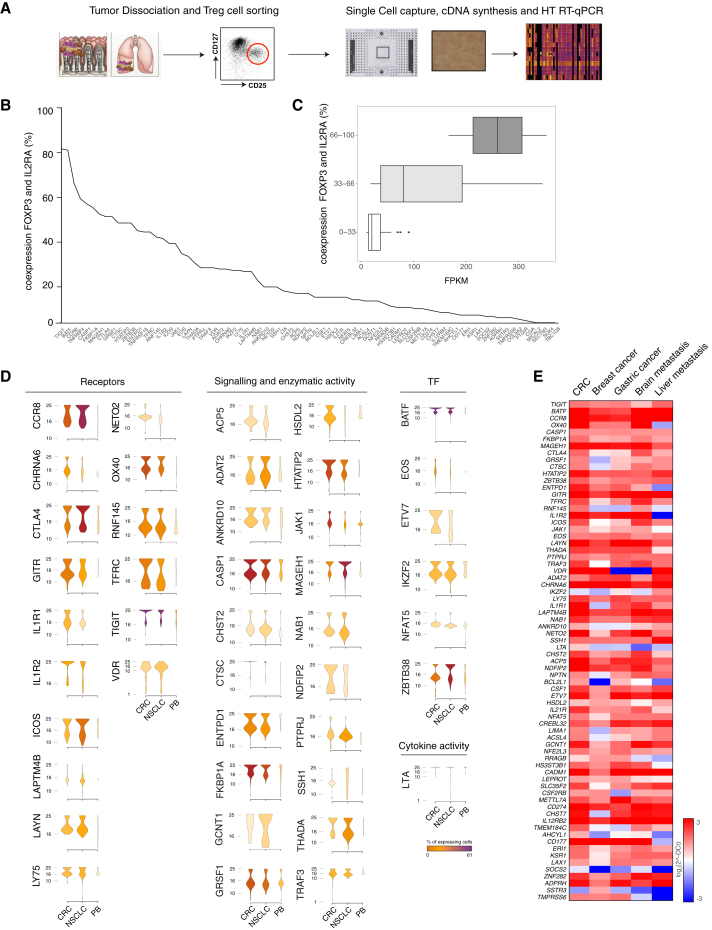
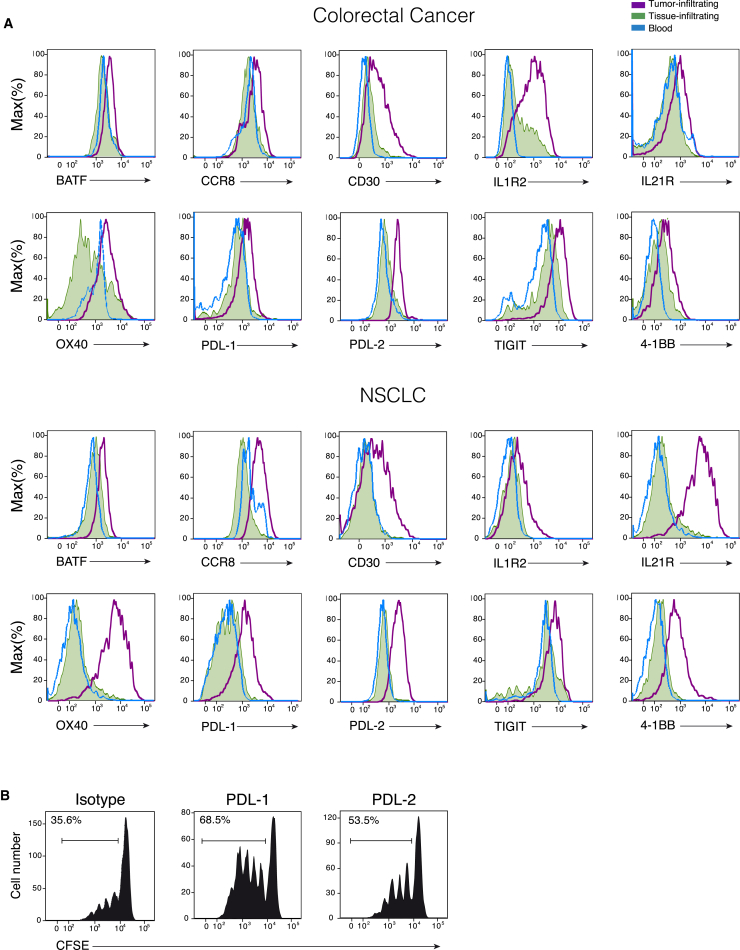
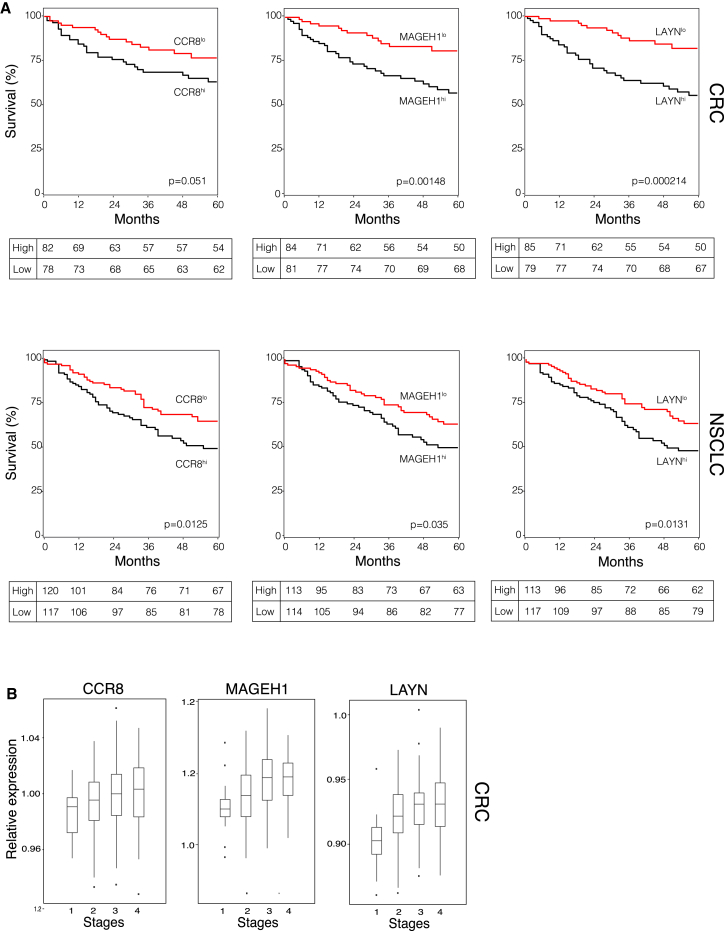
Tumor-infiltrating regulatory T lymphocytes (Treg) can suppress effector T cells specific for tumor antigens. Deeper molecular definitions of tumor-infiltrating-lymphocytes could thus offer therapeutic opportunities. Transcriptomes of T helper 1 (Th1), Th17, and Treg cells infiltrating colorectal or non-small-cell lung cancers were compared to transcriptomes of the same subsets from normal tissues and validated at the single-cell level. We found that tumor-infiltrating Treg cells were highly suppressive, upregulated several immune-checkpoints, and expressed on the cell surfaces specific signature molecules such as interleukin-1 receptor 2 (IL1R2), programmed death (PD)-1 Ligand1, PD-1 Ligand2, and CCR8 chemokine, which were not previously described on Treg cells. Remarkably, high expression in whole-tumor samples of Treg cell signature genes, such as LAYN, MAGEH1, or CCR8, correlated with poor prognosis. Our findings provide insights into the molecular identity and functions of human tumor-infiltrating Treg cells and define potential targets for tumor immunotherapy.


Figures

Figure 1
Figure 1
Purification, Functional Characterization, and Expression of Immune Checkpoints in Tumor Infiltrating Cells (A) Representation of the sorting strategy of Treg cells infiltrating tumor or normal tissue. (B) Representative flow cytometry plots showing suppressive activity of Treg cells isolated from tumor (NSCLC or CRC), normal tissue and blood of the same patient. 4 × 105 carboxyfluorescein diacetate succinimidyl ester (CFSE)-labeled CD4+ naive T cells from healthy donors were cocultured with an equal number of Treg cells for 4 days with a CD3-specific mAb and CD1c+CD11c+ dendritic cells. Percentage of proliferating cells is indicated. Data are representative of three independent experiments. (C) Z-score normalized RNA-seq expression values of immune checkpoints genes are represented as a heatmap. Cell populations are reported as a color code in the upper part of the graph, while gene names have been assigned to heatmap rows. Hierarchical clustering results are shown as a dendrogram drawn on the left side of the matrix. Colon tissues are indicated as C, lung tissues as L, and peripheral blood as B. See also Figure S1.
Figure 2
Figure 2
SOM Analysis Identifies Co-regulated Genes in Tumor Infiltrating Treg Cells (A) PCA has been performed on rlog-normalized (DESeq2) counts for all T regulatory cell RNA-seq samples (36 samples from 18 individuals). (B) Self-organizing maps analysis has been performed on the RNA-seq dataset comprising Treg, Th1, and Th17 cell subsets. Bidimensional SOM profiles are reported for Treg cells. (C) Group-centered analysis for the identification of upregulated spot (FDR < 0.1) in Treg cells infiltrating both NSCLC and CRC is described as 2D heatmap. Heatmap representing Z-score normalized expression values of genes selected from the upregulated spot is shown on the right side of the figure. Top enriched GO term (DAVID) for genes assigned to upregulated spot is reported with the corresponding significance p value. Colon tissues are indicated as C, lung tissues as L, and peripheral blood as B. (D) Z-score normalized expression values of genes that are preferentially expressed in tumor-infiltrating Treg cells (Wilcoxon Mann Whitney test p < 2.2 × 10–16) over the listed cell subsets are represented as boxed plots. Colon tissues are indicated as C, lung tissues as L, and peripheral blood as B. See also Figure S2.
Figure 3
Figure 3
Single Cell Analysis of Tumor Infiltrating Treg Cells (A) Schematic representation of the experimental workflow. Experiments were performed on Treg cells infiltrating CRC, NSCLC, or isolated from peripheral blood of healthy donors (PB); five samples were collected for each tissue. (B) Percentage of co-expression of signature genes with FOXP3 and IL2RA is depicted. (C) Expression levels of the signature genes classified by the percentage of co-expression are represented as boxplot. (D) Expression distribution (violin plots) in Treg cells infiltrating CRC, NSCLC, or PB. Plots representing the ontology classes of receptors, signaling and enzymatic activity, cytokine activity, and transcription factors are shown (Wilcoxon Mann Whitney test p < 0.05). Color gradient indicates the percentage of cells expressing each gene in Treg cells isolated from the three tissues. (E) Gene-expression analysis of tumor Treg signature genes in different tumor types. Expression values are expressed as log2 (2ˆ-DCt). See also Figure S3.
Figure 4
Figure 4
Expression of Tumor-Infiltrating Treg Cells Protein Signatures in CRC and NSCLC Samples (A) Representative flow cytometry plots for tumor (purple line) normal (green area) tissue infiltrating Treg cells and peripheral blood Treg cells (blue line) analyzed for the expression of the indicated proteins. (B) Flow cytometry plots representative of four independent experiments showing suppressive activity of CRC infiltrating Treg cells on proliferation (shown as CFSE dilution) of CD4+ effector T cells. First panel shows the inhibitory effect of Treg cells on the effector T cell proliferation in the presence of an isotype control antibody. The other panels show the inhibitory effect of Treg cells that have been preincubated with anti PD-L1 or PD-L2 antibodies. Percentage of proliferating cells are indicated. The calculated division index is 0.26 in the presence of the control antibody; 0.57 in the presence of anti-PDL-1 and 0.39 in the presence of anti-PDL-2. Data are representative of four independent experiments. See also Figure S4.
Figure 5
Figure 5
Prognostic Value of Signature Transcripts of Tumor Infiltrating Treg Cells (A) Kaplan-Meier survival curve comparing the high and low expression of the tumor Treg signature transcripts (CCR8, MAGEH1, LAYN) normalized to the CD3G for the CRC (n = 177) and NSCLC (n = 263) studies. Univariate analysis confirmed a significant difference in overall survival curve comparing patients with high and low expression. Statistical significance was determined by the log-rank test. (CRC: p = 0.05 for CCR8, p = 1.48 × 10−3 for MAGEH1, p = 2.1 × 10−4 for LAYN; NSCLC: p = 0.0125 for CCR8, p = 0.035 for MAGEH1, p = 0.0131 for LAYN.) Each table depicts the Kaplan-Meier estimates at the specified time points. (B) Expression distributions of CCR8, MAGEH1, and LAYN according to tumor staging at the time of surgery in the cohort of CRC patients. See also Figure S5.

Comment in

References

    1. Arpaia N., Green J.A., Moltedo B., Arvey A., Hemmers S., Yuan S., Treuting P.M., Rudensky A.Y. A Distinct Function of Regulatory T Cells in Tissue Protection. Cell. 2015;162:1078–1089. - PMC - PubMed
    1. Bindea G., Galon J., Mlecnik B. CluePedia Cytoscape plugin: pathway insights using integrated experimental and in silico data. Bioinformatics. 2013;29:661–663. - PMC - PubMed
    1. Bindea G., Mlecnik B., Tosolini M., Kirilovsky A., Waldner M., Obenauf A.C., Angell H., Fredriksen T., Lafontaine L., Berger A. Spatiotemporal dynamics of intratumoral immune cells reveal the immune landscape in human cancer. Immunity. 2013;39:782–795. - PubMed
    1. Borowsky M.L., Hynes R.O. Layilin, a novel talin-binding transmembrane protein homologous with C-type lectins, is localized in membrane ruffles. J. Cell Biol. 1998;143:429–442. - PMC - PubMed
    1. Boussiotis V.A., Chatterjee P., Li L. Biochemical signaling of PD-1 on T cells and its functional implications. Cancer J. 2014;20:265–271. - PMC - PubMed

Publication types

MeSH terms