. 2016 Nov 15;45(5):1162-1175.
doi: 10.1016/j.immuni.2016.10.025.

Systematic Analysis of Cell-to-Cell Expression Variation of T Lymphocytes in a Human Cohort Identifies Aging and Genetic Associations

Affiliations

Systematic Analysis of Cell-to-Cell Expression Variation of T Lymphocytes in a Human Cohort Identifies Aging and Genetic Associations

Yong Lu et al. Immunity. .

Abstract

Cell-to-cell expression variation (CEV) is a prevalent feature of even well-defined cell populations, but its functions, particularly at the organismal level, are not well understood. Using single-cell data obtained via high-dimensional flow cytometry of T cells as a model, we introduce an analysis framework for quantifying CEV in primary cell populations and studying its functional associations in human cohorts. Analyses of 840 CEV phenotypes spanning multiple baseline measurements of 14 proteins in 28 T cell subpopulations suggest that the quantitative extent of CEV can exhibit substantial subject-to-subject differences and yet remain stable within healthy individuals over months. We linked CEV to age and disease-associated genetic polymorphisms, thus implicating CEV as a biomarker of aging and disease susceptibility and suggesting that it might play an important role in health and disease. Our dataset, interactive figures, and software for computing CEV with flow cytometry data provide a resource for exploring CEV functions.


Figures

Figure 1.
Figure 1.. Quantification of Cell-to-Cell Variation in Protein or Gene Expression within a Cell Population
For a Figure360 author presentation of Figure 1, see http://dx.doi.org/10.1016/j.immuni.2016.10.025#mmc6. (A) The level of protein X varies from cell to cell in the depicted cell population, and its distribution among cells is shown; the degree of this variability (illustrated by the orange bar) can be quantified by metrics such as standard deviation (SD) and median absolute deviation (MAD). (B) Data are similar to those in (A), but an example of “discrete” heterogeneity is shown instead of “continuous” heterogeneity; here, the distribution of expression levels is bimodal with two clusters of cells. (C) A heterogeneity parameter (HP) is defined as a combination of a variance metric applied to quantify the CEV of a protein (or gene) in a cell population. Some HP examples from this study are listed. (D) Our analysis framework and workflow. PBMC samples were collected at multiple time points from healthy human subjects as part of an influenza vaccination study. Individual PBMC samples were assayed with a 15-color flow cytometry panel designed for T cell phenotyping; the relative protein expression levels (based on fluorescence intensity) at the single-cell level were then extracted. To assess CEV within individual samples (each sample corresponds to one subject at one time point), we generated an “HP profile” by (1) manually gating cell subsets, resulting in 28 T cell subsets; (2) assembling a single-cell expression profile consisting of all measured proteins (except for the viability marker) for each cell subset; (3) computing HPs (see Supplemental Notations and Supplemental Definitions in the Supplemental Experimental Procedures) for each protein, cell-subset, and variance-metric combination; (4) assembling HPs across all proteins and cell subsets in a sample into a cell subset by protein matrix for downstream analyses; (5) assessing each HP for its degree of variability across baseline time points within individual subjects (“intra-subject”) and across subjects (“inter-subject”) after generating HP profiles for all samples; and (6) identifying and analyzing HPs deemed stable over the three baseline time points (7 days before, immediately before, and 70 days after vaccination; see Experimental Procedures) within individual subjects for potential association with other phenotypic parameters and genotypes in the cohort.
Figure 2.
Figure 2.. The HP Profile of a Representative 23-Year-Old Female Subject
(A) HPs capturing the CEV of 14 proteins in 28 T cell subsets. Because HPs can be correlated with the mean expression level of the protein in the cell subset, for visualization purposes, here a “mean-independent” version of the HPs is shown (see Supplemental Experimental Procedures). The rows are arranged according to the gating hierarchy. Heatmaps for other subjects can be viewed in our web-based iFigures (iFigure 3). (B–D) HP examples illustrating the nature of CEV across cell subsets. (B) The expression variation of CD38 in CD8+CD25+ cells can be partially attributed to the presence of discrete clusters of cells, as evidenced by the multi-modal distribution of CD38 expression among the cells. (C and D) The CEV of the same protein in CD4+ T cells (C) and CCR7 cells of the total memory CD4+ T cells (D) were lower than the example in (B), and they exhibited continuous differences in CD38 expression level among cells without apparent discrete clusters.
Figure 3.
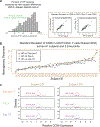
Figure 3.. 70% of HPs Assessed Are Deemed Temporally Stable across Three Baseline Time Points Spanning More Than 2 Months
(A) The histogram of the “within-subject stability scores,” i.e., percentage of variance of an HP explained by inter-subject variations, is shown for all of the HPs we assessed. Scatterplots of an example of a temporally stable HP (the SD of CD38 expression in CD4+CD27+ cells) show that the HP was highly correlated across time points. Multiple criteria were used for determining whether an HP was “stable”; the minimum cutoff required (>50%) for the percentage of HP variance explained by subject-to-subject differences is indicated (see main text and Experimental Procedures). (B) The same HP (y axis) in each of the 61 subjects (x axis) is shown for all three baseline time points. The subjects are sorted in ascending order (from left to right) according to the average value of the HP across the three time points. The HPs were very similar across time points within individuals but varied substantially more across subjects. (C) Single-cell distributions of CD38 expression in the same cell subset from two representative subjects. The length of the bar beneath the density indicates the SD. The distributions remained largely unchanged across the baseline time points within each subject, whereas the spread of the distribution was consistently lower in subject 257 than in subject 235.
Figure 4.
Figure 4.. An Age-Associated, “Discrete” HP Involving CCR7 Expression Variation in Treg Cells
(A) A scatterplot showing the SD of CD197 (CCR7) expression in CD4+CD25+ T cells (Treg cells) (y axis) against age (x axis). To help visualize the association detected by our model, we show a version of the HP (the “partial residual”) after contributions from covariates were accounted for (the values shown correspond to the partial residuals from the fitted mixed-effect model averaged over three baseline time points; see Supplemental Experimental Procedures). See also iFigure 4, where a “raw” value version (instead of the partial residual) of this scatterplot can be viewed. (B) Distribution of CCR7 expression across cells in the CD4+CD25+ subset is shown for three example subjects spanning the age range. The variation in CEV across subjects can be partially attributed to differences in the frequency of discrete cell clusters: older subjects tended to have a higher fraction of cells with lower CCR7 expression. (C–E) Assessing CCR7 CEV together with FOXP3. Dot plots comparing FOXP3 and CCR7 expression in single cells are shown for subjects 204 (C), 251 (D), and 212 (E). Contour lines (yellow) indicate cell density in the dot plots.
Figure 5.
Figure 5.. An Age-Associated, “Continuous” HP Involving CD38 Expression Variation in Naive CD4+ T Cells
(A) As in Figure 4A, a scatterplot shows the partial residual of the SD of CD38 expression in CD4+CD27+ naive cells (y axis) against age (x axis). Distributions of CD38 expression from example subjects spanning the age range are shown as in Figure 4B. See also iFigure 4, where a “raw” value version (instead of the partial residual) of this scatterplot can be viewed. (B) Partial residual of the HP (y axis) is plotted against the mean expression of CD38 (x axis). Subjects are colored according to age (see also Figure S3C).
Figure 6.
Figure 6.. Two Examples of HPs Associated with SNPs Linked to Disease Susceptibility
(A) The SD of HLA-DR expression in CD8+T cells (y axis) from day 0 is plotted against the number of the minor, disease-protective allele of SNP rs1588265 (x axis). The partial residual of HP is shown as in Figure 4A to account for covariates (see Supplemental Experimental Procedures). See also iFigure 5 for plots showing data from other time points; a “raw” value version (instead of the partial residual) of this plot can also be viewed. (B) Distribution of HLA-DR expression in CD8+ T cells is shown for example subjects with two, one, or zero copies (top to bottom) of the minor allele. (C) Scatterplot showing HP (the partial residual) against mean expression; subjects are colored by genotype (see also Figure S5B). (D) Data are similar to those in (A), but the SD of CD38 heterogeneity in CD4+CD45RA+T cells (ID34) (the partial residual) is shown against the number of the minor, protective allele at SNP rs1588265. (E) Data are similar to those in (B): the distribution of CD38 expression among cells in cell subset ID34 is shown for subjects with 2, 1, or 0 copies (top to bottom) of the minor allele. (F) Data are similar to those in (C), but CD38 in CD4+CD45RA+ T cells (ID34) is shown (see also Figure S6B).

Comment in

References

    1. Acar M, Mettetal JT, and van Oudenaarden A (2008). Stochastic switching as a survival strategy in fluctuating environments. Nat. Genet 40, 471–475. - PubMed
    1. Agius E, Lacy KE, Vukmanovic-Stejic M, Jagger AL, Papageorgiou A-P, Hall S, Reed JR, Curnow SJ, Fuentes-Duculan J, Buckley CD, et al. (2009). Decreased TNF-α synthesis by macrophages restricts cutaneous immunosurveillance by memory CD4+ T cells during aging. J. Exp. Med 206, 1929–1940. - PMC - PubMed
    1. Altschuler SJ, and Wu LF (2010). Cellular heterogeneity: do differences make a difference? Cell 141, 559–563. - PMC - PubMed
    1. Ansel J, Bottin H, Rodriguez-Beltran C, Damon C, Nagarajan M, Fehrmann S, François J, and Yvert G (2008). Cell-to-cell stochastic variation in gene expression is a complex genetic trait. PLoS Genet 4, e1000049. - PMC - PubMed
    1. Antebi YE, Reich-Zeliger S, Hart Y, Mayo A, Eizenberg I, Rimer J, Putheti P, Pe’er D, and Friedman N (2013). Mapping differentiation under mixed culture conditions reveals a tunable continuum of T cell fates. PLoS Biol. 11, e1001616. - PMC - PubMed

Publication types