. 2016 Nov 15;111(10):2190-2201.
doi: 10.1016/j.bpj.2016.09.043.

Experimental Estimation of Membrane Tension Induced by Osmotic Pressure

Affiliations

Experimental Estimation of Membrane Tension Induced by Osmotic Pressure

Sayed Ul Alam Shibly et al. Biophys J. .

Erratum in

Abstract

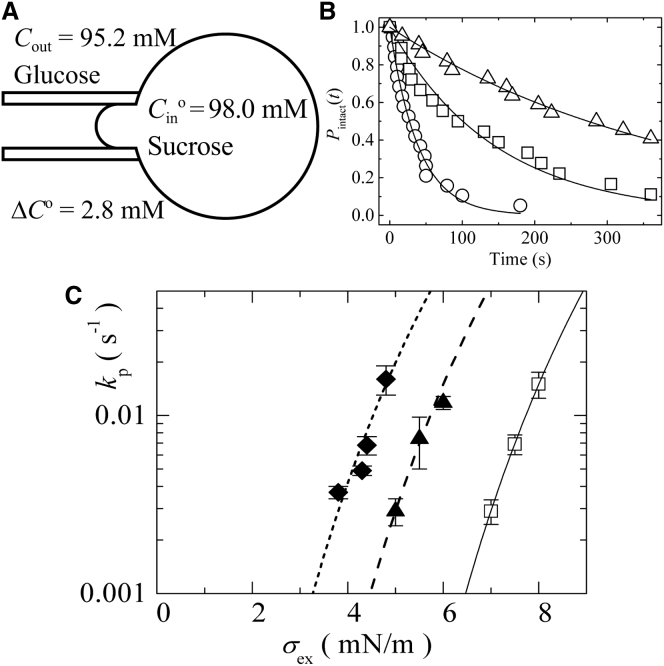
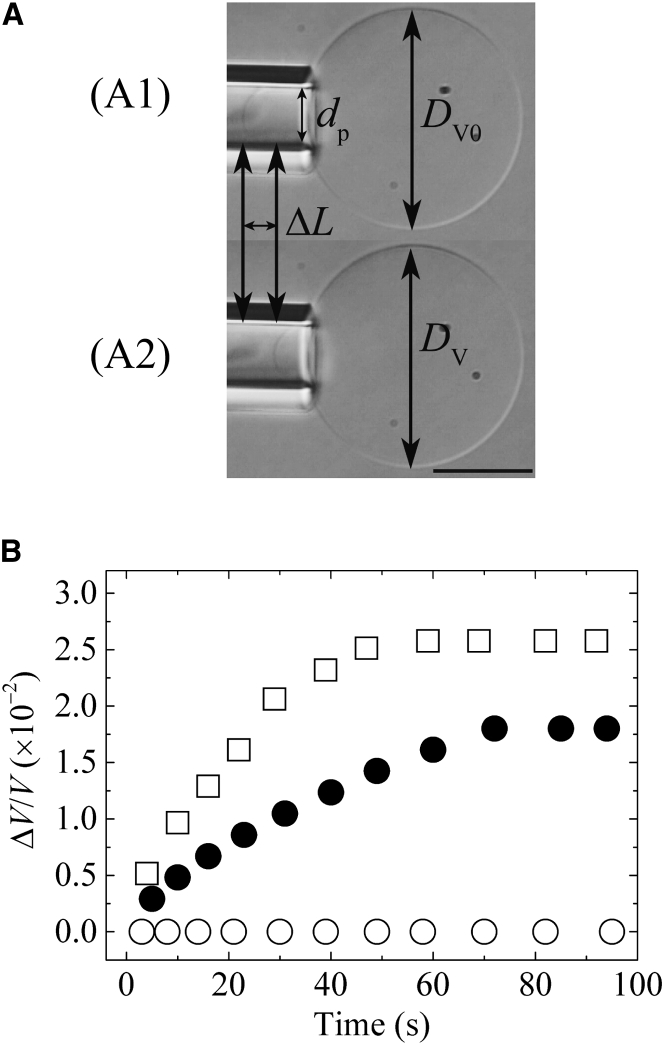
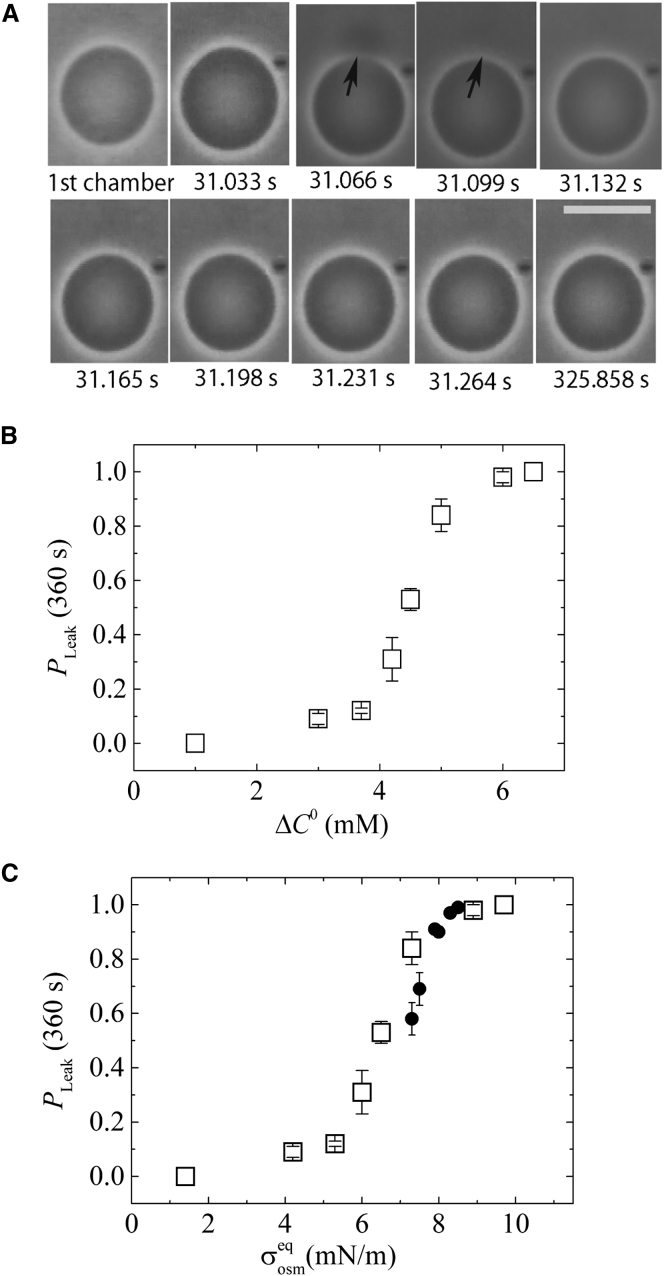
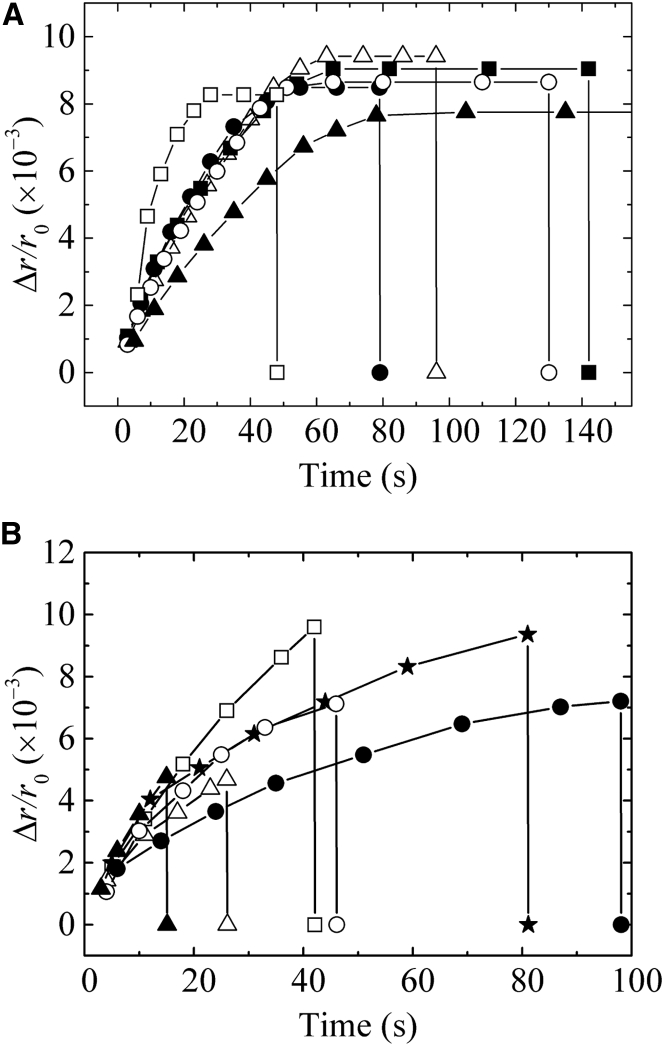
Osmotic pressure (Π) induces the stretching of plasma membranes of cells or lipid membranes of vesicles, which plays various roles in physiological functions. However, there have been no experimental estimations of the membrane tension of vesicles upon exposure to Π. In this report, we estimated experimentally the lateral tension of the membranes of giant unilamellar vesicles (GUVs) when they were transferred into a hypotonic solution. First, we investigated the effect of Π on the rate constant, kp, of constant-tension (σex)-induced rupture of dioleoylphosphatidylcholine (DOPC)-GUVs using the method developed by us recently. We obtained the σex dependence of kp in GUVs under Π and by comparing this result with that in the absence of Π, we estimated the tension of the membrane due to Π at the swelling equilibrium, σosmeq. Next, we measured the volume change of DOPC-GUVs under small Π. The experimentally obtained values of σosmeq and the volume change agreed with their theoretical values within the limits of the experimental errors. Finally, we investigated the characteristics of the Π-induced pore formation in GUVs. The σosmeq corresponding to the threshold Π at which pore formation is induced is similar to the threshold tension of the σex-induced rupture. The time course of the radius change of GUVs in the Π-induced pore formation depends on the total membrane tension, σt; for small σt, the radius increased with time to an equilibrium one, which remained constant for a long time until pore formation, but for large σt, the radius increased with time and pore formation occurred before the swelling equilibrium was reached. Based on these results, we discussed the σosmeq and the Π-induced pore formation in lipid membranes.


Figures

Figure 1
Figure 1
Effect of Π on constant-tension-induced rupture of DOPC-GUVs. (A) A scheme of the measurement for ΔC0 = Cin0Cout = 2.8 mM, where Cin0 is the initial sucrose concentration inside a GUV and Cout is the glucose concentration on the outside of the GUV. (B) Time course of the fraction of intact DOPC-GUVs without rupture among all of the examined GUVs, Pintact(t), in the presence of Π due to ΔC0 = 2.8 mM and tension due to the micropipette aspiration: σex = 3.3 mN/m (open triangles), 3.8 mN/m (open squares), and 4.3 mN/m (open circles). The number of single GUVs examined was 18−22 in each experiment. The solid lines represent the best-fit curves of Eq. 8. (C) Dependence of kp on external tension for ΔC0 = 1.9 mM (solid triangle), ΔC0 = 2.8 mM (solid rhombus), and ΔC0 = 0 mM (open squares) (i.e., no osmotic pressure). Error bars show standard errors. The solid lines show the best fits in accordance with the theoretical curves corresponding to Eq. 9 using Γ = 10.5 pN and Dr = 165 nm2/s. The data for ΔC0 = 0.0 mM (open squares) and its fitting curve are reprinted from (27) with permission from the American Chemical Society. The dashed line and the dotted line correspond to the theoretical Eq. 9 using σt = σex + 2.6 mN/m and σt = σex + 3.8 mN/m, respectively.
Figure 2
Figure 2
Increase in volume of DOPC-GUV induced by Π. (A1) A DIC image of a GUV held at the tip of a micropipette using a small aspiration pressure in chamber A, which contained an isotonic solution. (A2) A DIC image of a GUV held at the tip of a micropipette after the GUV was transferred into another chamber, chamber B, containing a hypotonic solution. dp is the internal diameter of the micropipette and ΔL is the change of the projection length. The bar corresponds to 10 μm. (B) Time course of volume change of a GUV after it was transferred into chamber B, which contained 96.0 mM (i.e., ΔC0 = 2.0 mM; solid circles), 95.0 mM (i.e., ΔC0 = 3.0 mM; open squares), and 98.0 mM (i.e., ΔC0 = 0.0 mM, open circles) glucose solutions.
Figure 3
Figure 3
Large Π-induced pore formation in DOPC-GUVs. (A) Phase-contrast microscopic images of a GUV after it was transferred into chamber B, which contained 90.0 mM glucose solution (i.e., ΔC0 = 8.0 mM). The numbers below each image show the time in seconds after the transfer of the GUV into chamber B. Scale bar, 25 μm. The arrows show a rapid, transient leakage of sucrose from the DOPC-GUV. (B) The fraction of GUV where a transient leakage occurred during the first 6 min, PLeak (360 s), as a function of ΔC0. Mean values and standard errors of PLeak (360 s) for each ΔC0 were determined among three independent experiments using 10−15 GUVs for each experiment. Error bars show standard errors. (C) PLeak (360 s) as a function of membrane tension due to Π at equilibrium, σosmeq=σt (open squares). ΔC0 values in (B) were converted into σosmeq. For comparison, the data in Fig. 1 were added (solid circles); the values of the fraction of ruptured GUVs during the first 6 min among all the examined GUVs, Ppore (360 s), were obtained for the theoretical values of σt=σex+σosmeq for each condition of the experiments of Fig. 1.
Figure 4
Figure 4
The time courses of the fractional change of radius of a GUV, Δr/r0, under Π and σex. The curves represent the Δr/r0 results for several GUVs for (A) ΔC0 = 3.0 mM and σex = 4.0 mN/m and (B) ΔC0 = 4.0 mM and σex = 5.0 mN/m.
Figure 5
Figure 5
Dependence of the free-energy profile of a prepore in a DOPC-GUV on its radius for various tensions due to Π, σosmeq: (A) 9.0, (B) 7.0, (C) 5.0, and (D) 3.0 mN/m. U(r) is calculated according to Eq. 10 using Γ = 10.5 pN.

Similar articles

Cited by

References

    1. Sperelakis N., editor. Cell Physiology Source Book, 4th ed. Essentials of membrane biophysics. Academic press; London: 2012.
    1. Sachs F. Stretch-activated ion channels: what are they? Physiology (Bethesda) 2010;25:50–56. - PMC - PubMed
    1. Sukharev S.I., Blount P., Kung C. A large-conductance mechanosensitive channel in E. coli encoded by mscL alone. Nature. 1994;368:265–268. - PubMed
    1. Levina N., Tötemeyer S., Booth I.R. Protection of Escherichia coli cells against extreme turgor by activation of MscS and MscL mechanosensitive channels: identification of genes required for MscS activity. EMBO J. 1999;18:1730–1737. - PMC - PubMed
    1. Taupin C., Dvolaitzky M., Sauterey C. Osmotic pressure induced pores in phospholipid vesicles. Biochemistry. 1975;14:4771–4775. - PubMed