Distinct Trends of DNA Methylation Patterning in the Innate and Adaptive Immune Systems
- PMID: 27851971
- PMCID: PMC5889099
- DOI: 10.1016/j.celrep.2016.10.054
Distinct Trends of DNA Methylation Patterning in the Innate and Adaptive Immune Systems
Abstract
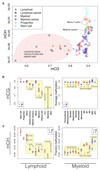
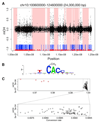
DNA methylation and the localization and post-translational modification of nucleosomes are interdependent factors that contribute to the generation of distinct phenotypes from genetically identical cells. With 112 whole-genome bisulfite sequencing datasets from the BLUEPRINT Epigenome Project, we analyzed the global development of DNA methylation patterns during lineage commitment and maturation of a range of immune system effector cells and the cancers that arise from them. We show clear trends in methylation patterns that are distinct in the innate and adaptive arms of the human immune system, both globally and in relation to consistently positioned nucleosomes. Most notable are a progressive loss of methylation in developing lymphocytes and the consistent occurrence of non-CG methylation in specific cell types. Cancer samples from the two lineages are further polarized, suggesting the involvement of distinct lineage-specific epigenetic mechanisms. We anticipate broad utility for this resource as a basis for further comparative epigenetic analyses.
Keywords: BLUEPRINT; CTCF; DNA methylation; epigenetics; hematopoiesis; nucleosomes; whole-genome bisulfite sequencing.
Copyright © 2016 The Authors. Published by Elsevier Inc. All rights reserved.
Figures


Similar articles
-
Epigenetics and the adaptive immune response.Mol Aspects Med. 2013 Jul-Aug;34(4):813-25. doi: 10.1016/j.mam.2012.06.008. Epub 2012 Jul 10. Mol Aspects Med. 2013. PMID: 22789989 Free PMC article. Review.
-
Guanine quadruplex DNA structure restricts methylation of CpG dinucleotides genome-wide.Mol Biosyst. 2010 Dec;6(12):2439-47. doi: 10.1039/c0mb00009d. Epub 2010 Sep 29. Mol Biosyst. 2010. PMID: 20877913
-
The DNA methylation profile of activated human natural killer cells.Epigenetics. 2016 May 3;11(5):363-80. doi: 10.1080/15592294.2016.1163454. Epub 2016 Mar 11. Epigenetics. 2016. PMID: 26967308 Free PMC article.
-
Relationship between nucleosome positioning and DNA methylation.Nature. 2010 Jul 15;466(7304):388-92. doi: 10.1038/nature09147. Epub 2010 May 30. Nature. 2010. PMID: 20512117 Free PMC article.
-
Transcriptional regulation of innate and adaptive lymphocyte lineages.Annu Rev Immunol. 2015;33:607-42. doi: 10.1146/annurev-immunol-032414-112032. Epub 2015 Feb 4. Annu Rev Immunol. 2015. PMID: 25665079 Review.
Cited by
-
Immune-related gene methylation prognostic instrument for stratification and targeted treatment of ovarian cancer patients toward advanced 3PM approach.EPMA J. 2024 Apr 27;15(2):375-404. doi: 10.1007/s13167-024-00359-3. eCollection 2024 Jun. EPMA J. 2024. PMID: 38841623 Free PMC article.
-
Epigenetics in modulating immune functions of stromal and immune cells in the tumor microenvironment.Cell Mol Immunol. 2020 Sep;17(9):940-953. doi: 10.1038/s41423-020-0505-9. Epub 2020 Jul 22. Cell Mol Immunol. 2020. PMID: 32699350 Free PMC article. Review.
-
Epigenetics of Bladder Cancer: Where Biomarkers and Therapeutic Targets Meet.Front Genet. 2019 Nov 18;10:1125. doi: 10.3389/fgene.2019.01125. eCollection 2019. Front Genet. 2019. PMID: 31850055 Free PMC article. Review.
-
DNA methylation as a transcriptional regulator of the immune system.Transl Res. 2019 Feb;204:1-18. doi: 10.1016/j.trsl.2018.08.001. Epub 2018 Aug 9. Transl Res. 2019. PMID: 30170004 Free PMC article. Review.
-
Epigenetic remodeling of the immune landscape in cancer: therapeutic hurdles and opportunities.J Biomed Sci. 2023 Jan 10;30(1):3. doi: 10.1186/s12929-022-00893-0. J Biomed Sci. 2023. PMID: 36627707 Free PMC article. Review.
References
-
- Benjamini Y, Yekutieli D. The control of the false discovery rate in multiple testing under dependency. Ann Stat. 2001;29:1165–1188.
-
- Booth MJ, Branco MR, Ficz G, Oxley D, Krueger F, Reik W, Balasubramanian S. Quantitative sequencing of 5-methylcytosine and 5-hydroxymethylcytosine at single-base resolution. Science. 2012;336:934–937. - PubMed
-
- Bröske AM, Vockentanz L, Kharazi S, Huska MR, Mancini E, Scheller M, Kuhl C, Enns A, Prinz M, Jaenisch R, et al. DNA methylation protects hematopoietic stem cell multipotency from myeloerythroid restriction. Nat Genet. 2009;41:1207–1215. - PubMed
-
- Cedar H, Bergman Y. Epigenetics of haematopoietic cell development. Nat Rev Immunol. 2011;11:478–488. - PubMed
Publication types
MeSH terms
Substances
Grants and funding
LinkOut - more resources
Full Text Sources
Other Literature Sources

