. 2017 Jan 3;8(1):315-328.
doi: 10.18632/oncotarget.13324.

Epigenetic silencing of TET2 and TET3 induces an EMT-like process in melanoma

Affiliations

Epigenetic silencing of TET2 and TET3 induces an EMT-like process in melanoma

Fuxing Gong et al. Oncotarget. .

Abstract

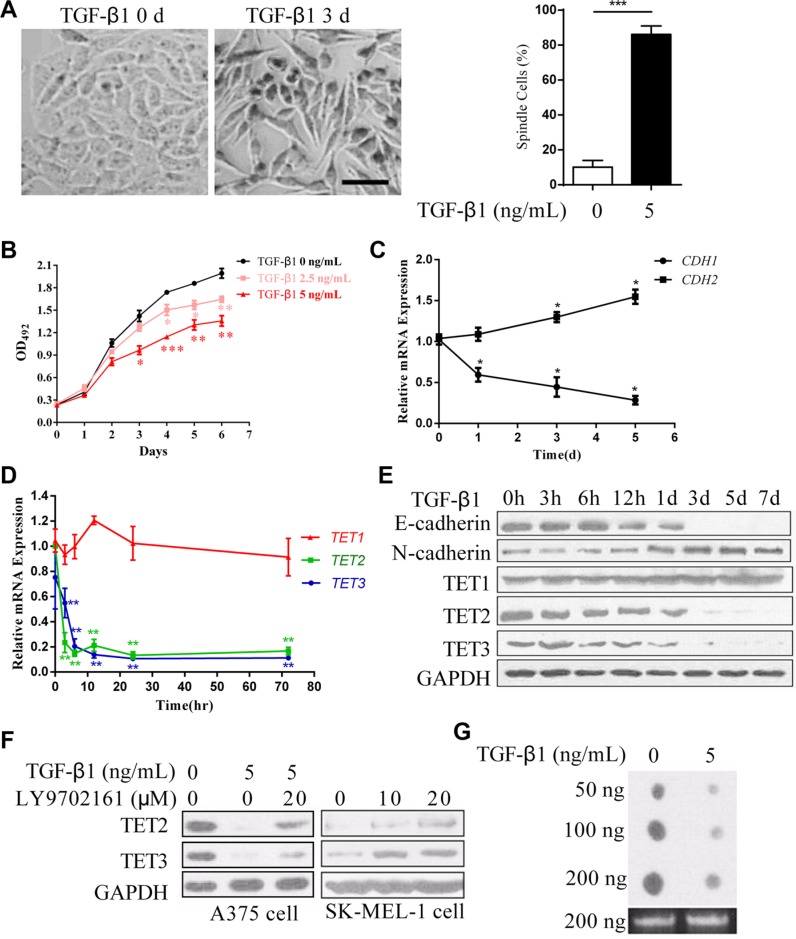
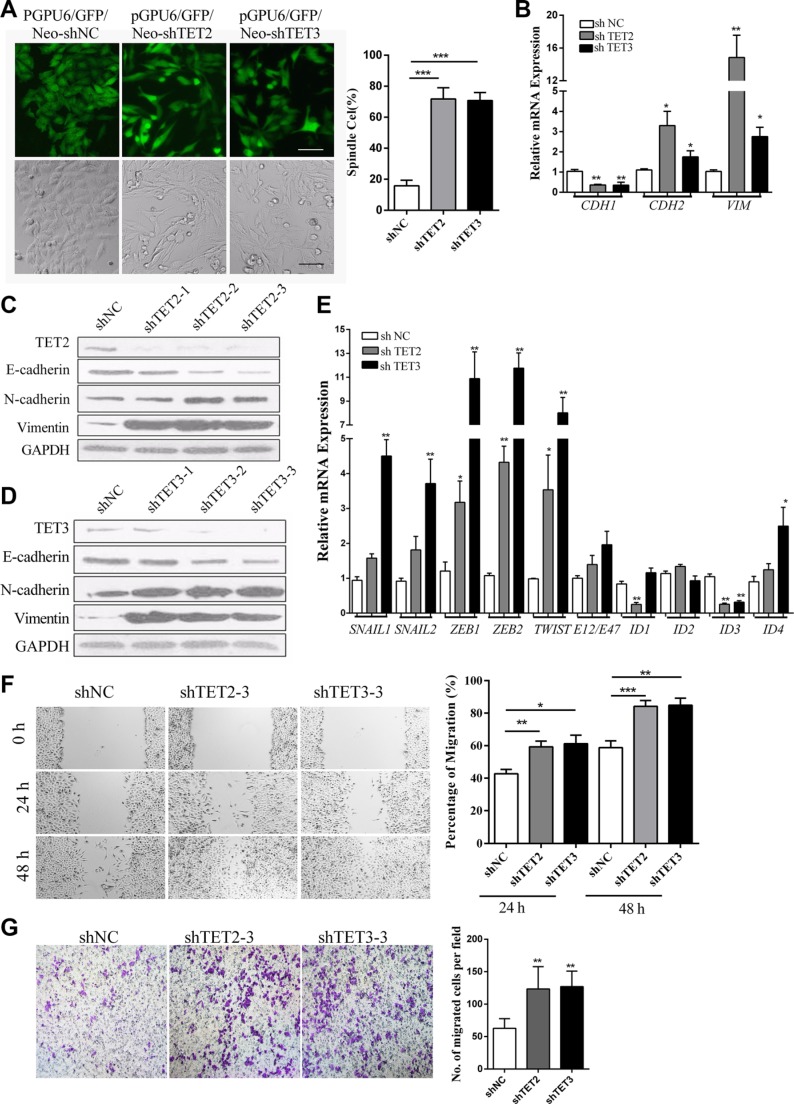
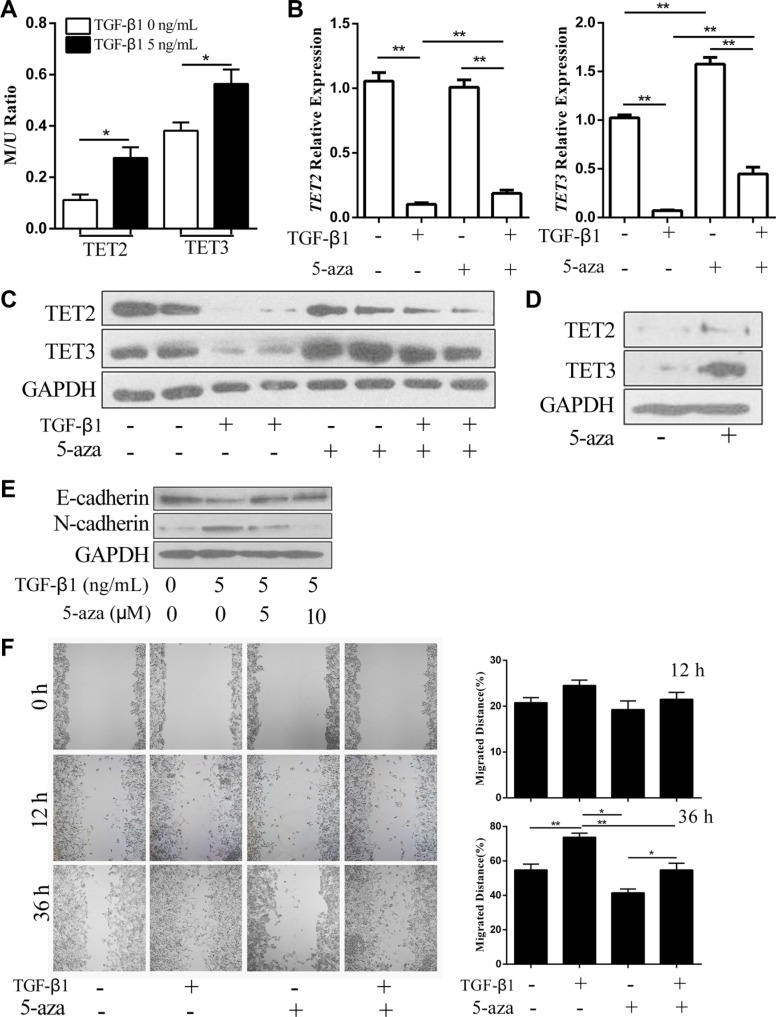
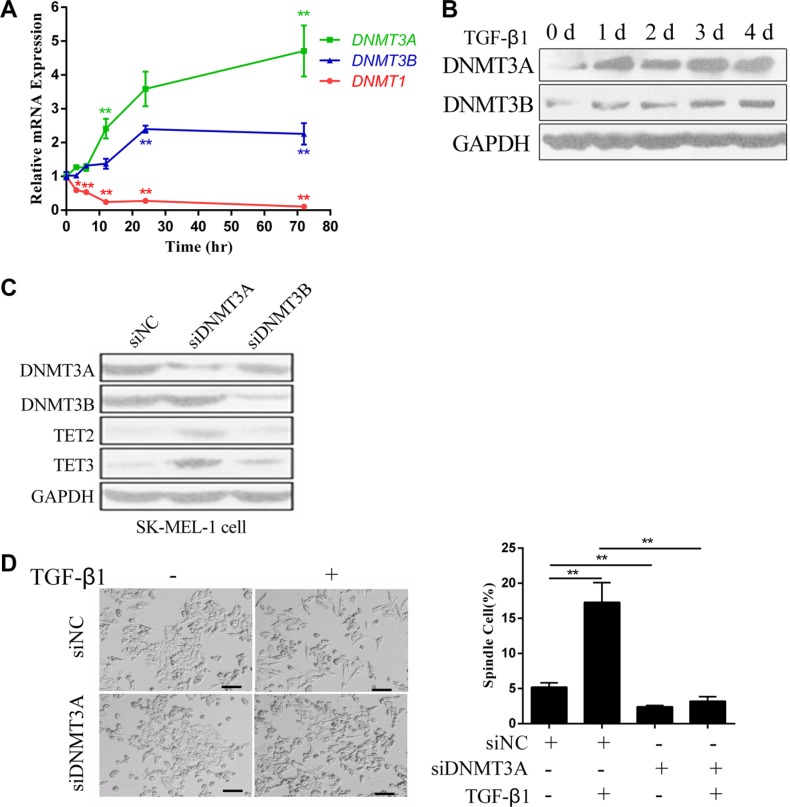
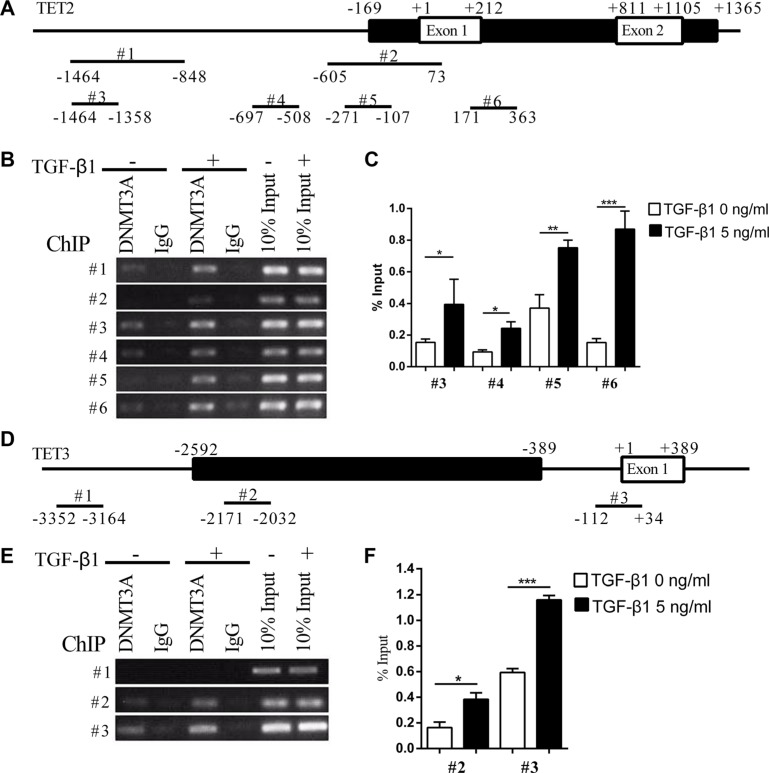
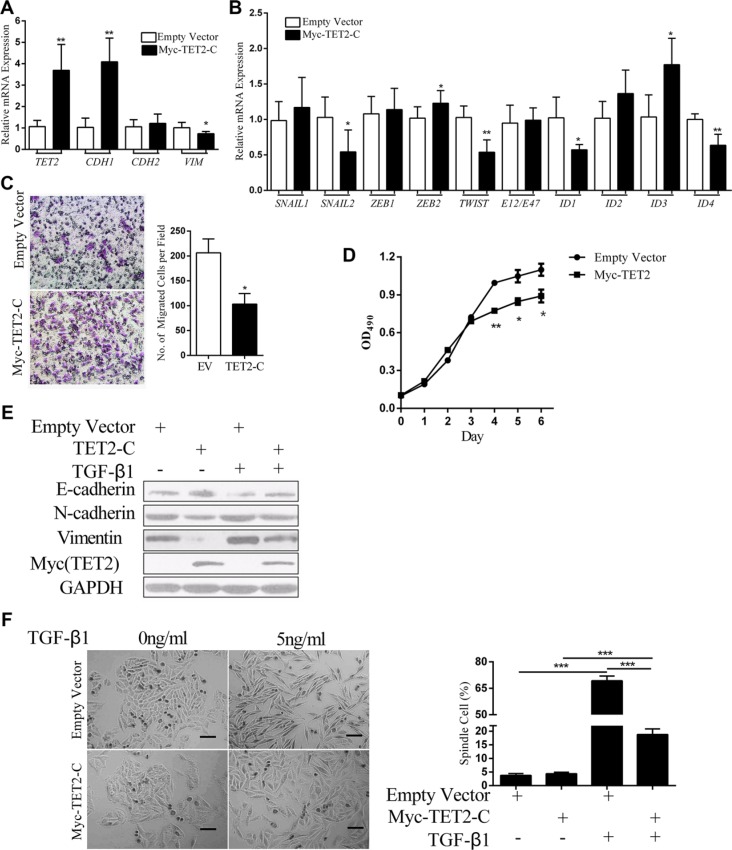
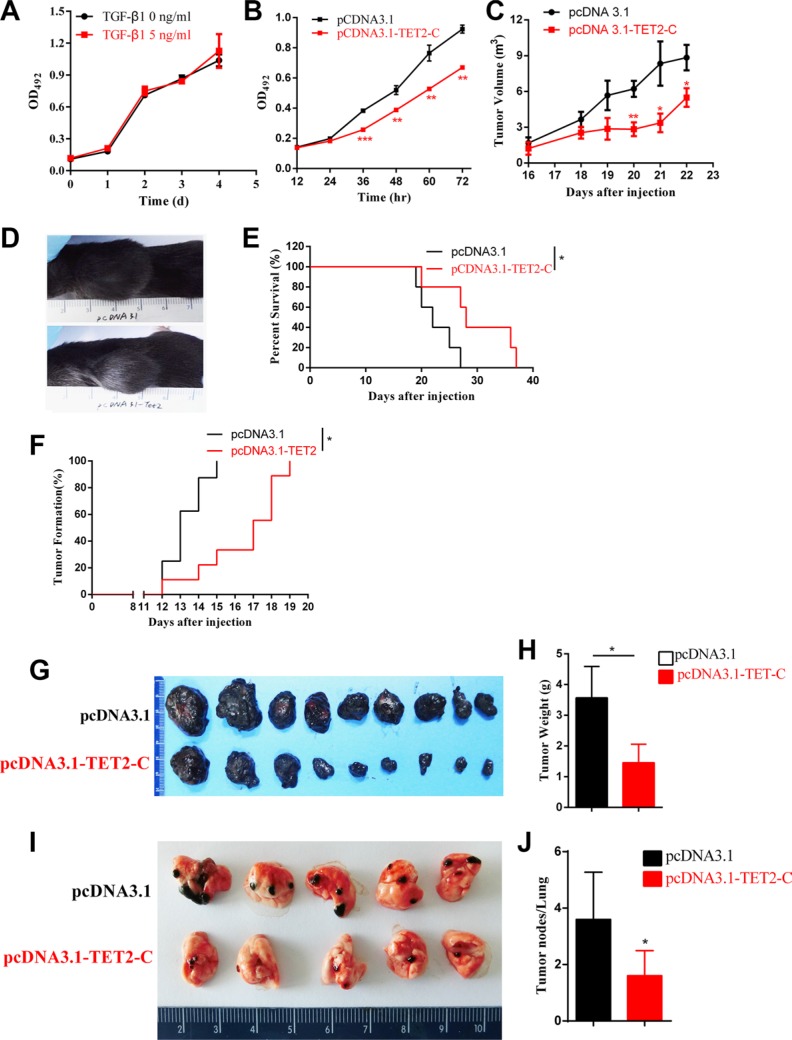
Epithelial-Mesenchymal Transition (EMT) is a critical step in the progression of cancer. Malignant melanoma, a cancer developed from pigmented melanocytes, metastasizes through an EMT-like process. Ten-eleven translocation (TET) enzymes, catalyzing the conversion of 5-methylcytosine (5mC) to 5-hydroxylmethylcytosine (5-hmC), are down regulated in melanoma. However, their roles in the progression and the EMT-like process of melanoma are not fully understood. Here we report that DNA methylation induced silencing of TET2 and TET3 are responsible for the EMT-like process and the metastasis of melanoma. TET2 and TET3 are down regulated in the TGF-β1-induced EMT-like process, and the knocking down of TET2 or TET3 induced this EMT-like process. A DNA demethylating agent antagonized the TGF-β-induced suppression of TET2 and TET3. Furthermore, a ChIP analysis indicated that enhanced recruitment of DNMT3A (DNA Methyltransferase 3A) is the mechanism by which TGF-β induces the silencing of TET2 and TET3. Finally, the overexpression of the TET2 C-terminal sequence partially rescues the TGF-β1-induced EMT-like process in vitro and inhibits tumor growth and metastasis in vivo. Hence, our data suggest an epigenetic circuitry that mediates the EMT activated by TGF-β. As an effector, DNMT3A senses the TGF-β signal and silences TET2 and TET3 promoters to induce the EMT-like process and metastasis in melanoma.

Keywords: DNMT3A; EMT; Melanoma; TET; TGF-β.


Conflict of interest statement

CONFLICTS OF INTEREST

All the authors claim here that there is no potential conflicts of interests.

Figures

Figure 1
Figure 1. Down regulation of TET2 and TET3 in the TGF-β1-induced EMT-like process in A375 cells
(A) Representative morphologic changes of A375 cells cultured with or without TGF-β1 (5 ng/ml) for 3 days were shown on the left, Scale bar = 50 μm, the percentage of spindle cells were shown on the right; (B) The effect of TGF-β1 on cell growth was evaluated by measuring the absorbance of OD492 after staining with MTT; (C) and (D) Real-time RT-PCR analysis of the relative expression levels of CDH1, CDH2 and TET1/2/3 mRNAs in A375 cells stimulated with 5 ng/ml TGF-β1 for the indicated times. The data are displayed as the fold change in the expression levels in untreated cells; the levels were normalized to those of GAPDH, and the error bars represent the mean ± SD of triplicate experiments (Student's t-test, *p < 0.05, **p < 0.01); (E) Expression of E-cadherin, N-cadherin and TET1/2/3 in A375 cells cultured with 5 ng/ml TGF-β1 for the indicated times was examined by immunoblotting. GAPDH was used to show that equal amounts of proteins were loaded on the gel; (F) Immunoblotting analysis of endogenous TET2 and TET3 expression levels in A375 cells and SK-MEL-1 cells that were treated with vehicle (0), the TGF-β type I receptor inhibitor LY9702161 or that were stimulated with TGF-β1 for 3 days, GAPDH was used to show that equal amounts of proteins were loaded on the gel; (G) The 5hmC levels of the genome of the cells treated with or without TGF-β were detected by dot-blotting.
Figure 2
Figure 2. Knock down of TET2 or TET3 induces an EMT-like Process
(A) Morphological changes in A375 cells induced by the shRNA-mediated knock down of TET2 or TET3 were observed by optical microscopy and fluorescence microscopy, the cells that were transfected with shRNAs carrying GFP-coding genes were selected by G418 for 2 weeks, and single clones were photographed and shown on the left, Scale bar = 50 μm, the percentage of spindle cells were shown on the right; (B), (C) and (D) E-cadherin (CDH1), N-cadherin (CDH2) and Vimentin (VIM) mRNA and protein expression levels in A375 cells transfected with shRNAs against TET2 or TET3 were assessed by real-time RT-PCR (B) and immunoblotting (C)(D). For RT-qPCR, the relative expression levels of all genes were normalized to GAPDH (Student's t-test, *p < 0.05, **p < 0.01), and for immunoblotting, GAPDH was used to show that equal amounts of proteins were loaded on the gel; (E) The relative mRNA expression levels of EMT master transcription factors were detected by real-time RT-PCR and were normalized to GAPDH (Student's t-test, *p < 0.05, **p < 0.01); (F) For the wound healing assay, the cells were grown to confluence in complete cell culture medium. At time 0, a 3-mm scrape wound was created across the diameter with a pipette tip followed by extensive washes with medium to remove dead and floating cells. Cell migration was determined by measuring the distance between the cells on either side of the scratch over 24 hrs and 48 hrs, which is shown on the right (**p < 0.01, compared with the control). Representative wound closure was monitored by microscopy at × 100 magnification and is shown on the left; (G) For the Boyden Chamber Transwell cell migration assay, 5 × 10⁶ cells were seeded on top of the Boyden chambers. After 24 hrs, the cells on the bottom were stained with 1% crystal violet and were observed by optical microscopy. The migrated cells were counted and representative images of the migrated cells are shown on the right; the Y-axis represents the stained cell counts per field. The data represent three independent experiments. (Student's t-test, *p < 0.05, **p< 0.01).
Figure 3
Figure 3. 5-aza antagonizes the TGF-β1-induced suppression of TET2 and TET3 and the EMT-like process
(A) The relative methylation levels of the TET2 and TET3 promoters after treatment with or without TGF-β1 were analyzed by methylation- and non-methylation-specific qPCR. The Y-axis represents the relative methylation levels normalized by the non-methylation levels (Student's t test, *p < 0.05); (B) (C) RT-qPCR (B) and immunoblotting (C) analysis of TET2 and TET3 mRNA and protein expression levels in A375 cells treated with or without TGF-β1 and 5-aza; for RT-qPCR, the relative expression levels of all genes were normalized to the GAPDH level (Student's t test, *p < 0.05, **p < 0.01), while for immunoblotting, GAPDH was used to show that equal amounts of proteins were loaded on the gel; (D) The expression levels of TET2 and TET3 in SK-MEL-1 cells treated with or without 5-aza were analyzed by immunoblotting, and GAPDH was used to show that equal amounts of proteins were loaded on the gel; (E) The expression of E-cadherin and N-cadherin in A375 cells treated with or without TGF-β1 or 5-aza were analyzed by immunoblotting, and GAPDH was used to show that equal amounts of proteins were loaded on the gel; (F) Wound healing assay using A375 cells treated with or without TGF-β1 and 5-aza. Representative images of migrated cells are shown on the left. The mean was derived from cell counts of 4 fields, and each experiment was repeated 3 times (Student's t test, *p < 0.05, **p < 0.01, compared with the control).
Figure 4
Figure 4. DNMT3A mediates the TGF-β1-induced down regulation of TET2 and TET3
(A) RT-qPCR and (B) immunoblotting analysis of DNMT1, DNMT3A and DNMT3B mRNA and protein levels in cells treated with or without TGF-β1 for the indicated times. For RT-qPCR, the relative expression levels of all genes were normalized to the level of GAPDH (Student's t test, *p < 0.05, **p < 0.01), while for immunoblotting, GAPDH was used to show that equal amounts of proteins were loaded on the gel; (C) The expression levels of TET2 and TET3 upon siRNA-mediated knock down of DNMT3A or DNMT3B in SK-MEL-1 cells were detected by immunoblotting, and GAPDH was used to show that equal amounts of proteins were loaded on the gel; (D) Representative morphology of A375 cells that were transfected with siRNAs against Negative Control (NC) or DNMT3A and that were treated with or without TGF-β1 are shown on the left (Left, Scale bar = 100 μm). The percentage of spindle-shaped cells was determined by counting the cells in 4 fields and is shown on the right (Student's t test, **p < 0.01).
Figure 5
Figure 5. TGF-β1 enhances the recruitment of DNMT3A to the TET2 and TET3 promoters
(A) and (D) show the schematic representation of the CpG islands near the TET2 and TET3 transcription start sites, respectively. The black lines indicate the CpG islands and the white frames indicate the exons, the position of the primers is indicated with numbers above, while the relative distances to the transcription start sites are marked below; (B), (C), (E) and (F) show the recruitment of DNMT3A to the TET2 and TET3 promoters with or without TGF-β1 treatment, which was analyzed by ChIP-PCR (B) (E) and ChIP-qPCR (C) (F) (Student's t test, *p < 0.05, **p < 0.01, ***p < 0.01).
Figure 6
Figure 6. Overexpression of TET2 antagonizes TGF-β1-induced EMT
(A, B) The relative expression levels of the indicated mRNAs in A375 cells that were transfected with empty vector or the TET2 C-terminal expression vector were detected by RT-qPCR, and all genes were normalized to the levels of GAPDH, (Student's t test, *p < 0.05, **p < 0.01); (C) Boyden Chamber Transwell cell migration assay. In all, 5 × 10⁴ cells were seeded on top of the Boyden chambers. After 24 hrs, the cells on the bottom were stained with 1% crystal violet and were observed by optical microscopy. Cell migration was determined by counting the number of stained cells; representative images of the migrated cells are shown on the right. The Y-axis represents the number of cells per field. The data represent three independent experiments (Student's t test, *p < 0.05, **p < 0.01); (D) 1 × 10³ cells were seeded into each well of 96-well plates, and cell growth was evaluated by measuring the absorbance of OD490 after staining with MTT. (E) The expression levels of the indicated proteins in A375 cells that were transfected with empty vector or TET2 expression vector and that were treated with or without TGF-β1 were detected by immunoblotting, and GAPDH was used to show that equal amounts of proteins were loaded on the gel; (F) Morphology of A375 cells that were transfected with empty vector or with the TET2 expression vector and that were treated with or without TGF-β1 for 3 days. Representative images of cell morphology are shown on the left (Scale bar =100 μm), and the percentages of spindle-shaped cells were derived from counts of 4 fields and are shown on the right; each experiment was repeated 3 times (Student's t test, ***p < 0.001).
Figure 7
Figure 7. Overexpression of TET2 suppresses tumor growth and metastasis in vivo
(A) The effect of TGF-β treatment on B16 cell growth was evaluated by measuring the absorbance of OD490 after staining with MTT. (B) TET2 C-terminal overexpression cells were transfected with the pcDNA3.1-TET2 C-terminal sequence or with pcDNA3.1 empty vector. The effect of TET2 overexpression on cell proliferation was assessed by MTT; 5 × 10⁶ cells were subcutaneously injected into the flanks of C57BL/6 mice (n = 5), and the volumes of the tumors were measured since 16 days after injection. A significant difference was observed after day 20 (C), the volumes of the tumors were evaluated as lengths × widths2/2, and a representative image of the mice at day 22 is shown (D), Survival time of the mice is shown as the percentage of mice still alive at different times post injection (E); 1 × 10⁶ B16 cells transfected with pcDNA3.1-TET2 or empty vector were injected into the flanks of C57BL/6 mice, and the time of forming visible tumors was recorded (F). All mice were sacrificed and dissected 30 days after injection. The morphology of the tumors (G), the weights of the tumors (H) were shown; 2 × 10⁵ cells transfected with pcDNA3.1-TET2 or empty vector were intravenously inoculated into C57BL/6 mice (n = 9), and the mice were sacrificed on day 25 to evaluate the occurrence of metastasis by counting the number of tumor nodules in the lungs. The photograph of the lungs is shown (I). The metastatic potential of the cells was assessed by counting the number of tumor nodules in the lungs (J). (Student's t test, *p < 0.05, **p < 0.01, ***p < 0.001)
Figure 8
Figure 8. A model depicting the roles of epigenetic silencing of TET2 and TET3 in TGF-β-induced EMT-like process in melanoma
TGF-β treatment enhanced the recruitment of DNMT3A to TET2 and TET3 promoters, and the silencing of them activated EMT master transcription factors to promote the EMT-like process in melanoma.

Similar articles

Cited by

References

    1. Alonso SR, Tracey L, Ortiz P, Perez-Gomez B, Palacios J, Pollan M, Linares J, Serrano S, Saez-Castillo AI, Sanchez L, Pajares R, Sanchez-Aguilera A, Artiga MJ, et al. A high-throughput study in melanoma identifies epithelial-mesenchymal transition as a major determinant of metastasis. Cancer Res. 2007;67:3450–60. doi: 10.1158/0008-5472.CAN-06-3481. - DOI - PubMed
    1. Hoek KS, Schlegel NC, Brafford P, Sucker A, Ugurel S, Kumar R, Weber BL, Nathanson KL, Phillips DJ, Herlyn M, Schadendorf D, Dummer R. Metastatic potential of melanomas defined by specific gene expression profiles with no BRAF signature. Pigment Cell Res. 2006;19:290–302. doi: 10.1111/j.1600-0749.2006.00322.x. - DOI - PubMed
    1. Kalluri R, Weinberg RA. The basics of epithelial-mesenchymal transition. J Clin Invest. 2009;119:1420–8. doi: 10.1172/JCI39104. - DOI - PMC - PubMed
    1. Thiery JP, Acloque H, Huang RY, Nieto MA. Epithelial-mesenchymal transitions in development and disease. Cell. 2009;139:871–90. doi: 10.1016/j.cell.2009.11.007. - DOI - PubMed
    1. Davalos V, Moutinho C, Villanueva A, Boque R, Silva P, Carneiro F, Esteller M. Dynamic epigenetic regulation of the microRNA-200 family mediates epithelial and mesenchymal transitions in human tumorigenesis. Oncogene. 2012;31:2062–74. doi: 10.1038/onc.2011.383. - DOI - PMC - PubMed

MeSH terms