. 2016 Nov 16;17(1):924.
doi: 10.1186/s12864-016-3219-8.

Genome-wide gene expression and RNA half-life measurements allow predictions of regulation and metabolic behavior in Methanosarcina acetivorans

Affiliations

Genome-wide gene expression and RNA half-life measurements allow predictions of regulation and metabolic behavior in Methanosarcina acetivorans

Joseph R Peterson et al. BMC Genomics. .

Abstract

Background: While a few studies on the variations in mRNA expression and half-lives measured under different growth conditions have been used to predict patterns of regulation in bacterial organisms, the extent to which this information can also play a role in defining metabolic phenotypes has yet to be examined systematically. Here we present the first comprehensive study for a model methanogen.

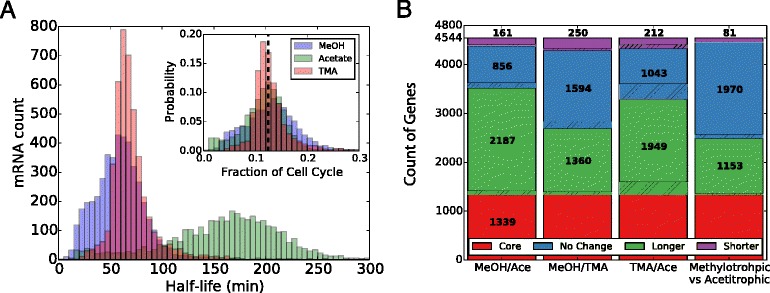
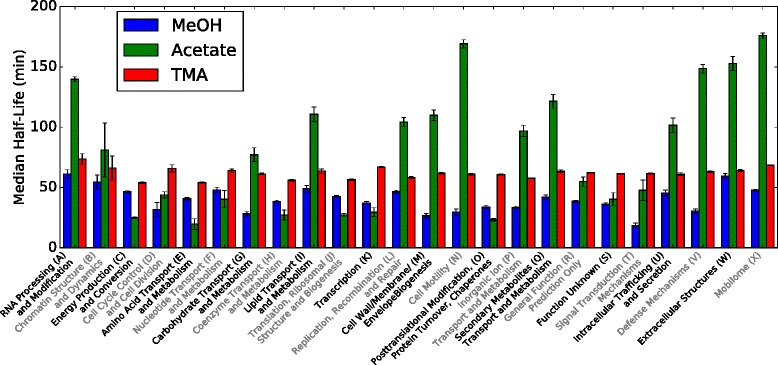
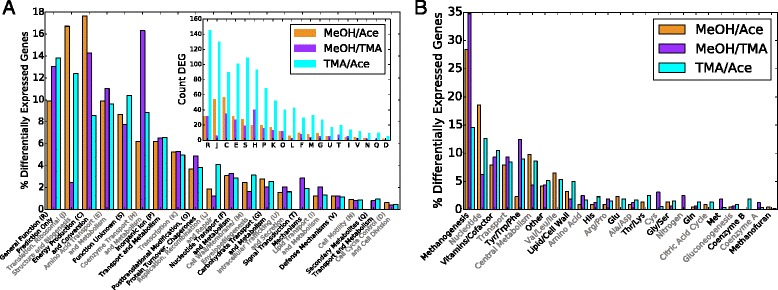
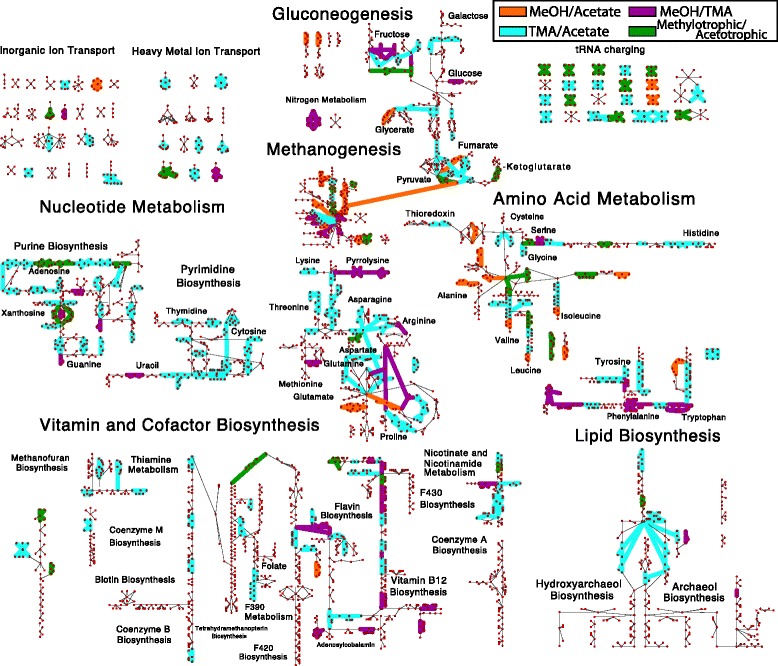
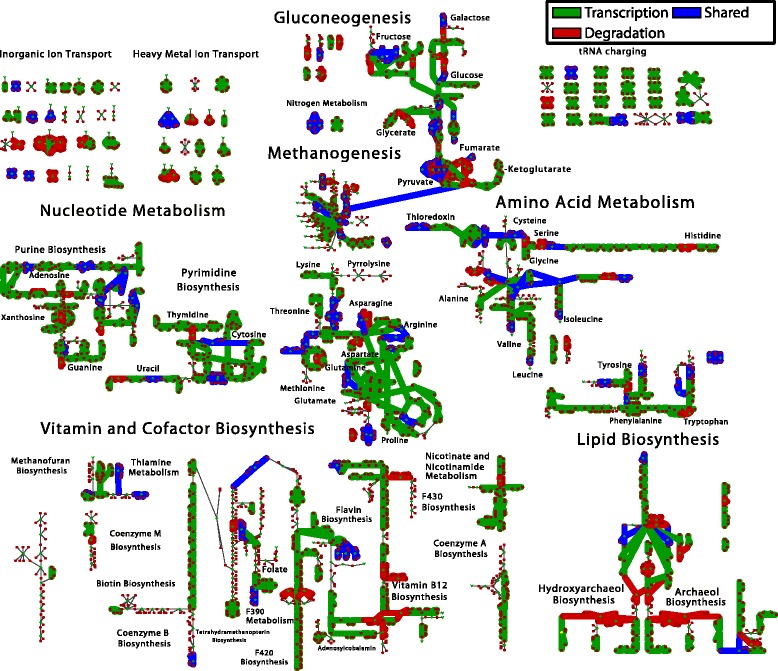
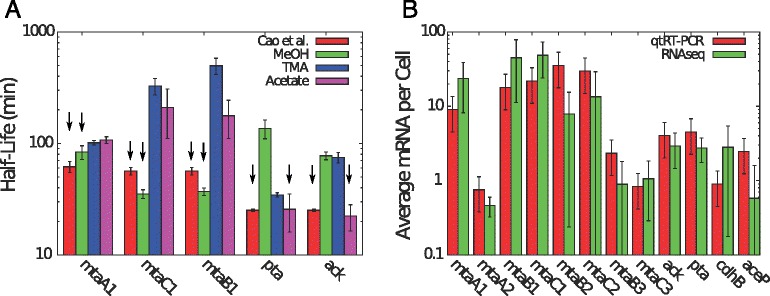
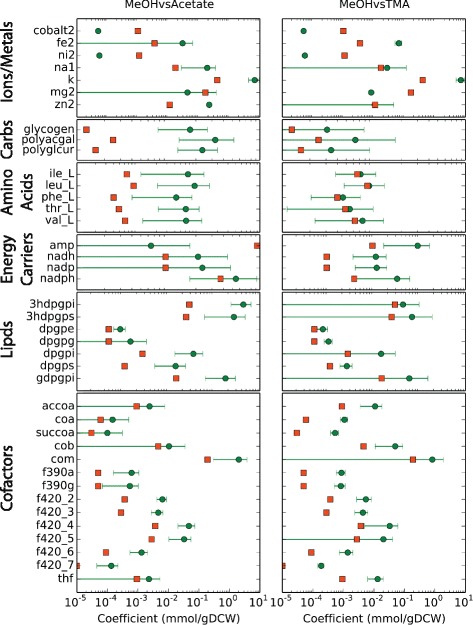
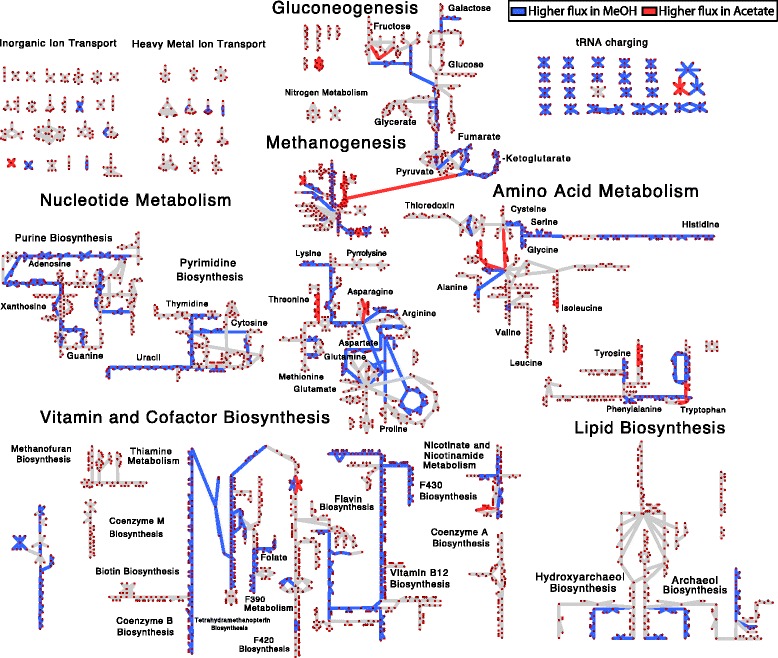
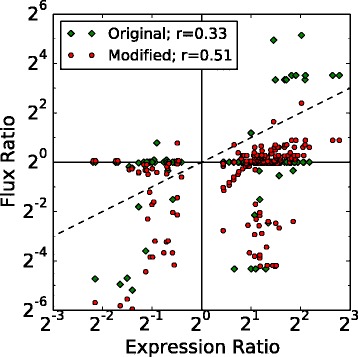
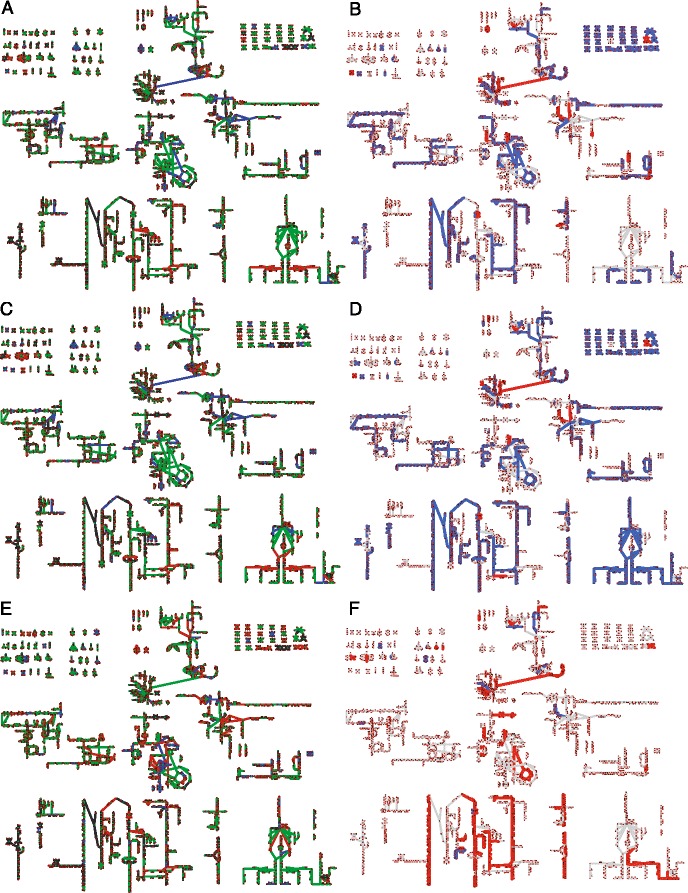
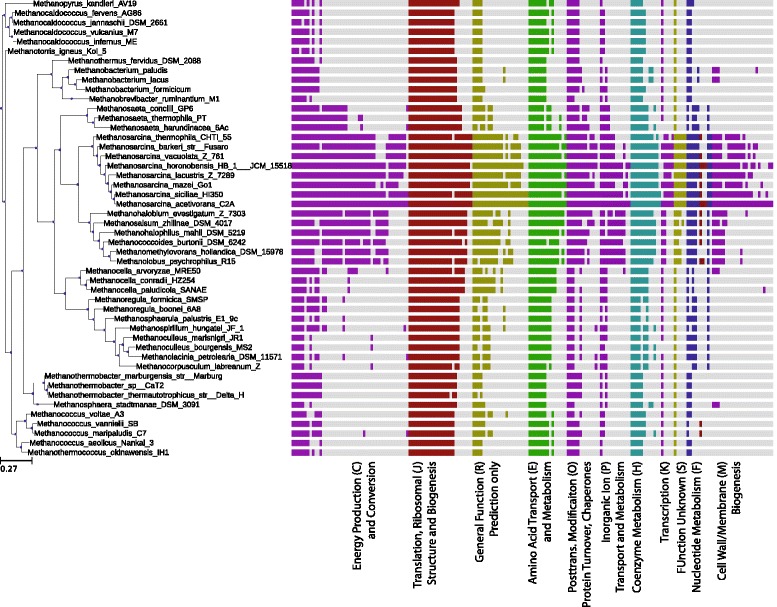
Results: We use expression and half-life data for the methanogen Methanosarcina acetivorans growing on fast- and slow-growth substrates to examine the regulation of its genes. Unlike Escherichia coli where only small shifts in half-lives were observed, we found that most mRNA have significantly longer half-lives for slow growth on acetate compared to fast growth on methanol or trimethylamine. Interestingly, half-life shifts are not uniform across functional classes of enzymes, suggesting the existence of a selective stabilization mechanism for mRNAs. Using the transcriptomics data we determined whether transcription or degradation rate controls the change in transcript abundance. Degradation was found to control abundance for about half of the metabolic genes underscoring its role in regulating metabolism. Genes involved in half of the metabolic reactions were found to be differentially expressed among the substrates suggesting the existence of drastically different metabolic phenotypes that extend beyond just the methanogenesis pathways. By integrating expression data with an updated metabolic model of the organism (iST807) significant differences in pathway flux and production of metabolites were predicted for the three growth substrates.

Conclusions: This study provides the first global picture of differential expression and half-lives for a class II methanogen, as well as provides the first evidence in a single organism that drastic genome-wide shifts in RNA half-lives can be modulated by growth substrate. We determined which genes in each metabolic pathway control the flux and classified them as regulated by transcription (e.g. transcription factor) or degradation (e.g. post-transcriptional modification). We found that more than half of genes in metabolism were controlled by degradation. Our results suggest that M. acetivorans employs extensive post-transcriptional regulation to optimize key metabolic steps, and more generally that degradation could play a much greater role in optimizing an organism's metabolism than previously thought.

Keywords: Degradational regulatory control; Differential pathway usage; Genome scale metabolic modeling; Metabolic phenotype; Methanogens; RNA half–lives.


Figures

Fig. 1
Fig. 1
Shift in Half-Life With Growth Substrate. a) Genome-wide histograms of RNA half-lives for M. acetivorans growing in methanol (blue), TMA (red), or acetate (green) media. The shorter lifetimes in high-energy substrates are apparent when compared to the acetate distribution. The inset shows the distribution of half-lives after they have been scaled by doubling time (7.5hr [43, 95, 96], 8.9hr [43] and 24.6hr [43, 95, 97] for growth in MeOH, TMA and Acetate, respectively), demonstrating that the average transcript half-life is a constant fraction of the cell cycle, or about 12.7% ±3.5% the doubling time (dashed line). See Additional file 1: Figure S4 for a larger version of the inset. b) A breakdown of changes in half-life by pairwise comparison of growth conditions. Unregulated genes that show no statistically significant (t-test, p>0.01) shift in half-life under any of the conditions (1339 total; red bar) and those marked as “No Change” (blue bar) do not show significant changes when comparing the indicated conditions. Genes that are stabilized or destabilized when comparing the second condition to the first condition are labelled as “longer” (green) and “shorter” (purple), respectively. Hatched regions indicate the fraction of genes that are differentially expressed in addition to having different half-lives. As discussed more thoroughly in the text, almost half of the stabilized and destabilized genes are common when comparing methylotrophic conditions to acetotrophic growth, suggesting there is a similar stabilization mechanism based on either growth rate or substrate
Fig. 2
Fig. 2
Half-Life Shift by Functional Class. The median half-lives for the 23 COG classes demonstrate different behaviors for low- and high-energy substrates. The shift in RNA half-lives between substrates are not uniform across functional classes, suggesting there exists a mechanism to selectively stabilize/destabilize the transcripts. See Additional file 1: Figure S5 for details about the median and quartiles. Uncertainties were calculated as the weighted standard deviation and are shown as error bars
Fig. 3
Fig. 3
Breakdown of Differentially Expressed Genes. Breakdown of differentially expressed genes (DEG) comparing MeOH/Acetate (orange), MeOH/TMA (purple) and TMA/Acetate (cyan) by (a) COG class and (b) metabolic subsystem (metabolic genes include those that are associated with reactions in the metabolic model iST807). The outliers in (a) include coenzyme/vitamin metabolism (H) and translation and ribosome biogenesis (J) when comparing MeOH and TMA. The inset in a shows the count of DEG in each category. The inset in (a) shows the count of DEG in each category. Genes with a p-value ≤ 0.01 were considered to be differentially expressed
Fig. 4
Fig. 4
Mapping of Differentially Expressed Genes (DEG) on Metabolism. The map of all known metabolic reactions effected by differentially expressed genes comparing MeOH vs. acetate (orange), MeOH vs. TMA (purple), TMA vs. acetate (cyan) and MeOH/TMA vs. acetate (green). Reactions and metabolites are represented as green diamonds and red circles, respectively. Reactions are connected to participating metabolites by edges. Common metabolites are duplicated. Unregulated reactions are indicated by thin lines. Genes were considered differentially expressed if the p-value ≤ 0.01 as computed in all of the three methods: DESeq2, edgeR and PoissonSeq. Reaction and metabolite names can be seen by zooming into Additional file 1: Figures S19 and S20
Fig. 5
Fig. 5
Control Coefficients Mapped onto Metabolism. A mapping of the control coefficients for changing mRNA expression levels between TMA and acetate. Red indicate reactions where mRNA levels are regulated by shifts in the degradation rate, while green indicates mRNA level shifts due to changes in transcription rate. Blue indicates reactions where mRNA levels are affected by both transcription and degradation rate. Reaction and metabolite names can be seen by zooming into Additional file 1: Figures S19 and S20
Fig. 6
Fig. 6
Comparison of Transcripts with Methanosarcina mazei [66] a) A comparison of mRNA half lives measured via our RNAseq data compared with a previous study using qtRT-PCR in the related organism Methanosarcina mazei growing in methanol or acetate. Cao et al. measured methyltransferase (mtaA1, mtaCB1) half-lives from methanol grown cells, while they measured acetoclastic gene (pta, ack) half-lives for acetate grown cells. As can be seen in the figure half lives match for methanol and acetate grown cells. Arrows indicate which bars correspond to the comparison to Cao et al. b) A comparison of mRNA copies per cell estimated via our RNAseq data, and previous studies that utilized RT-qPCR to quantify transcript abundance in the related organism Methanosarcina mazei grown in methanol (see Additional file 1: Figure S13 for acetate growth). Error bars are standard deviation of the mean for 3 replicates. Values from Cao et al. are for cells grown at 30 °C compared to our cells which were grown at 37 °C. All values agree within uncertanties except for cdh, mtaA2, and mtaB2 indicating the organisms have similar expression profiles and our estimates for mRNA counts are good
Fig. 7
Fig. 7
Fitted Biomass Coefficients. A comparison of fitted biomass coefficients. Orange squares indicate the coefficients for growth in MeOH while the green circles indicate the optimized biomass coefficients. Large error bars indicate that the coefficient can take on many values while still being optimal. Only metabolites with a significant shift comparing either MeOH to acetate or MeOH to TMA are included in the plot (all fitted biomass coefficients can be found in Additional file 1: Figure S15)
Fig. 8
Fig. 8
Metabolic Flux Differentces between MeOH and Acetate. Predicted changes in flux comparing growth on methanol to growth on acetate. Pathways that carry more flux (>2 fold change in flux) when grown on acetate are indicated by red while those that carry more flux when grown on methanol are indicated by blue. Unaffected pathways are shown as grey lines. Reaction and metabolite names can be seen by zooming into Additional file 1: Figures S19 and S20
Fig. 9
Fig. 9
Metabolic Flux vs Gene Expression. Ratio of metabolic fluxes compared to ratio of gene expression for growth in different media. Each point represents a mapping between one reaction and one gene; therefore each reaction or gene may be represented by multiple points. If the same biomass requirements are used for the different growth substrates few of the reactions show any difference in flux (green diamonds) and there is weak correlation between expression and flux. The differences in fluxes that are observed are primarily due to genes encoding proteins that act in methanogenesis. By relaxing the assumption that biomass coefficient are constants across all growth substrates the model can be fit to improve the correlation between regulation and metabolism (red circles). After fitting, many additional pathways are predicted to carry different flux, as demonstrated by more points moving off the horizontal towards y=x (dashed line)
Fig. 10
Fig. 10
Control Coefficients and Fluxes contrasting all Substrates. Comparisons of control coefficients (a, c, e) to predicted metabolic fluxes (b, d, f). (a, b) MeOH vs Acetate, (c, d) TMA vs Acetate, (e, f) MeOH vs TMA. Control coefficients (a, c, e) indicate that reactions are transcriptionally controlled (green), degradationally controlled (red) or shared control (blue). Mappings of predicted metabolic fluxes indicate higher flux in the second substrate (red) versus lower flux in the second substrate (blue). Larger versions of (a, b) can be seen in Figs. 5 and 8. Larger versions of (b-f) can be seen in Additional file 1: Figures S19, S20, S21, and S22. The names for each reaction and metabolite can be seen by zooming into the the larger versions of the maps in the Additional file
Fig. 11
Fig. 11
Phylogeny of Differentially Expressed Genes. Conservation of the genes that are differentially expressed between MeOH and acetate growth. Each vertical bar indicates that a homolog for the differentially expressed gene exists in the indicated species (computed as the bidirectional best hits functionality in the ITEP software [92] with an E-value cut-off of 10−5 for a database of ∼125000 proteins). Most differentially expressed genes are highly conserved among the Methanosarcinales; however a core set of genes are conserved across all methanogens

Similar articles

Cited by

References

    1. Fei J, Singh D, Zhang Q, Park S, Balasubramanian D, Golding I, Vanderpool CK, Ha T. Determination of in vivo target search kinetics of regulatory noncoding RNA. Science. 2015;347(6228):1371–4. doi: 10.1126/science.1258849. - DOI - PMC - PubMed
    1. Rogowska AT, Puchta O, Czarnecka AM, Kaniak A, Stepien PP, Golik P. Balance between Transcription and RNA Degradation Is Vital for Saccharomyces cerevisiae Mitochondria: Reduced Transcription Rescues the Phenotype of Deficient RNA Degradation. Mol Biol Cell. 2005;17(3):1184–93. doi: 10.1091/mbc.E05-08-0796. - DOI - PMC - PubMed
    1. Chiba Y, Mineta K, Hirai MY, Suzuki Y, Kanaya S, Takahashi H, Onouchi H, Yamaguchi J, Naito S. Changes in mRNA Stability Associated with Cold Stress in Arabidopsis Cells. Plant Cell Physiol. 2012;54(2):180–94. doi: 10.1093/pcp/pcs164. - DOI - PubMed
    1. Peterson JR, Cole JA, Fei J, Ha T, Luthey-Schulten ZA. Effects of DNA replication on mRNA noise. Proc Natl Acad Sci USA. 2015;112(52):15886–91. doi: 10.1073/pnas.1516246112. - DOI - PMC - PubMed
    1. Bernstein JA, Khodursky AB, Lin PH, Lin-Chao S, Cohen SN. Global analysis of mRNA decay and abundance in Escherichia coli at single-gene resolution using two-color fluorescent DNA microarrays. Proc Natl Acad Sci USA. 2002;99(15):9697–702. doi: 10.1073/pnas.112318199. - DOI - PMC - PubMed

Publication types