. 2016 Nov 16;17(1):923.
doi: 10.1186/s12864-016-3228-7.

RNA-seq based transcriptomic map reveals new insights into mouse salivary gland development and maturation

Affiliations

RNA-seq based transcriptomic map reveals new insights into mouse salivary gland development and maturation

Christian Gluck et al. BMC Genomics. .

Abstract

Background: Mouse models have served a valuable role in deciphering various facets of Salivary Gland (SG) biology, from normal developmental programs to diseased states. To facilitate such studies, gene expression profiling maps have been generated for various stages of SG organogenesis. However these prior studies fall short of capturing the transcriptional complexity due to the limited scope of gene-centric microarray-based technology. Compared to microarray, RNA-sequencing (RNA-seq) offers unbiased detection of novel transcripts, broader dynamic range and high specificity and sensitivity for detection of genes, transcripts, and differential gene expression. Although RNA-seq data, particularly under the auspices of the ENCODE project, have covered a large number of biological specimens, studies on the SG have been lacking.

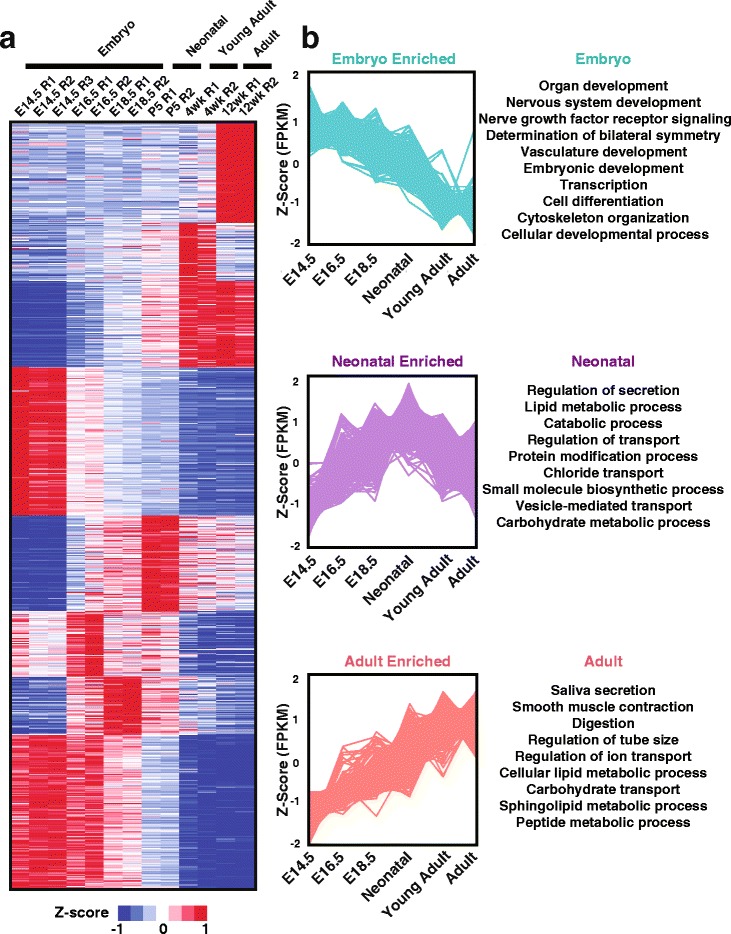
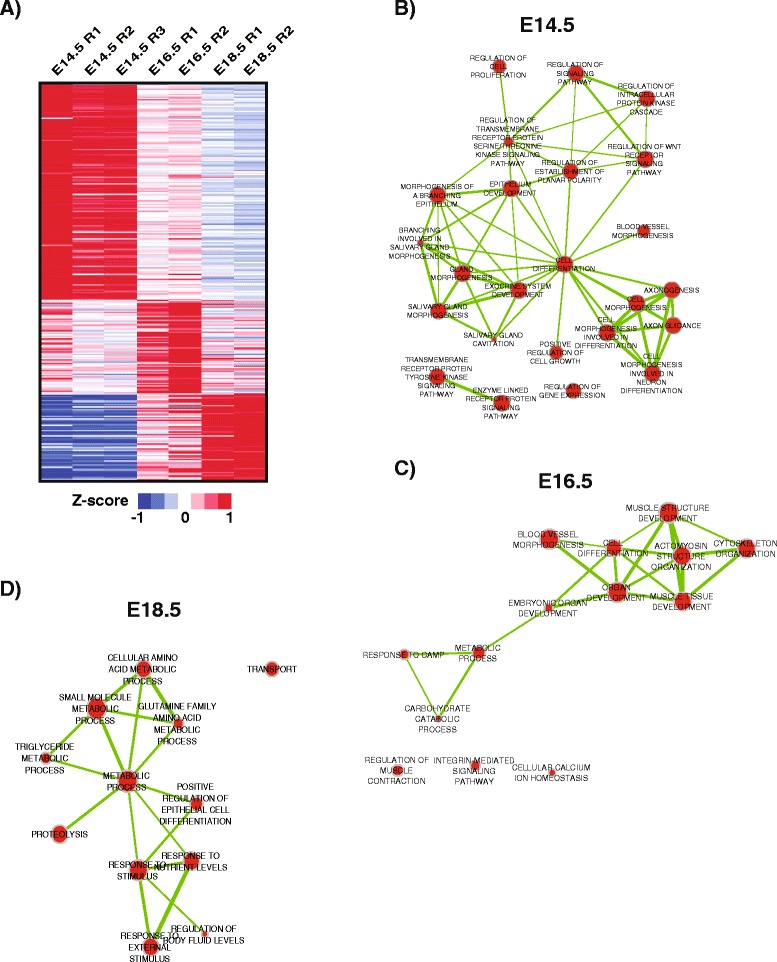
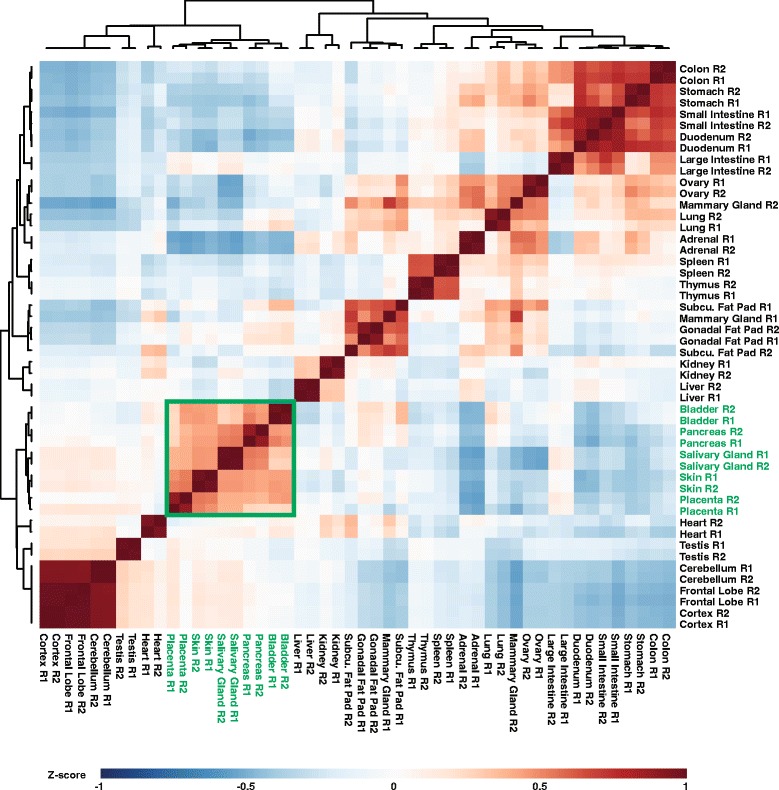
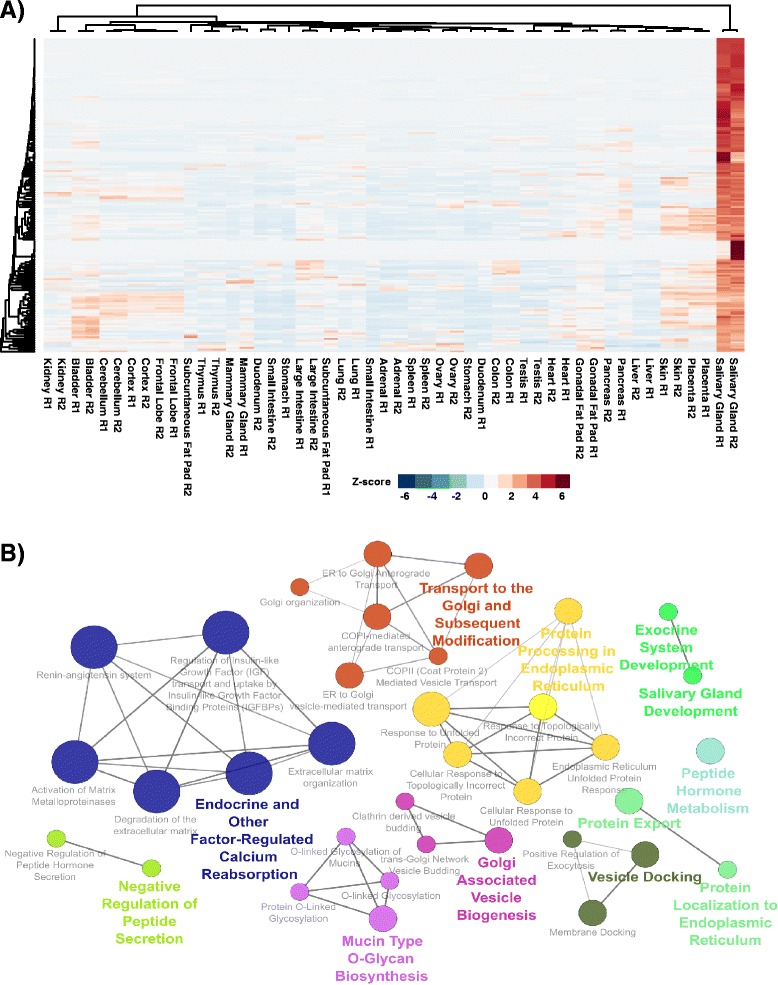
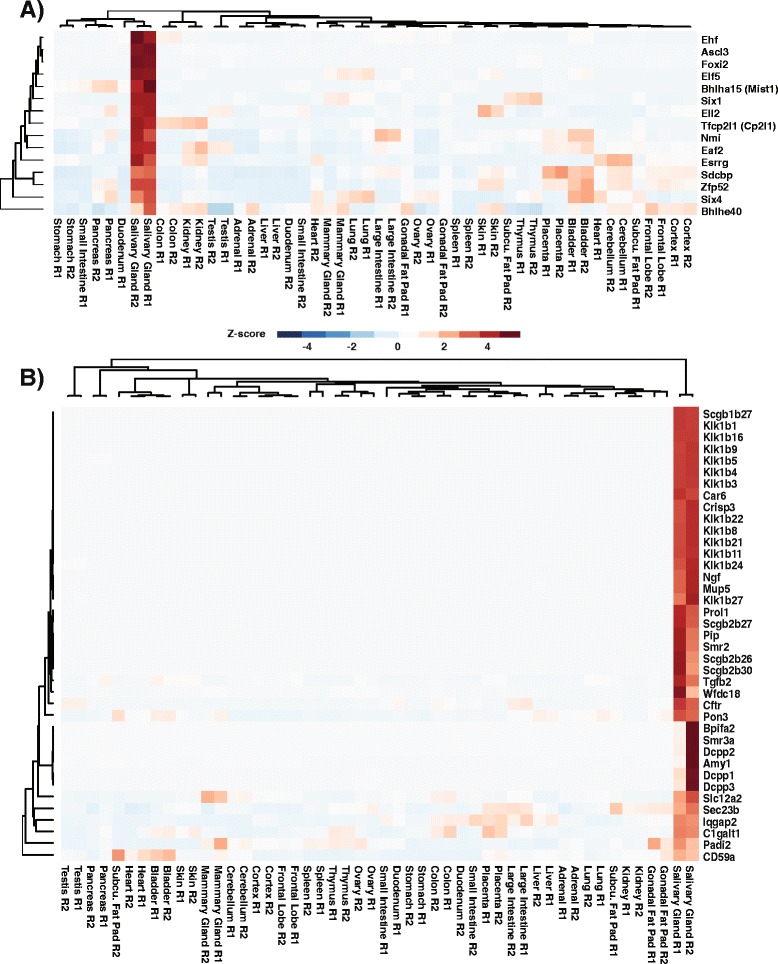
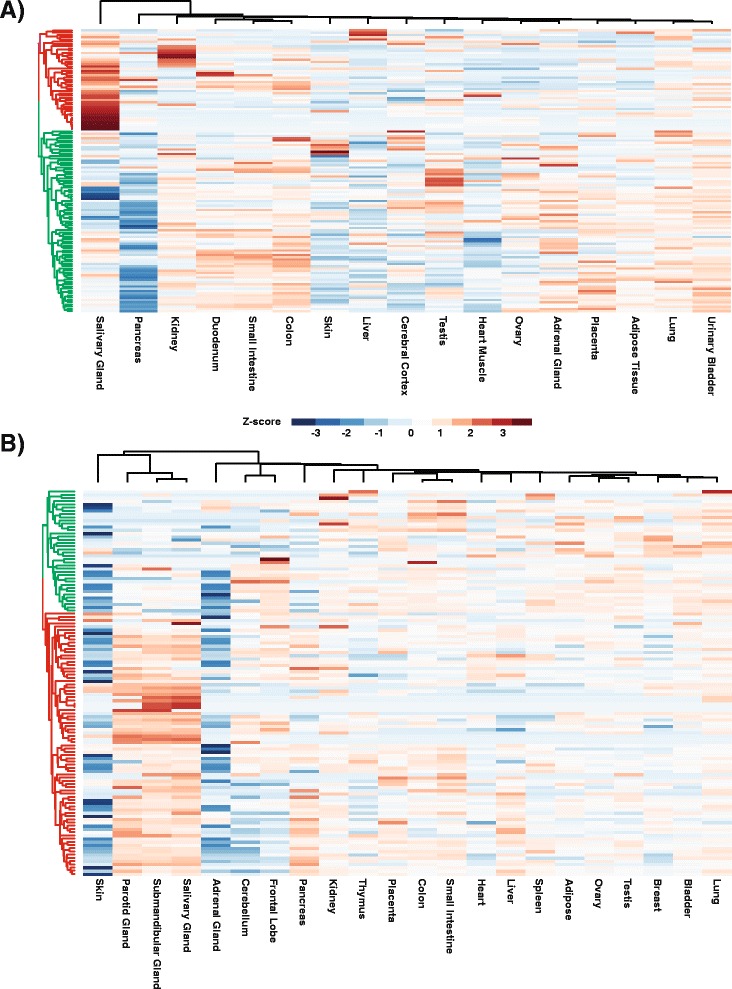
Results: To better appreciate the wide spectrum of gene expression profiles, we isolated RNA from mouse submandibular salivary glands at different embryonic and adult stages. In parallel, we processed RNA-seq data for 24 organs and tissues obtained from the mouse ENCODE consortium and calculated the average gene expression values. To identify molecular players and pathways likely to be relevant for SG biology, we performed functional gene enrichment analysis, network construction and hierarchal clustering of the RNA-seq datasets obtained from different stages of SG development and maturation, and other mouse organs and tissues. Our bioinformatics-based data analysis not only reaffirmed known modulators of SG morphogenesis but revealed novel transcription factors and signaling pathways unique to mouse SG biology and function. Finally we demonstrated that the unique SG gene signature obtained from our mouse studies is also well conserved and can demarcate features of the human SG transcriptome that is different from other tissues.

Conclusions: Our RNA-seq based Atlas has revealed a high-resolution cartographic view of the dynamic transcriptomic landscape of the mouse SG at various stages. These RNA-seq datasets will complement pre-existing microarray based datasets, including the Salivary Gland Molecular Anatomy Project by offering a broader systems-biology based perspective rather than the classical gene-centric view. Ultimately such resources will be valuable in providing a useful toolkit to better understand how the diverse cell population of the SG are organized and controlled during development and differentiation.

Keywords: Development; Gene signature; RNA-sequencing; Salivary gland.


Figures

Fig. 1
Fig. 1
Principal component analysis of the mouse salivary glands at different developmental time points. a Experimental scheme. We isolated total RNA from whole salivary glands ranging from early embryo to adult, and performed RNA-seq. Utilizing these datasets, we defined and annotated the salivary gland transcriptional landscape by using various Gene Ontology (GO) annotation analyses (BiNGO GO, REVIGO GO) and pathway analyses (PANTHER/REACTOME/KEGG). b Proportion of variance in each principle component. PC1, PC2 and PC3 represent ~90% of variance in the data. c Projection plots show the PCA coordinates for each stage, which are indicated by different colors. The data indicates that the inherent variations in gene expression between biological samples can distinguish the developing salivary gland in a time dependent manner
Fig. 2
Fig. 2
Cluster analysis of the salivary gland developmental profile. a Z-scores for each of the 1924 genes were calculated and used as input for gene-wise K-Means clustering analysis (k = 8, 1000 repetitions). This analysis, visualized as a heatmap, depicts enrichment of genes at both specific development time points and general developmental stages (embryo, neonatal and adult). b Visualization of the gene Z-scores from the general developmental stage enriched clusters depicts unique time-dependent patterns of expression. In general, this analysis has identified genes that have peak expression in the defined developmental stages. Also show are selected enriched GO-Annotations for each developmental stage gene cluster (BiNGO, Hypergeometric Test, FDR < 0.1)
Fig. 3
Fig. 3
Enriched biological process networks during embryogenesis. a Heatmap visualization of the Z-scores from the 1064 genes identified in the embryo specific (E14.5, E16.5, E18.5) clusters generated from the analysis in Fig. 2. bd) Network visualization of selected top enriched biological processes (BiNGO, Hypergeometric Test, FDR < 0.1) at E14.5, E16.5 and E18.5. The networks were assembled by CytoScape tool EnrichMap, using an organic layout. The node size represents the number of genes assigned to a biological process and edge width (green line) is proportional to the number of overlapping genes between two nodes
Fig. 4
Fig. 4
Hierarchical clustering of mouse tissues. FPKM values from the top 1500 genes with the highest median absolute deviation were used to cluster adult mouse tissues (Pearson Correlation, Average Linkage). The resulting heatmap shows that the salivary gland clusters closely with the pancreas, skin, bladder and placenta (green box and text)
Fig. 5
Fig. 5
Visualization of the tissue specific salivary gland gene signature. a Hierarchical Clustering (Pearson Correlation, Average Linkage) of the gene expression values selected from the tissue specific salivary gland signature across adult mouse tissues. b Network visualization of enriched pathways (GO/REACTOME/KEGG) in the gene signature was performed by ClueGO analysis
Fig. 6
Fig. 6
Visualization of selected members of the tissue specific salivary gland gene signature. a Hierarchical cluster analysis of the enriched transcription factors identified in the gene signature. b Hierarchical cluster analysis of enriched genes identified in the signature and which have been shown to play a role in salivary gland biology
Fig. 7
Fig. 7
Preservation of the tissue specific salivary gland gene signature in human tissues. a Hierarchical clustering of human tissues using averaged FPKM values (Human Protein Atlas RNA-seq Experiments) of the genes from the tissue specific salivary gland gene signature with human-mouse homology. The red colored dendrogram highlights the genes (45/126) that are preserved in the tissue specific enrichment observed in the mouse expression analysis. b Hierarchical clustering of human tissues using the Cap Analysis Gene Expression (CAGE) data, represented by log2 transformed DESeq2 median normalized TSS tag counts using the same gene signature as in panel A, with 82 genes showing cross-species conservation (red colored dendrogram)

Similar articles

Cited by

References

    1. Tucker AS. Salivary gland development. Semin Cell Dev Biol. 2007;18(2):237–44. doi: 10.1016/j.semcdb.2007.01.006. - DOI - PubMed
    1. Kwon HR, Larsen M. The contribution of specific cell subpopulations to submandibular salivary gland branching morphogenesis. Curr Opin Genet Dev. 2015;32:47–54. doi: 10.1016/j.gde.2015.01.007. - DOI - PMC - PubMed
    1. Larsen M, Yamada KM, Musselmann K. Systems analysis of salivary gland development and disease. Wiley Interdiscip Rev Syst Biol Med. 2010;2(6):670–82. doi: 10.1002/wsbm.94. - DOI - PMC - PubMed
    1. Nelson DA, Manhardt C, Kamath V, Sui Y, Santamaria-Pang A, Can A, Bello M, Corwin A, Dinn SR, Lazare M, et al. Quantitative single cell analysis of cell population dynamics during submandibular salivary gland development and differentiation. Biol Open. 2013;2(5):439–47. doi: 10.1242/bio.20134309. - DOI - PMC - PubMed
    1. Knosp WM, Knox SM, Hoffman MP. Salivary gland organogenesis. Wiley Interdiscip Rev Dev Biol. 2012;1(1):69–82. doi: 10.1002/wdev.4. - DOI - PubMed

Publication types