. 2016 Nov 16;17(1):928.
doi: 10.1186/s12864-016-3279-9.

Coevolution of paired receptors in Xenopus carcinoembryonic antigen-related cell adhesion molecule families suggests appropriation as pathogen receptors

Affiliations

Coevolution of paired receptors in Xenopus carcinoembryonic antigen-related cell adhesion molecule families suggests appropriation as pathogen receptors

Wolfgang Zimmermann et al. BMC Genomics. .

Abstract

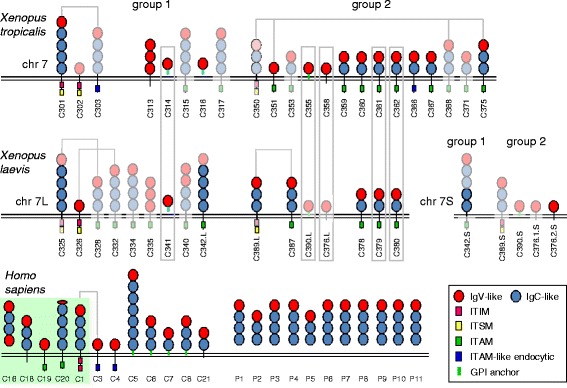
Background: In mammals, CEACAM1 and closely related members represent paired receptors with similar extracellular ligand-binding regions and cytoplasmic domains with opposing functions. Human CEACAM1 and CEACAM3 which have inhibitory ITIM/ITSM and activating ITAM-like motifs, respectively, in their cytoplasmic regions are such paired receptors. Various bacterial pathogens bind to CEACAM1 on epithelial and immune cells facilitating both entry into the host and down-regulation of the immune response whereas interaction with granulocyte-specific CEACAM3 leads to their uptake and destruction. It is unclear whether paired CEACAM receptors also exist in other vertebrate clades.

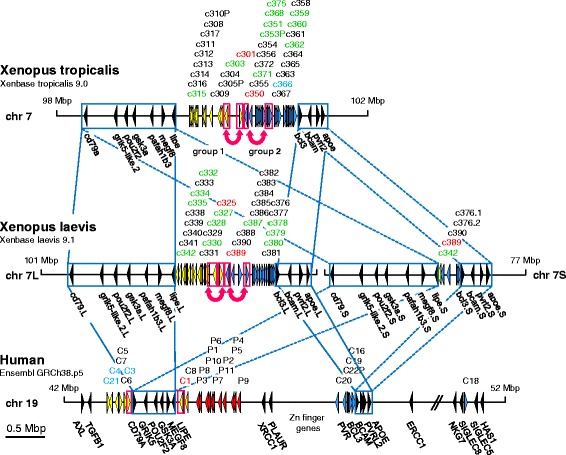
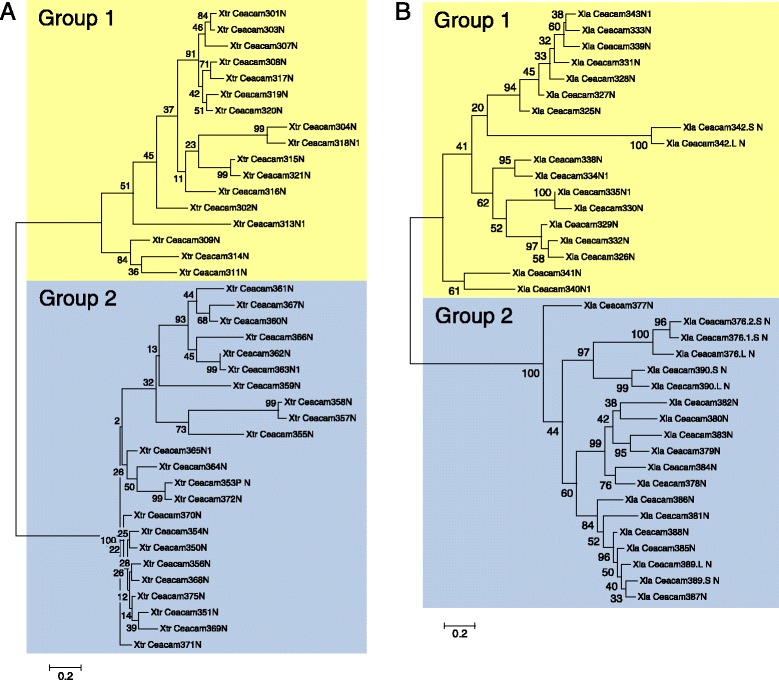
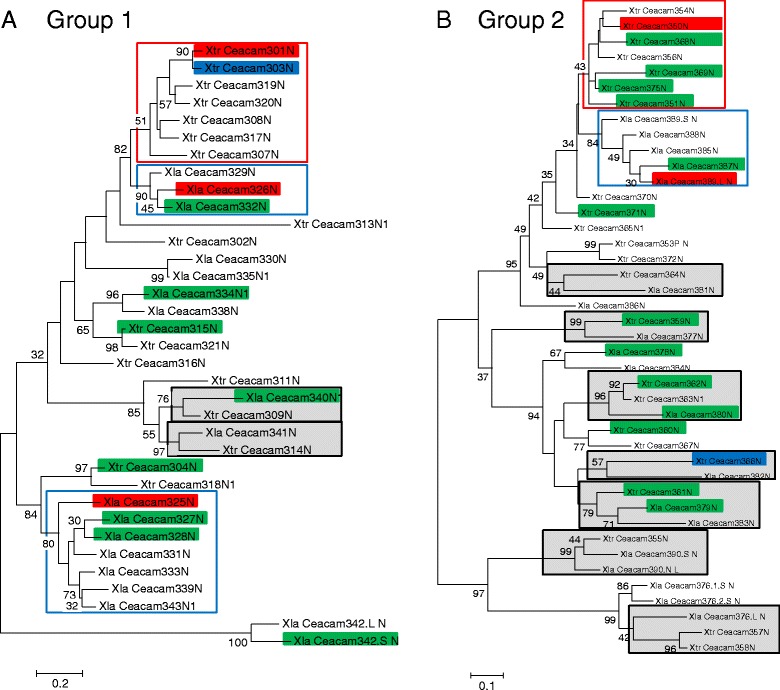
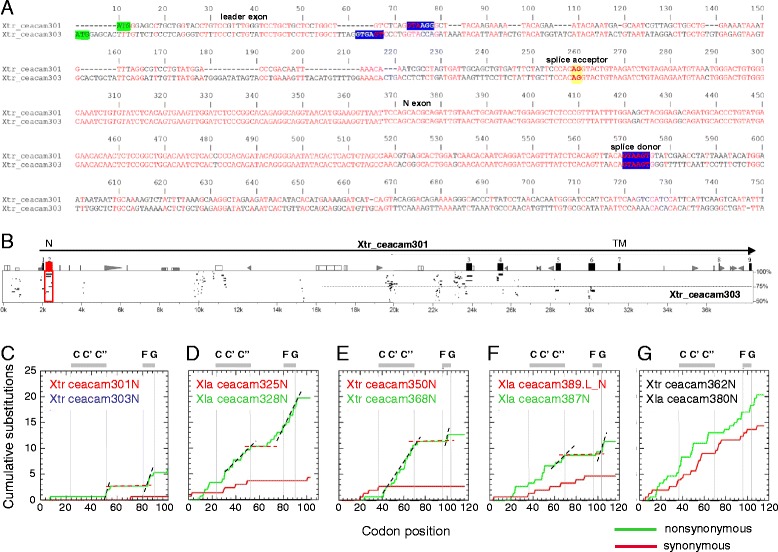
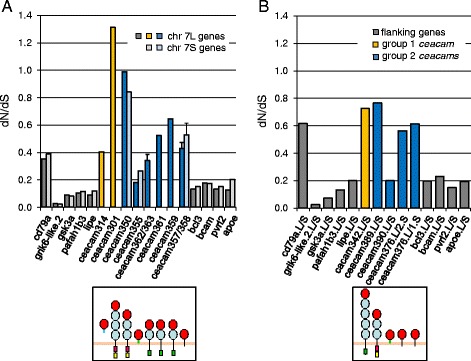
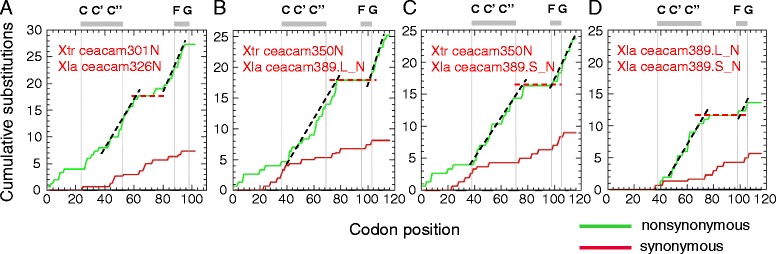
Results: We identified more than 80 ceacam genes in Xenopus tropicalis and X. laevis. They consist of two subgroups containing one or two putative paired receptor pairs each. Analysis of genomic sequences of paired receptors provide evidence that their highly similar ligand binding domains were adjusted by recent gene conversion events. In contrast, selection for diversification is observed among inhibitory receptor orthologs of the two frogs which split some 60 million years ago. The allotetraploid X. laevis arose later by hybridization of two closely related species. Interestingly, despite the conservation of the genomic landscape surrounding the homeologous ceacam loci only one locus resembles the one found in X. tropicalis. From the second X. laevis locus more than 80 % of the ceacam genes were lost including 5 of the 6 paired receptor genes. This suggests that once the gene for one of the paired receptors is lost the remaining gene cluster degrades rapidly probably due to lack of selection pressure exerted by pathogens.

Conclusions: The presence of paired receptors and selection for diversification suggests that also in amphibians CEACAM1-related inhibitory proteins are or were used as pathogen receptors.

Keywords: Allotetraploid; Amphibia; Carcinoembryonic antigen-related cell-cell adhesion molecule (CEACAM); ITAM; ITIM; Immunoglobulin superfamily; Paired receptors; Positive selection; Xenopus.


Figures

Fig. 1
Fig. 1
Chromosomal arrangement of ceacam genes in X. tropicalis and X. laevis. Arrowheads represent genes with their transcriptional orientation. Xenopus ceacam gene clusters are subdivided in group 1 (yellow) and group 2 members (blue). For X. laevis two homeologous ceacam clusters are found on chromosome 7 L and 7S which were generated by hybridization during speciation. Homeologs are indicated by L and S. Human CEACAM1-related genes are indicated in yellow, when predominantly expressed in trophoblast cells in red; the CEACAM genes for which orthologs can be identified in mammals are shown in blue and marker genes in black. Their syntenic relationship is shown by blue lines. Names of CEACAM1-like genes with ITIM-encoding exons are shown in red and with ITAM and ITAM-like motif-encoding exons in green and blue, respectively. Red double arrows symbolize potential recombination events between regions with ceacam genes containing ITIM or ITAM/ITAM-like motifs (genes shown in red boxes). Note that, in general, the genes in the same subcluster show the same, in different subclusters opposite transcriptional orientation. The nucleotide numbering of the chromosomes starts at the telomere of the short arms located to the left. The databases and the versions used are indicated below the species name. c, ceacam, C, CEACAM; chr, chromosome; P, pregnancy-specific glycoprotein (PSG) genes
Fig. 2
Fig. 2
Phylogenetic relationship of Xenopus Ceacam proteins. Phylogenetic trees were constructed based on mature N domain amino acid sequences (signal peptides excluded) from X. tropicalis (a) and X. laevis Ceacams (b) using the Maximum Likelihood method (MEGA6 software). The tree with the highest log likelihood is shown. The percentage of trees in which the protein sequences clustered together is shown next to the branches. For Ceacams predicted to contain more than one N domain, only the most N-terminal N1 domains were included in the analysis. Two distantly related Ceacam groups of N domains termed group 1 and group 2 can be discriminated in both species. Some of the most closely related Ceacams in the allotetraploid X. laevis represent homeologs located on the small (S) or the large (L) version of chromosome 7. A closely related pair of paralogous proteins termed .1 and .2 is found on chromosome 7S but not on chromosome 7 L. The bar below the phylogenetic tree shows the scale for the number of substitutions per site. P, pseudogene; Xla, X. laevis; Xtr, X. tropicalis
Fig. 3
Fig. 3
Orthologous and paralogous members of the Ceacam family in X. tropicalis and X. laevis. Phylogenetic trees were constructed based on mature N domain amino acid sequences (signal peptides excluded) from X. tropicalis and X. laevis group 1 (a) and group 2 Ceacams (b) using the Maximum Likelihood method (MEGA6 software). The tree with the highest log likelihood is shown. The percentage of trees in which the protein sequences clustered together is shown next to the branches. For Ceacams predicted to contain more than one N domain, only the most N-terminal N1 domains were included in the analysis. Ceacams whose N domains exhibit the highest degree of identity within the same species (paralogs) are boxed with red and blue lines for X. tropicalis and X. laevis, respectively. Pairs consisting of most closely related proteins from different species (sometimes including recently generated paralogs) are highlighted in gray (orthologs). The names of ITIM-containing members are highlighted in red, proteins with ITAM and ITAM-like motifs are marked with green and blue background, respectively. P, pseudogene; Xla, X. laevis; Xtr, X. tropicalis
Fig. 4
Fig. 4
Domain organization of Xenopus Ceacam proteins. The domain organization of Ceacam family members from X. tropicalis and X. laevis was predicted by gene analysis only (domains shown in light colors) or, where available, confirmed by EST and cDNA sequences (domains shown in intense colors). Only Ceacams whose complete domain organization could be delineated were included. Homeologous Ceacams in X. laevis arisen by hybridization during speciation are discriminated by L (encoded on long chromosome variant 7) and S (encoded on short chromosome variant 7). For comparison the domain organization of human CEACAM proteins is shown. The conserved human CEACAM family members are highlighted in green. IgV-like domains are shown as red, IgC-like domains are blue ovals. The predicted signaling motifs in the cytoplasmic domains are schematically shown as green (ITAM), blue (ITAM-like motif), red (ITIM) and yellow boxes (ITSM). Transmembrane domains and GPI anchors are indicated by black and green lines, respectively. Orthologous relationship as suggested by sequence relatedness and/or synteny is indicated by gray boxes. Note that Xtr_Ceacam301 and Xla_Ceacam326 appear to represent orthologs based on the degree of N domain sequence identity (see Fig. 3) despite their different domain organization. Paired receptors identified by their similar N domain sequences and the presence of ITIM/ITSM or ITAM/ITAM-like motifs are connected by gray lines. C, CEACAM or Ceacam; P, PSG
Fig. 5
Fig. 5
Evidence for gene conversion between putative paired receptor ceacam genes. (a) Alignment of exons 1 and 2 encoding the leader and N domain, respectively, and flanking introns of ceacam301 and ceacam303. Note the strong sequence conservation restricted to the N domain exon. The start codons are marked in green, the splice acceptor and splice donor sequences are highlighted in yellow and blue, respectively. (b) The nucleotide sequence of ITIM/ITSM-encoding ceacam301 gene was compared with that of ITAM-like motif-encoding ceacam303 from X. tropicalis. For contiguous stretches of nucleotides conserved between the gene pairs using a sliding window, the degree of identity was calculated and displayed as horizontal lines. The location of ceacam301 exons is indicated by numbered boxes. The genomic region involved in gene conversion is marked with a red box, the affected N exon is shown in red. Different repeat sequences are indicated by differently shaped forms. (c-f) The accumulation of nonsynonymous (green curves) and synonymous substitutions (red curves) along the N exons of putative paired receptor genes were determined after manual removal of gaps in the compared nucleotide sequences. The type of encoded signaling motif is indicated by the color of the gene name: red, ITIM/ITSM; green, ITAM; blue, ITAM-like motif. Stretches of codons with no or minimal accumulation of synonymous substitutions which run parallel to the x-axis suggest recent gene conversion/recombination events. Note the rapid accumulation of nonsynonymous mutations in the CC’C”FG β-strand regions (black broken lines) which indicates selection for diversification. This contrasts with conserved regions indicated by red broken lines. For comparison, N exon sequences of an orthologous gene pair (Xtr ceacam362/Xla ceacam380) were analyzed (g). The location of CC’C”and FG β-strand regions determined by 3D modeling (Additional file 4) are indicated by gray boxes above the graphs. N, N domain exon; TM, transmembrane domain exon; Xla, X. laevis; Xtr, X. tropicalis
Fig. 6
Fig. 6
Differential conservation of orthologous and homeologous Xenopus ceacam and flanking genes. Nucleotide sequences of N exons and the open reading frames from ceacam and flanking genes, respectively, from X. tropicalis were compared codon-wise with each of the two homeologous orthologs of X. laevis (a) or the X. laevis homeologs with each other (b) after manual removal of gaps and the ratio of the rate of nonsynonymous and synonymous mutations was calculated. The resulting dN/dS values were plotted using the X. tropicalis gene order on chromosome 7 (a) or the X. laevis gene order on chromosome 7S (b). In cases of recent gene duplication of one of the orthologs in X. tropicalis or X. laevis dN/dS ratios for all orthologous pairs were calculated and plotted as mean and deviation or standard deviation. The type of signaling motif present in the corresponding proteins can be inferred from the schematic representation of the protein domains below the graphs (see Fig. 4 for keys to domains and motifs). Chr, chromosome
Fig. 7
Fig. 7
Selection for sequence diversification in inhibitory receptor Ceacams. The accumulation of non-synonymous (green curves) and synonymous substitutions (red curves) along the N exons of orthologous (a-c) and homeologous inhibitory receptor gene pairs (d) were determined after manual removal of gaps in the compared nucleotide sequences. The names of the analyzed genes are indicated in the top left corner of the graph. Note the rapid accumulation of nonsynonymous mutations in the CC’C”FG β-strand regions (black broken lines) which indicates selection for diversification. This contrasts with conserved regions between CC’C” and FG β-strands indicated by red broken lines. The location of CC’C” and FG β-strand regions determined by 3D modeling (Additional file 4) are indicated by gray boxes above the graphs. Note the sequence identity of the 38 N terminal codons in the N exon of X. laevis homeologs ceacam389.L and ceacam389.S possibly caused by interchromosomal recombination. N, N domain exon; Xla, X. laevis; Xtr, X. tropicalis

Similar articles

Cited by

References

    1. Akkaya M, Barclay AN. How do pathogens drive the evolution of paired receptors? Eur J Immunol. 2013;43(2):303–313. doi: 10.1002/eji.201242896. - DOI - PubMed
    1. Martinet L, Smyth MJ. Balancing natural killer cell activation through paired receptors. Nat Rev Immunol. 2015;15(4):243–254. doi: 10.1038/nri3799. - DOI - PubMed
    1. Kammerer R, Zimmermann W. Coevolution of activating and inhibitory receptors within mammalian carcinoembryonic antigen families. BMC Biol. 2010;8:12. doi: 10.1186/1741-7007-8-12. - DOI - PMC - PubMed
    1. Kuespert K, Pils S, Hauck CR. CEACAMs: their role in physiology and pathophysiology. Curr Opin Cell Biol. 2006;18(5):565–571. doi: 10.1016/j.ceb.2006.08.008. - DOI - PMC - PubMed
    1. Boulton IC, Gray-Owen SD. Neisserial binding to CEACAM1 arrests the activation and proliferation of CD4+ T lymphocytes. Nat Immunol. 2002;3(3):229–236. doi: 10.1038/ni769. - DOI - PubMed

Publication types

Substances

LinkOut - more resources