. 2016 Nov 17:5:e21393.
doi: 10.7554/eLife.21393.

Decoupling of the minority PhD talent pool and assistant professor hiring in medical school basic science departments in the US

Affiliations

Decoupling of the minority PhD talent pool and assistant professor hiring in medical school basic science departments in the US

Kenneth D Gibbs et al. Elife. .

Abstract

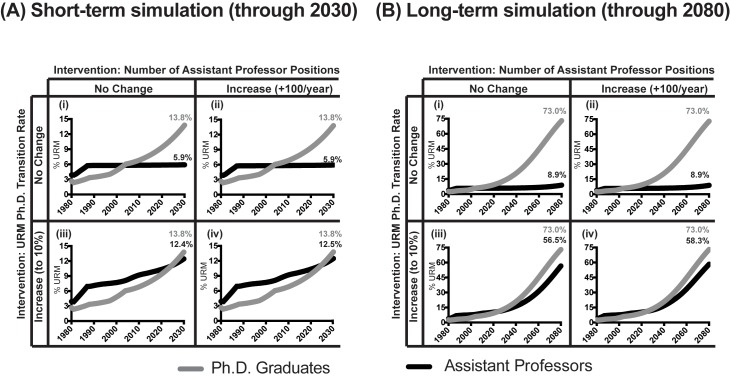
Faculty diversity is a longstanding challenge in the US. However, we lack a quantitative and systemic understanding of how the career transitions into assistant professor positions of PhD scientists from underrepresented minority (URM) and well-represented (WR) racial/ethnic backgrounds compare. Between 1980 and 2013, the number of PhD graduates from URM backgrounds increased by a factor of 9.3, compared with a 2.6-fold increase in the number of PhD graduates from WR groups. However, the number of scientists from URM backgrounds hired as assistant professors in medical school basic science departments was not related to the number of potential candidates (R2=0.12, p>0.07), whereas there was a strong correlation between these two numbers for scientists from WR backgrounds (R2=0.48, p<0.0001). We built and validated a conceptual system dynamics model based on these data that explained 79% of the variance in the hiring of assistant professors and posited no hiring discrimination. Simulations show that, given current transition rates of scientists from URM backgrounds to faculty positions, faculty diversity would not increase significantly through the year 2080 even in the context of an exponential growth in the population of PhD graduates from URM backgrounds, or significant increases in the number of faculty positions. Instead, the simulations showed that diversity increased as more postdoctoral candidates from URM backgrounds transitioned onto the market and were hired.

Keywords: NIH; careers in science; grad school; none; postdoc; science policy; workforce diversity.


Conflict of interest statement

The authors declare that no competing interests exist.

Figures

Figure 1.
Figure 1.. Temporal trends in the populations of biomedical Underrepresented Minority (URM) and Well-Represented (WR) PhD graduates and assistant professors, 1980-2014.
Line charts showing the (i) annual population, (ii) population growth relative to 1980, and (iii) percentage representation of PhD graduates and assistant professors in basic science departments in medical schools for scientists from (A) URM and (B) WR racial-ethnic backgrounds. Data on the populations of PhD graduates and assistant professors in medical school basic science departments were obtained from the National Science Foundation Survey of Earned Doctorates (as compiled by Federation of American Societies for Experimental Biology), and the AAMC Faculty Roster, respectively (please see methods section for more information). Grey lines represent PhD graduates, and black lines represent assistant professors. In panels Aiii and Biii, solid grey lines represent the percentages of URM and WR PhD graduates among all students who receive PhDs in the U.S. (U.S. citizen, permanent resident, and international), and dotted lines show percentages among PhD graduates who are U.S. citizens and permanent residents. The relative growth of PhD graduates from URM backgrounds to assistant professors is greater than the same comparison among scientists from WR backgrounds (i.e., there was a significant interaction between the URM status and position, β=1.60; p=3.6*10−7; panels Aii and Bii). Data are available in Figure 1—source data 1. DOI: http://dx.doi.org/10.7554/eLife.21393.002
Figure 2.
Figure 2.. Candidate pool size, hiring and utilization of URM and WR assistant professors in basic biomedical science departments.
Scatter plots showing the (i) pool of potential candidates for assistant professor positions, (ii) annual number of assistant professors hired, and (iii) percentage of the potential candidate pool hired annually for scientists from (A) URM and (B) WR backgrounds. R2 values in panels Aii and Bii are derived from correlating number of URM or WR assistant professors hired with the size of their respective pool of potential candidates. β in panels Aiii and Biii reflect the yearly percentage change in the fraction of the pools of URM and WR scientists hired into assistant professor positions. Asterisks represent significant values (p<10−4). Data are available in Figure 2—source data 1 and 2. DOI: http://dx.doi.org/10.7554/eLife.21393.004
Figure 2—figure supplement 1.
Figure 2—figure supplement 1.. Candidate pool size, hiring and utilization of URM and WR assistant professors in basic biomedical science departments: by gender.
Scatter plots showing the (i) pool of potential candidates for assistant professor positions, (ii) annual number of assistant professors hired, and (iii) percentage of the potential candidate pool hired annually for (A) URM Men, (B) URM Women, (C) WR Men, and (D) WR women. R2 values in panels A-Dii were derived from correlating number of URM or WR assistant professors hired with the size of their respective pool of potential candidates. β in panels A-Diii reflect the yearly percentage change in the fraction of the pools of URM and WR scientists hired into assistant professor positions. Asterisks represent significant values (p<10−4). Data are available in Figure 2—source data 1 and 2. DOI: http://dx.doi.org/10.7554/eLife.21393.007
Figure 3.
Figure 3.. System dynamics model of assistant professor hiring.
(A) A traditional “pipeline” view of faculty hiring. A fraction of the total stock of PhD graduates pursues faculty positions, and thus become candidates on the market. Candidates on the market are composed primarily of the subset of postdoctoral scientists pursuing faculty careers in medical school basic science departments but can include those who have non-traditional career paths such as the rare PhD student who proceeds directly to the faculty job market. Each year, candidates on the market are hired into the stock of assistant professors at a rate equal to the total number of slots available (“slots available”), and candidates who are not hired remain in the pool conditional on hiring probability (“market dropout”). After six years, assistant professors leave the system (either via promotion or contract termination, “Assistant Professor Tenure or Leave”). Boxes represent stocks (quantities), hourglasses represent flows (rates; writing italicized), variables are bolded, blue arrows represent causal connections between factors, and clouds represent system boundaries (B) Intermediate conceptual model. The pool of PhD graduates is separated into two groups: those who will pursue and enter faculty positions in research-intensive environments (“Faculty Aspire”), and those who will pursue other career interests (“Other Aspire”). All “Faculty Aspire” graduates enter the academic job market (“Candidates on the Market”) and remain based on hiring probability, while the “Other Aspire” scientists depart the system. As the total number of PhD graduates grows (“Baseline PhD Graduate Growth Rate”), the populations of “Faculty Aspire” and “Other Aspire” graduates are expected to grow equally (i.e. they maintain the same, fixed proportions with respect to one another). Initial populations (P0) of “Faculty Aspire” and “Other Aspire” candidates represent scaling factors that, together with the baseline growth rate, produce the number of PhD graduates in each stock. Candidates on the market are hired into the stock of assistant professors at a rate equal to the total number of slots available, and then depart the system six years later. (C) Elaborated model of faculty hiring for PhD scientists from WR and URM backgrounds with intervention to enhance workforce diversity. The career pathways of URM and WR scientists are conceptualized as independent, but are linked with respect to assistant professor hiring by the number of assistant professor slots available. URM and WR candidates are hired based on the number of slots available, and in proportion to their representation on the market (hence the influence of WR candidates on the URM hiring rate and vice versa). That is, the model posits no bias in hiring. In addition to baseline growth, the variable “URM Target Growth Rate” represents efforts from the scientific community to enhance workforce diversity. These additional URM scientists are initially added to the “URM other aspire” stock. The “transition rate” represents the percentage of URM other aspire scientists that enter the faculty market. As this rate increases, more URM candidates enter the academic job market. Candidates hired leave the system after six years, and the initial populations (P0) are derived from empirical data as described in methods. DOI: http://dx.doi.org/10.7554/eLife.21393.008
Figure 4.
Figure 4.. Model simulation: 1980-2013.
Scatter plots showing the performance of the model (open circles) compared to input data (filled circles) for the populations of (i) PhD graduates, (ii) assistant professors, and (iii) newly hired assistant professors for the (A) overall pool, (B) pool of URM scientists, and (C) pool of WR scientists. All R2 values are significant at the p<0.0001 level. DOI: http://dx.doi.org/10.7554/eLife.21393.009
Figure 5.
Figure 5.. Model predictions of URM assistant professor attainment.
Line graph showing model predictions for the percentage of URM PhD graduates (grey), and the corresponding percentages of URM assistant professors (black) as a function of various intervention strategies to increase faculty diversity in (A) short-term, through 2030, and (B) long-term, through 2080. All model runs assume an exponential increase in the number of PhDs from URM backgrounds. Thus, in all runs, the percentage of PhD scientists from URM backgrounds is 13.8% in 2030 and 73% in 2080. Simulations: (i) No change in transition rate (0.25%) or number of assistant professor positions. (ii) No change in transition rate (0.25%), increase the number of assistant professor positions by 100 per year, beginning in 2015. (iii) Increase transition rate to 10%, and no change in the number of assistant professor positions. (iv) Increase transition rate to 10% and increase the number of assistant professor positions by 100 per year, beginning in 2015. DOI: http://dx.doi.org/10.7554/eLife.21393.010

References

    1. Alberts B, Kirschner MW, Tilghman S, Varmus H. Rescuing US biomedical research from its systemic flaws. PNAS. 2014;111:5773–5777. doi: 10.1073/pnas.1404402111. - DOI - PMC - PubMed
    1. American Association of University Professors Stopping the tenure clock. [26 April, 2016];2004 http://www.aaup.org/issues/balancing-family-academic-workstopping-tenure...
    1. Association of American Medical Colleges Reports: U.S. medical school faculty. 1980 through 2013. [9 November, 2015];2015 https://services.aamc.org/famous/
    1. Clauset A, Arbesman S, Larremore DB. Systematic inequality and hierarchy in faculty hiring networks. Science Advances. 2015;1:e1400005. doi: 10.1126/sciadv.1400005. - DOI - PMC - PubMed
    1. Colon Ramos DA, Quiñones-Hinojosa A. Racism in the research lab. [05 August, 2016];New York Times. 2016 http://kristof.blogs.nytimes.com/2016/08/04/racism-in-the-research-lab/

LinkOut - more resources