. 2017 Jun 15;23(12):3061-3071.
doi: 10.1158/1078-0432.CCR-16-2083. Epub 2016 Nov 16.

Analysis of ROR1 Protein Expression in Human Cancer and Normal Tissues

Affiliations

Analysis of ROR1 Protein Expression in Human Cancer and Normal Tissues

Ashwini Balakrishnan et al. Clin Cancer Res. .

Abstract

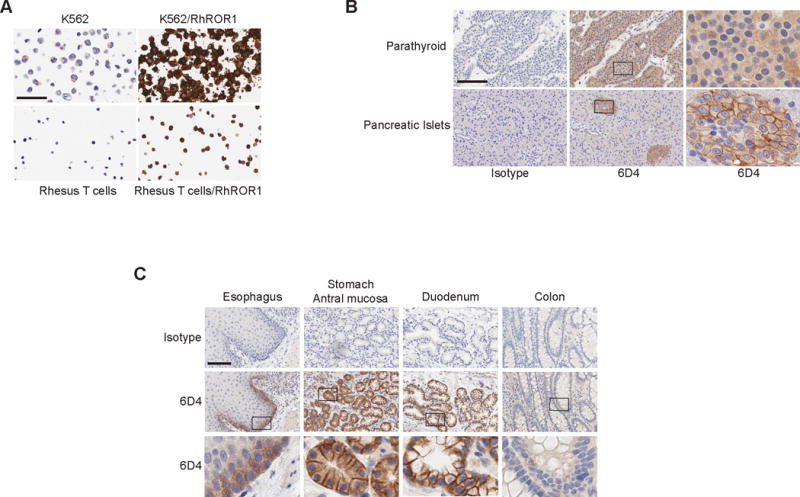
Purpose: This study examines cell surface ROR1 expression in human tumors and normal tissues. ROR1 is considered a promising target for cancer therapy due to putative tumor-specific expression, and multiple groups are developing antibodies and/or chimeric antigen receptor-modified T cells to target ROR1. On-target, off-tumor toxicity is a challenge for most nonmutated tumor antigens; however, prior studies suggest that ROR1 is absent on most normal tissues.Experimental Design: Our studies show that published antibodies lack sensitivity to detect endogenous levels of cell surface ROR1 by immunohistochemistry (IHC) in formalin-fixed, paraffin-embedded tissues. We developed a ROR1-specific monoclonal antibody (mAb) targeting the carboxy-terminus of ROR1 and evaluated its specificity and sensitivity in IHC.Results: The 6D4 mAb is a sensitive and specific reagent to detect cell surface ROR1 by IHC. The data show that ROR1 is homogenously expressed on a subset of ovarian cancer, triple-negative breast cancer, and lung adenocarcinomas. Contrary to previous findings, we found ROR1 is expressed on several normal tissues, including parathyroid; pancreatic islets; and regions of the esophagus, stomach, and duodenum. The 6D4 mAb recognizes rhesus ROR1, and ROR1 expression was similar in human and macaque tissues, suggesting that the macaque is a suitable model to evaluate safety of ROR1-targeted therapies.Conclusions: ROR1 is a promising immunotherapeutic target in many epithelial tumors; however, high cell surface ROR1 expression in multiple normal tissues raises concerns for on-target off-tumor toxicities. Clinical translation of ROR1-targeted therapies warrants careful monitoring of toxicities to normal organs and may require strategies to ensure patient safety. Clin Cancer Res; 23(12); 3061-71. ©2016 AACR.


Conflict of interest statement

Disclosure of potential conflicts of interest: A.B. B.G.H, J.R and S.R.R. are co-inventors of patents “ROR1-Specific Binding Proteins and Uses Thereof” (US Serial # 62/290,337) and “Anti-ROR1 Antibodies and Uses Thereof” (US Serial # 62/324,876) filed by Fred Hutchinson Cancer Research Center, and licensed to Juno Therapeutics. S.R.R. holds equity stake in, and is a cofounder of, Juno Therapeutics, and is on the advisory board for Cell Medica.

Figures

Figure 1
Figure 1
IHC staining of FFPE ROR1+ cells with the 6D4 mAb. (A) IHC Staining of ROR1 transfected and control cell lines (left panels), and ROR1+ tumor cell lines (Right panels). Scale bar represents 50μm. Paired flow cytometry staining with anti-ROR1 (Blue), anti-ROR2 (Red) and isotype (Grey) antibodies. (B) 6D4 staining of FFPE tonsil tissue and CLL and MCL lymph nodes. (C) Immunoblot analysis of ROR1 and ROR1+ cell lines with the 6D4 mAb. ROR1-variant 1 is expressed as a 130 kDa protein.
Figure 2
Figure 2
Membrane ROR1 staining in ovarian cancer using the 6D4 mAb. (A) Representative IHC images of subtypes of ovarian cancer samples stained with the 6D4 mAb. Scale bar represents 100μm. Regions in squares in middle panels are magnified 10X in bottom panels. (B) Percent of ROR1+ tumors in different subtypes of ovarian cancer.(C) Percent of ROR1high and ROR1low tumors in the ROR1+ ovarian cancer subset.
Figure 3
Figure 3
Membrane ROR1 staining in breast cancer using the 6D4 mAb. (A) Representative IHC images of subtypes of breast cancer tissue samples stained with the 6D4 mAb. Scale bar represents 100μm. Regions in squares in middle panels are magnified 10X in bottom panels. (B) Percent of ROR1+ tumors in different subtypes of breast cancer. (C) Percent of ROR1high and ROR1low tumors in the ROR1+ breast cancer subset.
Figure 4
Figure 4
Membrane ROR1 staining in lung cancer using the 6D4 mAb. (A) Representative IHC images of ROR1 expression in subtypes of lung cancer samples stained with the 6D4 mAb. Scale bar represents 100μm. Regions in squares in middle panels are magnified 10X in bottom panels. (B) Percent of ROR1+ tumors in different subtypes of lung cancer. (C) Percent of ROR1high and ROR1low tumors in the ROR1+ lung cancer subset. (D) Representative IHC images of ROR1 expression in primary and matched metastatic lymph nodes of ROR1+ lung adenocarcinomas. Scale bar represents 50μm.
Figure 5
Figure 5
ROR1 expression in normal human tissues. (A) Membrane ROR1 staining in human parathyroid and pancreatic islets with the 6D4 mAb. (B) ROR1 expression in different regions of the human gastrointestinal tract. Scale bar represents 100μm in A&B. Regions in squares in middle panels are magnified 10× in bottom panels in A&B. (C) Immunoblot of analysis of ROR1 in normal tissues using 6D4 mAb. (D) Immunoblot of analysis of ROR1high normal tissues using polyclonal anti-ROR1. (E) Cytokine production (IFN-γ, GM-CSF and IL-2) by ROR1-CAR T cells or mock transduced T cells after 24 hours of culture with different target cells at a T cell: target ratio of 2:1 (data is average of 2 independent experiments).
Figure 6
Figure 6
ROR1 expression in normal rhesus tissues by IHC. (A) Staining of ROR1 K562 and rhesus T cells, and K562 and rhesus T cells transfected with rhesus ROR1 with the 6D4 mAb. Scale bar represents 50μm. (B) ROR1 staining in rhesus parathyroid and pancreatic islets. (C) Representative IHC images of ROR1 staining in different regions of the macaque gastrointestinal tract. Scale bar represents 100μm. Regions in squares in middle panels are magnified 10× in right panels in B and bottom panels in C.

References

    1. Al-Shawi R, Ashton SV, Underwood C, Simons JP. Expression of the Ror1 and Ror2 receptor tyrosine kinase genes during mouse development. Development genes and evolution. 2001;211:161–71. - PubMed
    1. Baskar S, Kwong KY, Hofer T, Levy JM, Kennedy MG, Lee E, et al. Unique cell surface expression of receptor tyrosine kinase ROR1 in human B-cell chronic lymphocytic leukemia. Clinical cancer research : an official journal of the American Association for Cancer Research. 2008;14:396–404. - PubMed
    1. Chang H, Jung WY, Kang Y, Lee H, Kim A, Kim BH. Expression of ROR1, pAkt, and pCREB in gastric adenocarcinoma. Annals of diagnostic pathology. 2015;19:330–4. - PubMed
    1. Chien HP, Ueng SH, Chen SC, Chang YS, Lin YC, Lo YF, et al. Expression of ROR1 has prognostic significance in triple negative breast cancer. Virchows Archiv : an international journal of pathology. 2016 - PubMed
    1. Hudecek M, Schmitt TM, Baskar S, Lupo-Stanghellini MT, Nishida T, Yamamoto TN, et al. The B-cell tumor-associated antigen ROR1 can be targeted with T cells modified to express a ROR1-specific chimeric antigen receptor. Blood. 2010;116:4532–41. - PMC - PubMed

MeSH terms

Substances