. 2017 Jan 1;198(1):318-334.
doi: 10.4049/jimmunol.1502381. Epub 2016 Nov 16.

Integrin Cross-Talk Regulates the Human Neutrophil Response to Fungal β-Glucan in the Context of the Extracellular Matrix: A Prominent Role for VLA3 in the Antifungal Response

Affiliations

Integrin Cross-Talk Regulates the Human Neutrophil Response to Fungal β-Glucan in the Context of the Extracellular Matrix: A Prominent Role for VLA3 in the Antifungal Response

Courtney M Johnson et al. J Immunol. .

Abstract

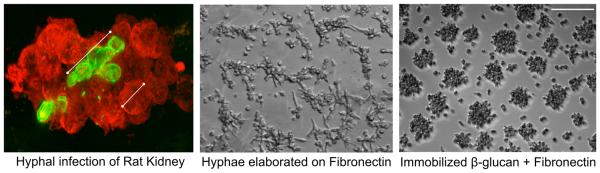
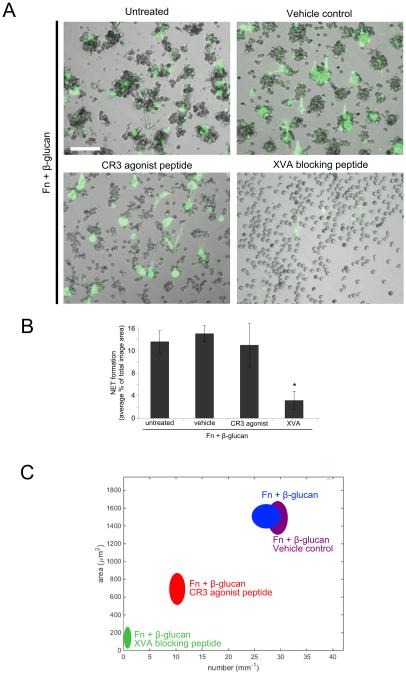
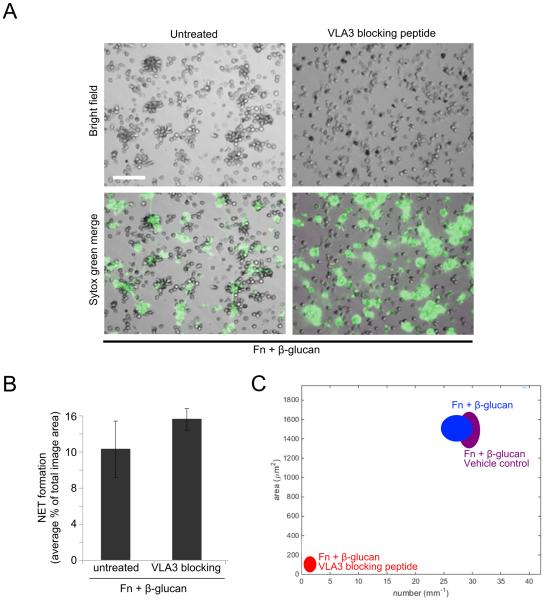
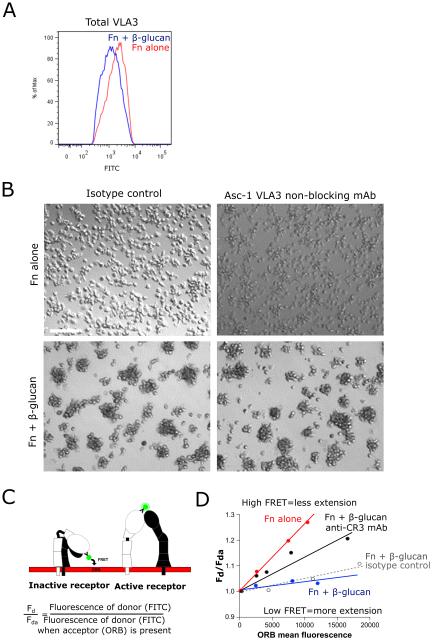
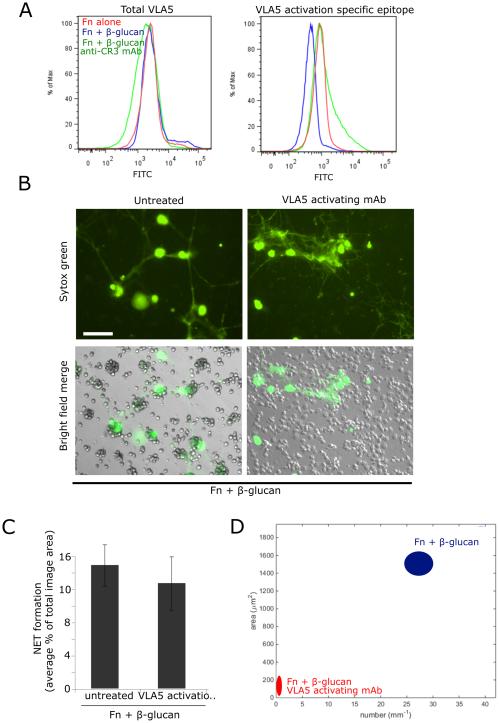
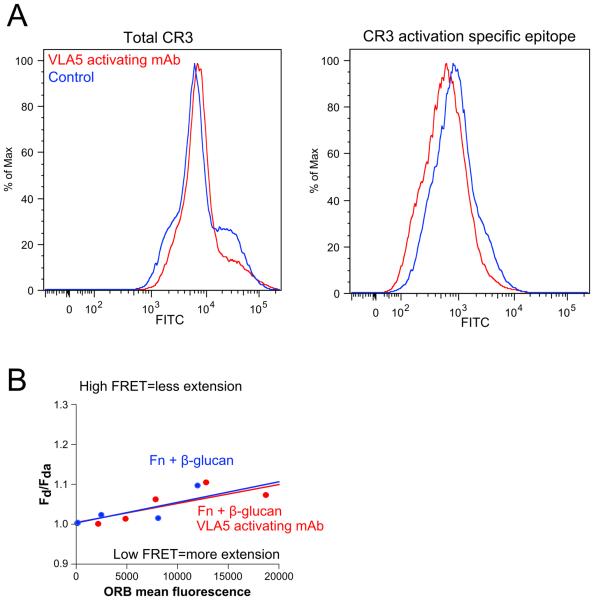
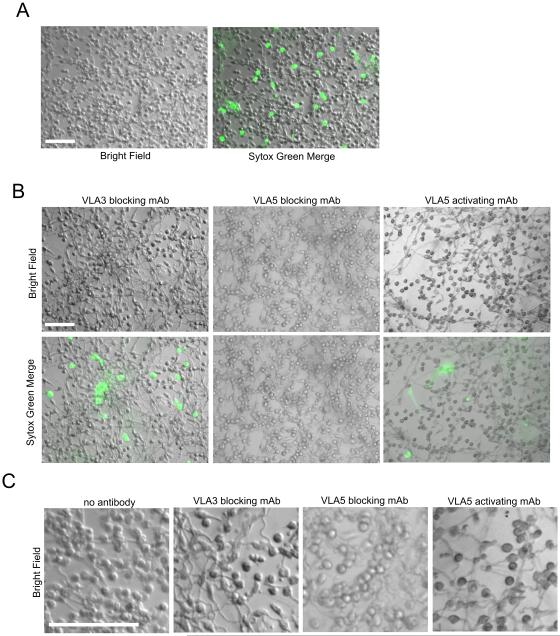
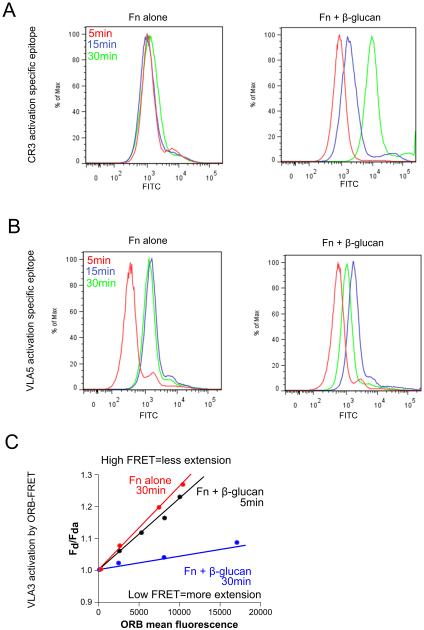
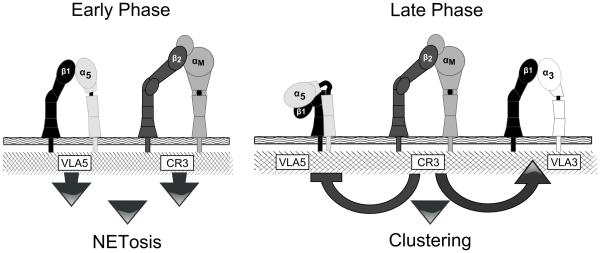
Candida albicans infection produces elongated hyphae resistant to phagocytic clearance compelling alternative neutrophil effector mechanisms to destroy these physically large microbial structures. Additionally, all tissue-based neutrophilic responses to fungal infections necessitate contact with the extracellular matrix (ECM). Neutrophils undergo a rapid, ECM-dependent mechanism of homotypic aggregation and NETosis in response to C. albicans mediated by the β2 integrin, complement receptor 3 (CR3, CD11b/CD18, αMβ2). Neither homotypic aggregation nor NETosis occurs when human neutrophils are exposed either to immobilized fungal β-glucan or to C. albicans hyphae without ECM. The current study provides a mechanistic basis to explain how matrix controls the antifungal effector functions of neutrophils under conditions that preclude phagocytosis. We show that CR3 ligation initiates a complex mechanism of integrin cross-talk resulting in differential regulation of the β1 integrins VLA3 (α3β1) and VLA5 (α5β1). These β1 integrins control distinct antifungal effector functions in response to either fungal β-glucan or C. albicans hyphae and fibronectin, with VLA3 inducing homotypic aggregation and VLA5 regulating NETosis. These integrin-dependent effector functions are controlled temporally whereby VLA5 and CR3 induce rapid, focal NETosis early after binding fibronectin and β-glucan. Within minutes, CR3 undergoes inside-out auto-activation that drives the downregulation of VLA5 and the upregulation of VLA3 to support neutrophil swarming and aggregation. Forcing VLA5 to remain in the activated state permits NETosis but prevents homotypic aggregation. Therefore, CR3 serves as a master regulator during the antifungal neutrophil response, controlling the affinity states of two different β1 integrins, which in turn elicit distinct effector functions.


Figures

Fig. 1
Fig. 1. Immobilized β-glucan + Fn supports neutrophil aggregation as seen in vivo in response to intact hyphae in tissue
(Left panel) C. albicans infection within a rat kidney shows robust aggregation of neutrophils (stained in red with an anti-neutrophil antibody) about a hyphal filament (stained in green an anti-β-glucan antibody specific for β-(1-3), β-(1-6)-linked glucose. (Center panel) Aggregation also forms in vitro on intact C. albicans hyphae elaborated on Fn. 20x bright field image. (Right panel) β-glucan immobilized with Fn supports robust neutrophil aggregation. 20x bright field image. Bar = 100μm.
Fig. 2
Fig. 2. Neutrophil clustering on Fn + β-glucan is dependent on CR3 and VLA3
(A) Human neutrophils, pretreated on ice with 10−9 M fMLP, were incubated at 37°C on tissue culture plastic coated with either 6 μg/ml Fn (Fn alone) or 6 μg/ml Fn + 1mg/ml β-glucan (Fn + β-glucan) in L-15 supplemented with 2 mg/ml glucose and 1 mM Mn++. Where indicated, neutrophils were additionally pretreated either with specific blocking mAbs to CR3 (clone 44abc), VLA5 (P1D6), VLA3 (MKID-2) or VLA6 (NKI-GoH3). After 30 min incubation, cells were fixed and multiple images were acquired per well. Bright field images acquired at 20x; bar = 100μm. (B) Neutrophil cluster formation was quantified using ImageJ and custom MatLab software and plotted as average clusters per mm (x-axis) vs. average cluster area in μm2 (y-axis) per condition. Ellipses represent 2D-SEM. Cells on Fn + β-glucan (blue) have a significant increase in both cluster number and area vs. cell on Fn alone (red). Cells on Fn + β-glucan pretreated with VLA5 blocking mAb (pink) or VLA6 blocking mAb (purple) showed no significant difference in clustering parameters vs. Fn + β-glucan (blue). Cells on Fn + β-glucan pretreated with VLA3 blocking mAb (black) or CR3 blocking mAb (green) a significant decrease in clustering parameters vs. Fn + β-glucan (blue) to levels statistically indistinguishable from cells on Fn alone (red). p < 0.001; ANOVA full factorial, post hoc Newman-Keuls. (C) CR3 adhesion to Fn + β-glucan results in auto-activation of CR3 but no significant change in surface expression. Representative histograms of neutrophils assayed as described on Fn (red), Fn + β-glucan (blue) or Fn + β-glucan in the presence of CR3 blocking mAb (green). After 30 min incubation, neutrophils were isolated and stained with directly conjugated mAbs for both total CR3 (top panel) and a CR3 activation specific epitope (bottom panel) and assayed by FACS. (D) The bar graph shows the average ratio of the MFI for cells adhered to Fn + β-glucan vs. Fn alone. Control conditions show no significant difference in staining for total CR3 (white bars) but a significant increase in CR3 activation specific epitope staining (grey bars) on Fn + β-glucan vs. Fn alone. Antibody blocking of VLA3 or VLA5 does not significantly influence the expression or activation of CR3 in response to Fn + β-glucan vs. Fn alone. Error bars represent SD. * p<0.001 Fn + β-glucan vs. Fn alone.
Fig. 3
Fig. 3. Neutrophil cluster formation and NETosis are regulated differentially by VLA3 and VLA5
(A) Human neutrophils assayed as in Fig. 2. After 30 min incubation, NET formation in the presence or absence of CR3, VLA3, or VLA5 blocking mAbs was visualized using Sytox green, imaged, and scored for NETs. Bright field and FITC images acquired at 20x; bar = 100μm. (B) Quantification of NET formation. NETs were visualized with Sytox green and multiple images were taken per well. Images were thresholded and gated to include NETs and exclude nuclei. NET formation was quantified as a percent area of the total imaged field. Well averages were ensemble averaged to generate this data. * p<0.001 vs. Fn alone; ANOVA full factorial, post hoc Newman-Keuls; Error bars represent SEM. (C) 80x magnification Scanning Electron Microscopy images of neutrophils demonstrating NET elaboration. Neutrophils were prepared as described above, adhered to Fn + β-glucan coated wells for 30min at 37° C, then fixed and prepared for Scanning Electron Microscopy. DNA NET fibrils spanning aggregated neutrophils indicated by arrowheads.
Fig. 4
Fig. 4. Dissolution of NETs by DNase I disrupts early, but not late, neutrophil clusters. Neutrophil clusters form in the absence of intact NET structures
(A) Human neutrophils assayed as in Fig. 2 on Fn + β-glucan. DNase I was added either at time 0 before any neutrophil clusters had formed, after 10 min when early clusters had formed and associated NETs could be visualized, or after 25 min with matured clusters and associated NETs could be visualized. After 30 min incubation, cluster formation and NETs in the presence or absence of DNase I was visualized using Sytox green and imaged. Bright field and FITC images acquired at 20x; bar = 100μm.
Fig. 5
Fig. 5. Leukadherin-1 allows NET formation but attenuates cluster formation. XVA143 blocks both cluster formation and NETosis
(A) Human neutrophils assayed as in Fig. 2. Where indicated, neutrophils were additionally pretreated either with CR3 agonist LA1, β2 allosteric antagonist XVA, or vehicle control. After 30 min incubation, NET formation was visualized using Sytox green, imaged, and scored for NETs. Bright field and FITC images acquired at 20x; bar = 100μm. (B) Quantification of NET formation. NETs were visualized with Sytox green and multiple images were taken per well. Images were thresholded and gated to include NETs and exclude nuclei. NET formation was quantified as a percent area of the total imaged field. Well averages were ensemble averaged to generate this data. * p<0.001 XVA vs. all other conditions; ANOVA full factorial, post hoc Newman-Keuls; Error bars represent SEM (C) Neutrophil cluster formation was quantified using ImageJ and custom MatLab software and plotted as average clusters per mm (x-axis) vs. average cluster area in μm2 (y-axis) per condition. Ellipses represent 2D-SEM. Cells on Fn + β-glucan pretreated with the XVA β2 antagonist (green) have a significant decrease in both cluster number and area vs. cells on Fn + β-glucan (blue). Cells on Fn + β-glucan pretreated with vehicle control (purple) showed no significant difference in clustering parameters vs. Fn + β-glucan (blue). Cells on Fn + β-glucan pretreated with the CR3 agonist LA1 (red) showed an intermediate phenotype with a significant decrease in clustering parameters vs. Fn + β-glucan (blue) but a significant increase in clustering parameters vs. cells pretreated with the XVA blocking peptide (green). p < 0.001; ANOVA full factorial, post hoc Newman-Keuls.
Fig. 6
Fig. 6. VLA3 blocking peptide, LXY1, blocks cluster formation but not NETosis
(A) Human neutrophils assayed as in Fig. 2 in the presence or absence of pretreatment with 25μg/ml VLA3 blocking peptide LXY1. After 30 min incubation, NET formation was visualized using Sytox green, imaged, and scored for NETs. Bright field and FITC images acquired at 20x; bar = 100μm. (B) Quantification of NET formation. NETs were visualized with Sytox green and multiple images were taken per well. Images were thresholded and gated to include NETs and exclude nuclei. NET formation was quantified as a percent area of the total imaged field. Well averages were ensemble averaged to generate this data. Error bars represent SEM. (C) Quantification of cluster formation. Cluster formation was quantified using custom MatLab software and plotted as average clusters per mm (x-axis) vs. average cluster area in μm2 (y-axis) per condition. Ellipses represent 2D-SEM. Cells on Fn + β-glucan pretreated with the LXY1 VLA3 blocking peptide (red) have a significant decrease in both cluster number and area vs. cells on Fn + β-glucan (blue). Cells on Fn + β-glucan pretreated with vehicle control (purple) showed no significant difference in clustering parameters vs. Fn + β-glucan (blue). p < 0.001; ANOVA full factorial, post hoc Newman-Keuls.
Fig. 7
Fig. 7. VLA3 activation is significantly increased on Fn + β-glucan vs. Fn-coated surfaces and is mediated by CR3
(A) Human neutrophils assayed as in Fig. 2. After 30 min incubation, neutrophils were isolated and stained with a directly conjugated mAb for a VLA3. FACS histogram showing total VLA3 on Fn (red) and Fn + β-glucan (blue). (B) Human neutrophils assayed as in Fig. 2 in the presence of the non-function blocking VLA3 mAb ASC-1 or isotype control. After 30 min incubation, bright field images acquired at 20x; bar = 100μm. (C) Shown is a schematic demonstrating the loss of FRET between ORB membrane dye and FITC-conjugated VLA3 mAb upon the extension of the extracellular domain. (D) Human neutrophils assayed as in Fig. 2 in the presence or absence of CR3 blocking mAb (44abc) or isotype control. After 30 min incubation, neutrophils were isolated and stained with a directly conjugated mAb for a VLA3 (Asc-1). Neutrophils were then incubated with 0, 75, 200, or 400 nM ORB and then analyzed by FACS. Representative data are plotted as the fraction of donor mean fluorescence intensity in the absence of acceptor fluorophore (Fd) to that in the presence of acceptor fluorophore (Fda) on the y-axis (Fd/Fda) vs. ORB mean fluorescence on the x-axis.
Fig. 8
Fig. 8. VLA5 shows a CR3-dependent reduction in activity on Fn + β-glucan vs. Fn-coated surfaces. Driving VLA5 activation with an activating mAb blocks cluster formation but not NETosis, suggesting that an active inhibition of VLA5 is required for cluster formation
(A) Human neutrophils assayed as in Fig. 2. After 30 min incubation, neutrophils were isolated and stained with a directly conjugated mAb for either total VLA5 (P1D6) or an activation specific epitope of VLA5 (SNAKA51). FACS histogram showing VLA5 staining of cells adhered to Fn (red), Fn + β-glucan (blue), or Fn + β-glucan after pretreatment with a CR3-blocking mAb (green). (B) Human neutrophils assayed as above in the presence or absence of pretreatment with VLA5 activating mAb. After 30 min incubation, NET formation was visualized using Sytox green, imaged, and scored for NETs. Bright field and FITC images acquired at 20x; bar = 100μm. (C) Quantification of NET formation. NETs were visualized with Sytox green and multiple images were taken per well. Images were thresholded and gated to include NETs and exclude nuclei. NET formation was quantified as a percent area of the total imaged field. Well averages were ensemble averaged to generate this data. Error bars represent SEM. (D) Quantification of cluster formation. Cluster formation was quantified using custom MatLab software and plotted as average clusters per mm (x-axis) vs. average cluster area in μm2 (y-axis) per condition. Ellipses represent 2D-SEM. Cells on Fn + β-glucan pretreated with the VLA5 activating mAb (red) have a significant decrease in both cluster number and area vs. cells on Fn + β-glucan (blue). p < 0.001; ANOVA full factorial, post hoc Newman-Keuls.
Fig. 9
Fig. 9. Driving VLA5 activation does not affect CR3 expression or activation, providing additional evidence dismissing β1 to β2 cross talk in this system. Additionally, driving VLA5 activation does not affect VLA3 activation, suggesting that VLA5’s role in the regulation of cluster formation is downstream of CR3 and VLA3
Human neutrophils assayed as in Fig. 2 in the presence or absence of pretreatment with VLA5 activating mAb (SNAKA51). (A) After 30 min incubation, neutrophils were isolated and stained with directly conjugated mAbs for both total CR3 (ICRF44) and a CR3 activation specific epitope (CBRM1/5). FACS histograms showing total CR3 (left) and CR3 activation (right) on Fn and Fn + β-glucan for control cells (blue) and cells treated with the VLA5 activating mAb (red). (B) After 30 min incubation, neutrophils were isolated and stained with a directly conjugated mAb for a VLA3 (ASC-1). Neutrophils were then incubated with 0, 75, 200, or 400 nM ORB and then analyzed by FACS. Representative data are plotted as the fraction of donor mean fluorescence intensity in the absence of acceptor fluorophore (Fd) to that in the presence of acceptor fluorophore (Fda) on the y-axis (Fd/Fda) vs. ORB mean fluorescence on the x-axis.
Fig. 10
Fig. 10. Behavior of human neutrophils in response to intact hyphae elaborated in the context of Fn show that NET formation and clustering can be decoupled in response to intact hyphae
C. albicans blastoconidia were allowed to elaborate into hyphae on tissue culture plastic coated with 10 μg/ml Fn in YPD at 37°C. Hyphae were washed and human neutrophils, pretreated on ice with 10−9 M fMLP, were added and incubated at 37°C in L-15 supplemented with 2 mg/ml glucose and 1 mM Mn++. After 30 min incubation, NET formation was visualized using Sytox green, imaged, and scored for cluster formation and NETs with (A) control cells and (B) neutrophils that were additionally pretreated either with specific mAbs to block VLA5 (P1D6) or VLA3 (MKID-2) or to activate VLA5 (SNAKA51). Bright field and FITC images acquired at 20x; bar = 100μm. (C) Enlarged images showing cluster aggregation to hyphae.
Fig. 11
Fig. 11. A time course analysis of integrin activation in neutrophils adhered to Fn + β-glucan supports temporal model of regulation
Human neutrophils assayed as in Fig. 2 (A) Human neutrophils, pretreated on ice with 10−9 M fMLP, were incubated at 37°C on tissue culture plastic coated with either Fn alone or 6 Fn + β-glucan in L-15 supplemented with 2 mg/ml glucose and 1 mM Mn++. After 5, 15, and 30 min incubation, cells were isolated and stained with directly conjugated mAbs for a CR3 activation specific epitope (CBRM1/5) or a VLA5 activation specific epitope (SNAKA51) and assayed by FACS. FACS histograms showing CR3 activation (A) and VLA5 activation (B) for cells adhered to Fn alone (left panel) and Fn + β-glucan (right panel) for 5 min (red), 15 min (blue), or 30 min (green). (C) Neutrophils assayed as described above. After 5 min and 30 min incubation, neutrophils were isolated and stained with a directly conjugated mAb for VLA3 (ASC-1). Neutrophils were then incubated with 0, 75, 200, or 400 nM ORB and then analyzed by FACS. Representative data are plotted as the fraction of donor mean fluorescence intensity in the absence of acceptor fluorophore (Fd) to that in the presence of acceptor fluorophore (Fda) on the y-axis (Fd/Fda) vs. ORB mean fluorescence on the x-axis.
Fig. 12
Fig. 12. Two- stage model of integrin cross-talk in mediating neutrophil clustering and NETosis on Fn + β-glucan that decouples clustering and NET formation
We propose an early stage of VLA5 and CR3 adhesion to Fn + β-glucan that triggers NETosis and subsequent CR3 inside-out auto activation that leads to a later stage β2 to β1 cross-talk that inactivates VLA5 and activates VLA3 leading to characteristic neutrophil clustering around NETotic foci.

References

    1. Wisplinghoff H, Bischoff T, Tallent SM, Seifert H, Wenzel RP, Edmond MB. Nosocomial bloodstream infections in US hospitals: analysis of 24,179 cases from a prospective nationwide surveillance study. Clin. Infect. Dis. 2004;39:309–317. - PubMed
    1. Marr KA, Carter RA, Crippa F, Wald A, Corey L. Epidemiology and outcome of mould infections in hematopoietic stem cell transplant recipients. Clin. Infect. Dis. 2002;34:909–917. - PubMed
    1. Horn DL, Neofytos D, Anaissie EJ, Fishman JA, Steinbach WJ, Olyaei AJ, Marr KA, Pfaller MA, Chang CH, Webster KM. Epidemiology and outcomes of candidemia in 2019 patients: data from the prospective antifungal therapy alliance registry. Clin. Infect. Dis. 2009;48:1695–1703. - PubMed
    1. Zaoutis TE, Argon J, Chu J, Berlin JA, Walsh TJ, Feudtner C. The epidemiology and attributable outcomes of candidemia in adults and children hospitalized in the United States: a propensity analysis. Clin. Infect. Dis. 2005;41:1232–1239. - PubMed
    1. Miller LG, Hajjeh RA, Edwards JE., Jr. Estimating the cost of nosocomial candidemia in the united states. Clin. Infect. Dis. 2001;32:1110. - PubMed

MeSH terms