

EEG Oscillations Are Modulated in Different Behavior-Related Networks during Rhythmic Finger Movements
- PMID: 27852775
- PMCID: PMC6705645
- DOI: 10.1523/JNEUROSCI.1739-16.2016
EEG Oscillations Are Modulated in Different Behavior-Related Networks during Rhythmic Finger Movements
Abstract
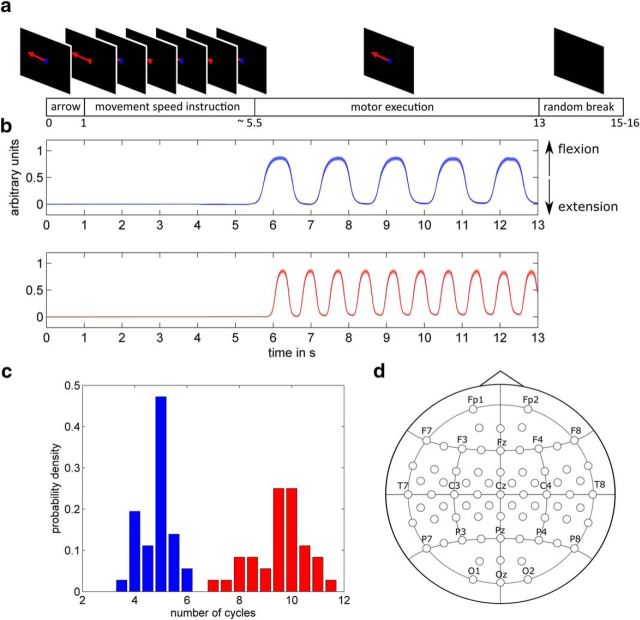
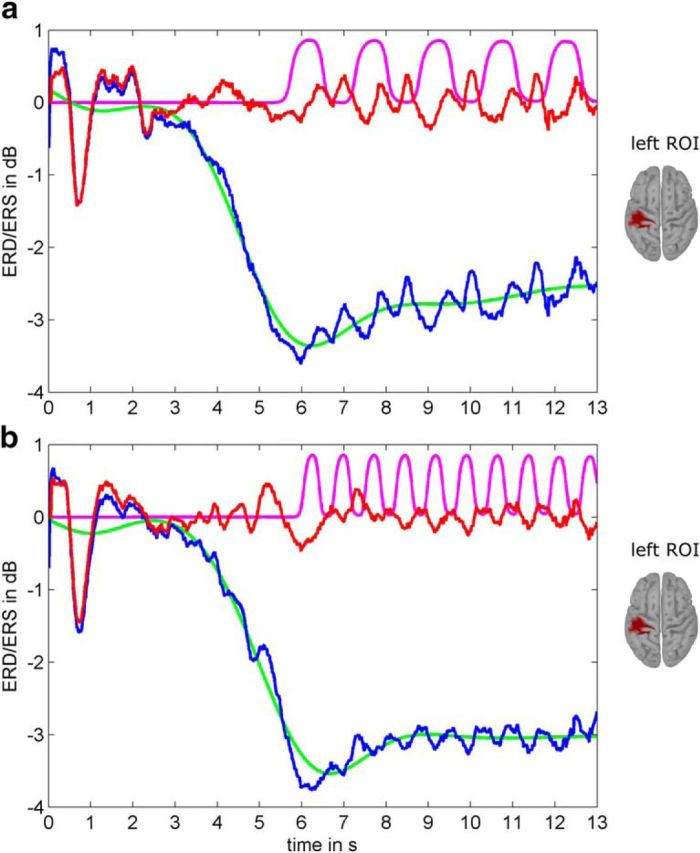
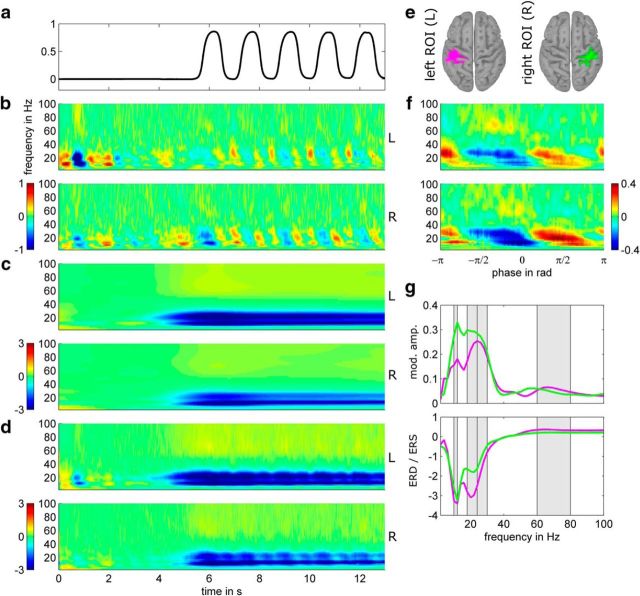
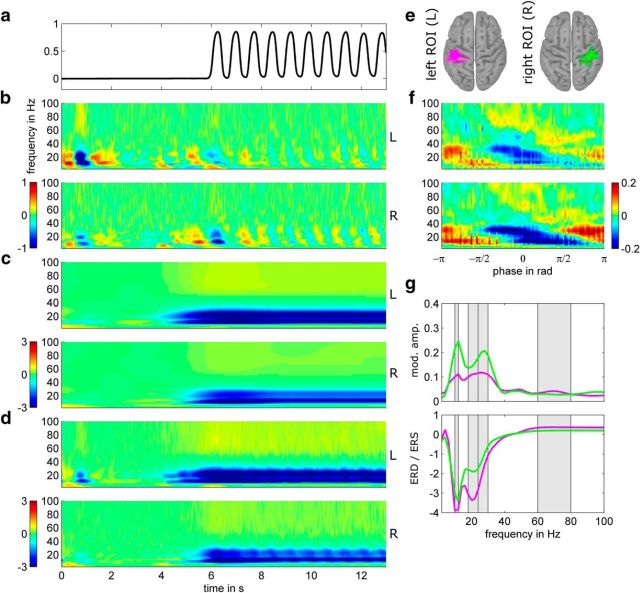
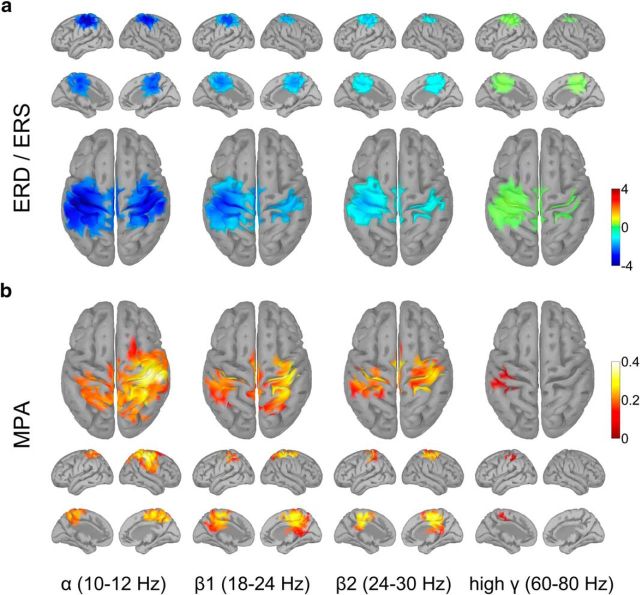
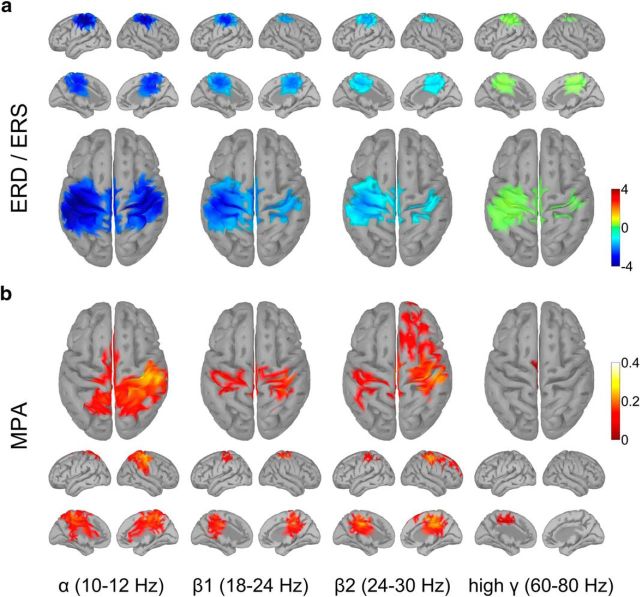
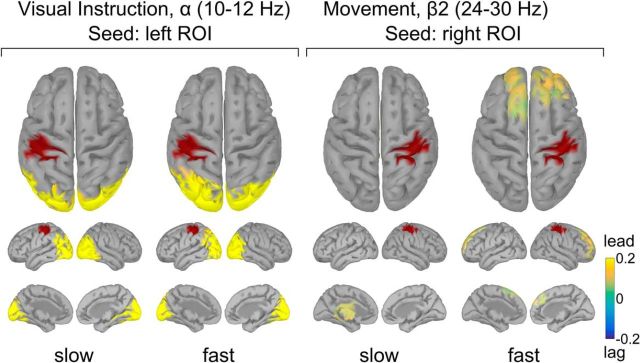
Sequencing and timing of body movements are essential to perform motoric tasks. In this study, we investigate the temporal relation between cortical oscillations and human motor behavior (i.e., rhythmic finger movements). High-density EEG recordings were used for source imaging based on individual anatomy. We separated sustained and movement phase-related EEG source amplitudes based on the actual finger movements recorded by a data glove. Sustained amplitude modulations in the contralateral hand area show decrease for α (10-12 Hz) and β (18-24 Hz), but increase for high γ (60-80 Hz) frequencies during the entire movement period. Additionally, we found movement phase-related amplitudes, which resembled the flexion and extension sequence of the fingers. Especially for faster movement cadences, movement phase-related amplitudes included high β (24-30 Hz) frequencies in prefrontal areas. Interestingly, the spectral profiles and source patterns of movement phase-related amplitudes differed from sustained activities, suggesting that they represent different frequency-specific large-scale networks. First, networks were signified by the sustained element, which statically modulate their synchrony levels during continuous movements. These networks may upregulate neuronal excitability in brain regions specific to the limb, in this study the right hand area. Second, movement phase-related networks, which modulate their synchrony in relation to the movement sequence. We suggest that these frequency-specific networks are associated with distinct functions, including top-down control, sensorimotor prediction, and integration. The separation of different large-scale networks, we applied in this work, improves the interpretation of EEG sources in relation to human motor behavior.
Significance statement: EEG recordings provide high temporal resolution suitable to relate cortical oscillations to actual movements. Investigating EEG sources during rhythmic finger movements, we distinguish sustained from movement phase-related amplitude modulations. We separate these two EEG source elements motivated by our previous findings in gait. Here, we found two types of large-scale networks, representing the right fingers in distinction from the time sequence of the movements. These findings suggest that EEG source amplitudes reconstructed in a cortical patch are the superposition of these simultaneously present network activities. Separating these frequency-specific networks is relevant for studying function and possible dysfunction of the cortical sensorimotor system in humans as well as to provide more advanced features for brain-computer interfaces.
Keywords: EEG source imaging; finger movements; large-scale networks; neural oscillations; sensorimotor system; spectral profiles.
Copyright © 2016 the authors 0270-6474/16/3611671-11$15.00/0.
Figures
Comment in
-
EEG oscillations: how are they modulated during different phases of repetitive movements?J Neurophysiol. 2017 Jul 1;118(1):4-6. doi: 10.1152/jn.00105.2017. Epub 2017 Mar 8. J Neurophysiol. 2017. PMID: 28275058 Free PMC article.
Similar articles
-
Effective Connectivity of Cortical Sensorimotor Networks During Finger Movement Tasks: A Simultaneous fNIRS, fMRI, EEG Study.Brain Topogr. 2016 Sep;29(5):645-60. doi: 10.1007/s10548-016-0507-1. Epub 2016 Jul 20. Brain Topogr. 2016. PMID: 27438589
-
Unraveling EEG correlates of unimanual finger movements: insights from non-repetitive flexion and extension tasks.J Neuroeng Rehabil. 2024 Dec 26;21(1):228. doi: 10.1186/s12984-024-01533-4. J Neuroeng Rehabil. 2024. PMID: 39726001 Free PMC article.
-
High and low gamma EEG oscillations in central sensorimotor areas are conversely modulated during the human gait cycle.Neuroimage. 2015 May 15;112:318-326. doi: 10.1016/j.neuroimage.2015.03.045. Epub 2015 Mar 24. Neuroimage. 2015. PMID: 25818687
-
How does the brain create rhythms?Ideggyogy Sz. 2010 Jan 30;63(1-2):13-23. Ideggyogy Sz. 2010. PMID: 20420120 Review.
-
Coherence of sequential movements and motor learning.J Clin Neurophysiol. 1999 Nov;16(6):520-7. doi: 10.1097/00004691-199911000-00004. J Clin Neurophysiol. 1999. PMID: 10600020 Review.
Cited by
-
Non-Invasive Brain-Computer Interfaces: State of the Art and Trends.IEEE Rev Biomed Eng. 2025;18:26-49. doi: 10.1109/RBME.2024.3449790. Epub 2025 Jan 28. IEEE Rev Biomed Eng. 2025. PMID: 39186407 Free PMC article. Review.
-
Neural signature of mobility-related everyday function in older adults at-risk of cognitive impairment.Neurobiol Aging. 2023 Feb;122:1-11. doi: 10.1016/j.neurobiolaging.2022.11.005. Epub 2022 Nov 9. Neurobiol Aging. 2023. PMID: 36463848 Free PMC article.
-
Human electrocortical dynamics while stepping over obstacles.Sci Rep. 2019 Mar 18;9(1):4693. doi: 10.1038/s41598-019-41131-2. Sci Rep. 2019. PMID: 30886202 Free PMC article.
-
Distinct cortical networks for hand movement initiation and directional processing: An EEG study.Neuroimage. 2020 Oct 15;220:117076. doi: 10.1016/j.neuroimage.2020.117076. Epub 2020 Jun 22. Neuroimage. 2020. PMID: 32585349 Free PMC article.
-
ECoG Beta Suppression and Modulation During Finger Extension and Flexion.Front Neurosci. 2020 Feb 13;14:35. doi: 10.3389/fnins.2020.00035. eCollection 2020. Front Neurosci. 2020. PMID: 32116497 Free PMC article.
References
-
- Baillet S, Mosher JC, Leahy RM. Electromagnetic brain mapping. IEEE Signal Processing Magazine. 2001;18:14–30. doi: 10.1109/79.962275. - DOI
Publication types
MeSH terms
LinkOut - more resources
Full Text Sources
Other Literature Sources