. 2017 Jan 6;292(1):82-99.
doi: 10.1074/jbc.M116.750950. Epub 2016 Nov 16.

MEG3 Long Noncoding RNA Contributes to the Epigenetic Regulation of Epithelial-Mesenchymal Transition in Lung Cancer Cell Lines

Affiliations

MEG3 Long Noncoding RNA Contributes to the Epigenetic Regulation of Epithelial-Mesenchymal Transition in Lung Cancer Cell Lines

Minoru Terashima et al. J Biol Chem. .

Abstract

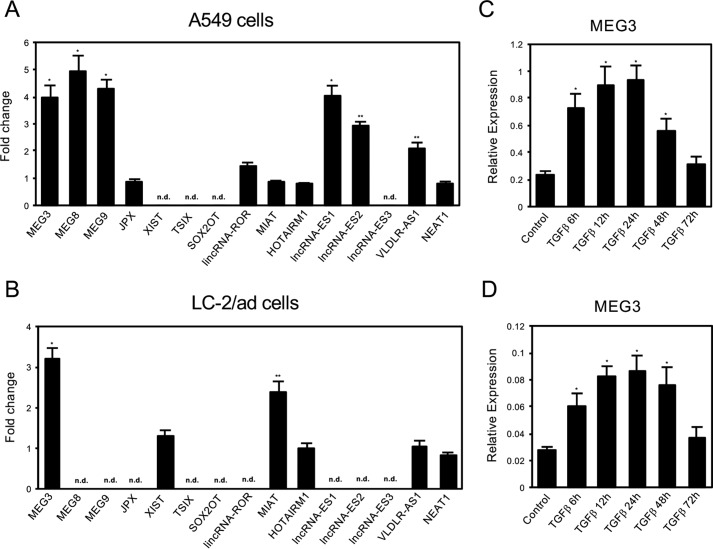
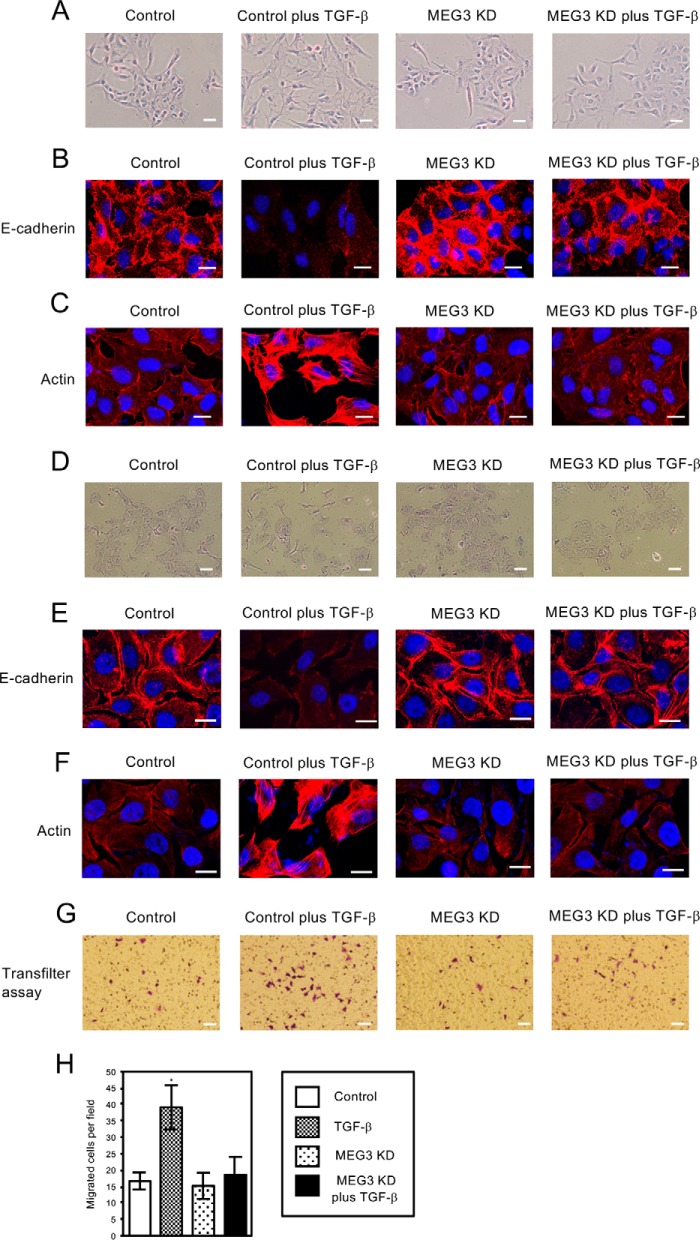
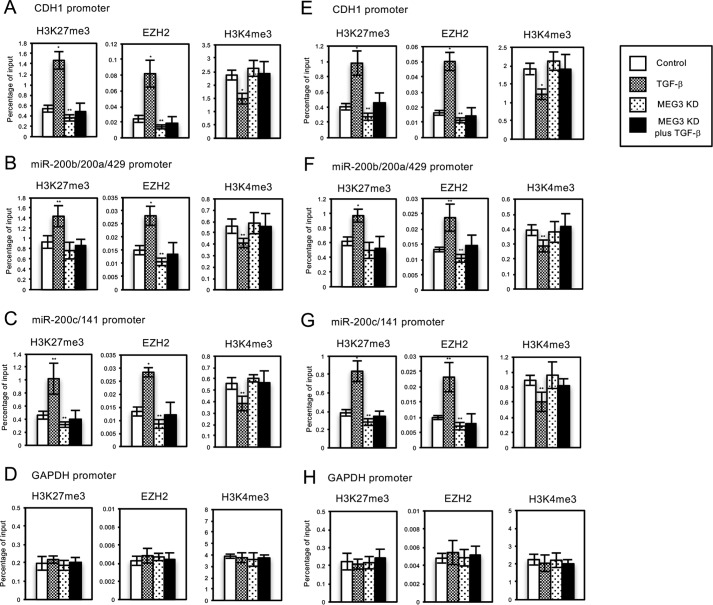
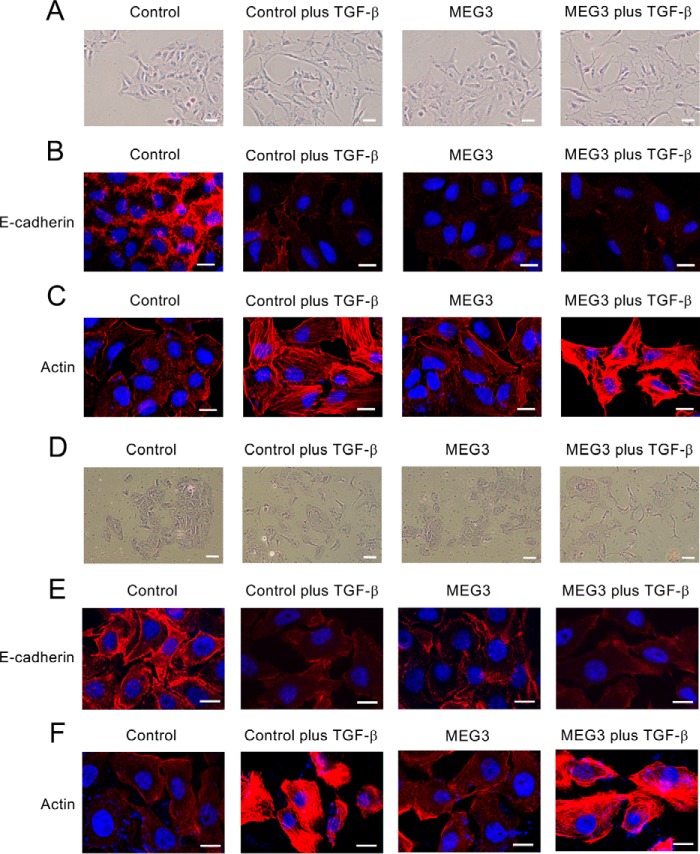
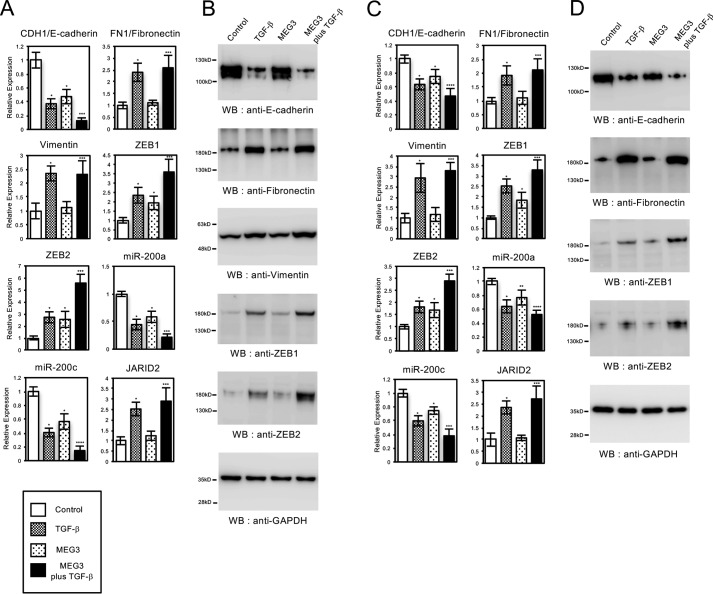
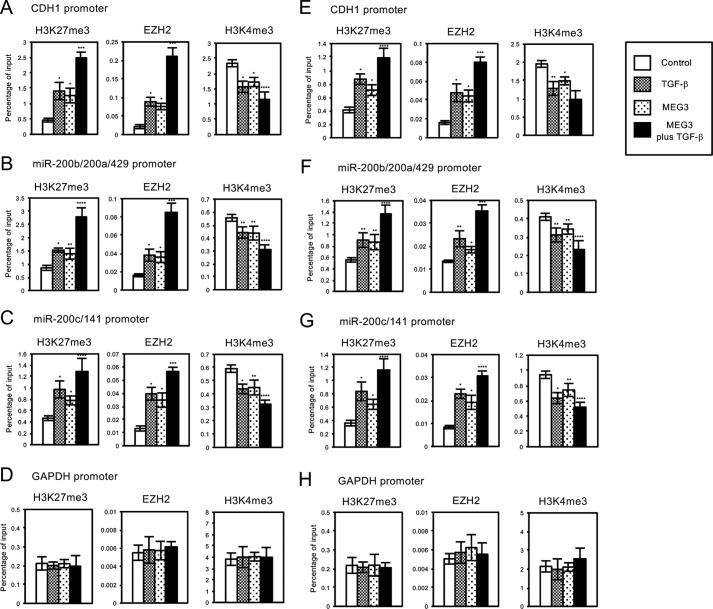
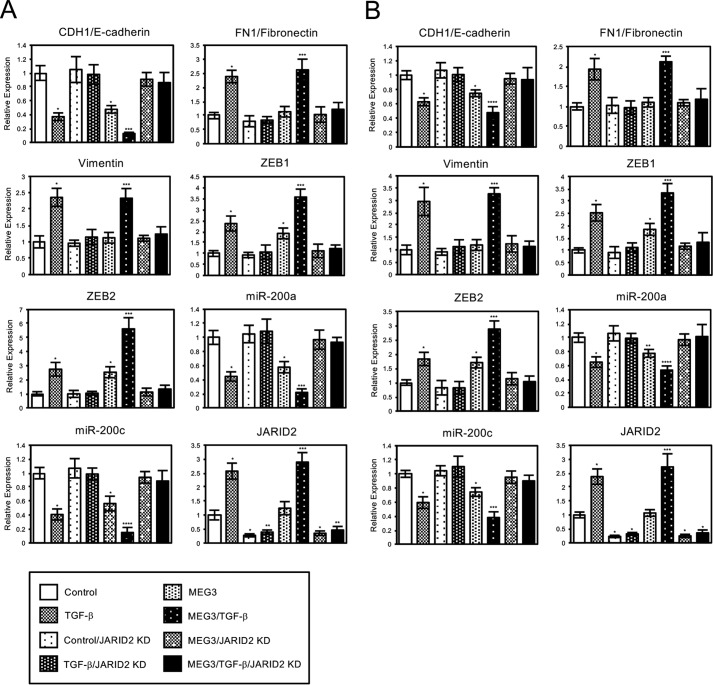
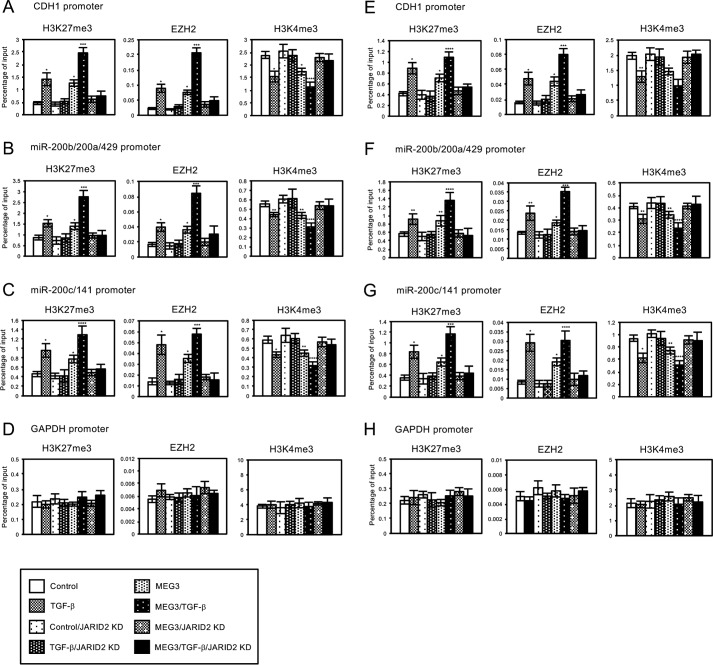
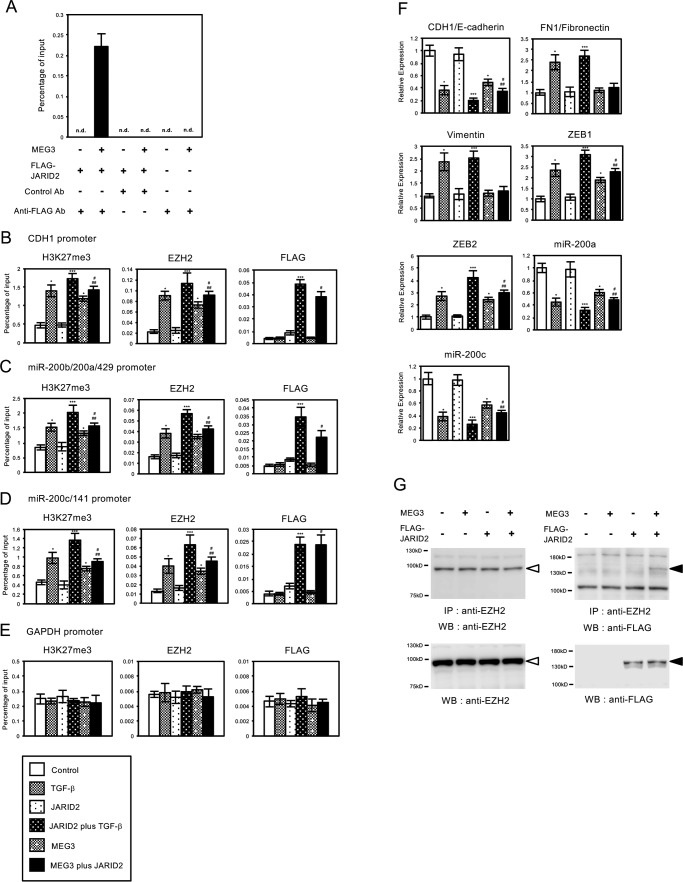
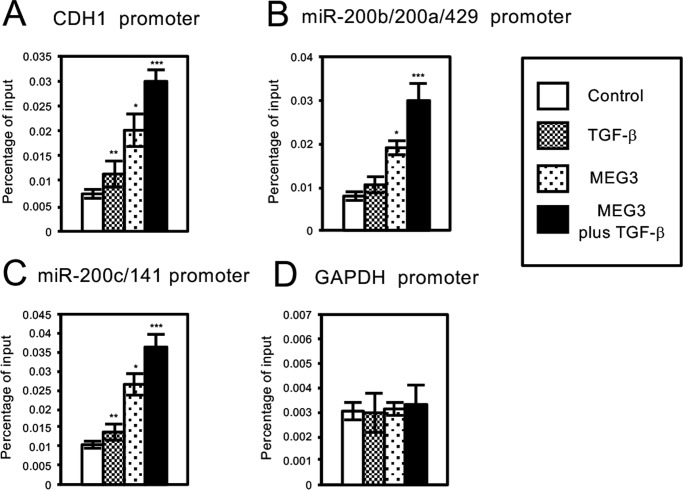
Histone methylation is implicated in a number of biological and pathological processes, including cancer development. In this study, we investigated the molecular mechanism for the recruitment of Polycomb repressive complex-2 (PRC2) and its accessory component, JARID2, to chromatin, which regulates methylation of lysine 27 of histone H3 (H3K27), during epithelial-mesenchymal transition (EMT) of cancer cells. The expression of MEG3 long noncoding RNA (lncRNA), which could interact with JARID2, was clearly increased during transforming growth factor-β (TGF-β)-induced EMT of human lung cancer cell lines. Knockdown of MEG3 inhibited TGF-β-mediated changes in cell morphology and cell motility characteristic of EMT and counteracted TGF-β-dependent changes in the expression of EMT-related genes such as CDH1, ZEB family, and the microRNA-200 family. Overexpression of MEG3 influenced the expression of these genes and enhanced the effects of TGF-β in their expressions. Chromatin immunoprecipitation (ChIP) revealed that MEG3 regulated the recruitment of JARID2 and EZH2 and histone H3 methylation on the regulatory regions of CDH1 and microRNA-200 family genes for transcriptional repression. RNA immunoprecipitation and chromatin isolation by RNA purification assays indicated that MEG3 could associate with JARID2 and the regulatory regions of target genes to recruit the complex. This study demonstrated a crucial role of MEG3 lncRNA in the epigenetic regulation of the EMT process in lung cancer cells.

Keywords: cancer biology; epithelial-mesenchymal transition (EMT); histone methylation; long noncoding RNA (long ncRNA, lncRNA); transcription regulation.


Figures

FIGURE 1.
FIGURE 1.
Expression of long noncoding RNAs during TGF-β-induced EMT of A549 and LC-2/ad lung cancer cells. A and B, QRT-PCR analysis was performed to detect the expression of various lncRNAs, which were reported to be implicated in ES cells or iPS cells, in A549 cells (A), and LC-2/ad (B) cells before and after the treatment of 1 ng/ml TGF-β (24 h). Fold changes were calculated and presented. n.d. means not detected (*, p < 0.01 compared with control; **, p < 0.05 compared with control). C and D, QRT-PCR was performed to detect the expression of MEG3 lncRNA in A549 cells (C) and LC-2/ad (D) cells before and after the treatment of 1 ng/ml TGF-β (6, 12, 24, 48, and 72 h) (*, p < 0.01 compared with control).
FIGURE 2.
FIGURE 2.
Knockdown of MEG3 antagonized TGF-β-induced morphological changes of A549 and LC-2/ad cells and migratory activities of A549 cells. A and D, cell morphological changes of A549 (A) and LC-2/ad (D) cells after TGF-β treatment. A549 or LC-2/ad cells were infected with retroviruses expressing control shRNA or MEG3 shRNA#1 (described as MEG3 KD) without or with the treatment of 1 ng/ml TGF-β for 6 days. Cells were stained with 0.4% crystal violet. Scale bars, 20 μm. B and E, immunofluorescence images of cells showing the localization of E-cadherin. The cells were treated without or with TGF-β for 48 h. The panels of A549 (B) or LC-2/ad (E) cells with the same arrangement with A or D were stained with anti-E-cadherin antibody and DAPI. Scale bars, 10 μm. C and F, fluorescence images of A549 (C) and LC-2/ad (F) cells showing reorganization of actin cytoskeleton by staining with TRITC-phalloidin (Actin) and DAPI. The cells were treated without or with TGF-β for 48 h. Scale bars, 10 μm. G and H, MEG3 KD inhibited TGF-β-induced increase of migrated cells through the filter. Cells that migrated through the filter to the lower surface within 24 h were fixed and stained (G). The number of migrated cells was counted under a light microscope from at least five fields and three experiments, and the averages were calculated (H) (*, p < 0.01). Scale bars, 60 μm.
FIGURE 3.
FIGURE 3.
Knockdown of MEG3 influenced the TGF-β-dependent changes in the expression of EMT-related genes in A549 or LC-2/ad cells. A and C, QRT-PCR analysis was performed to detect the expression of CDH1/E-cadherin, FN1/fibronectin, vimentin, ZEB1, ZEB2, miR-200a, miR-200c, JARID2, PMEPA1, SMAD7, ID1, and ID2 in A549 (A) and LC-2/ad (C) cells infected with retroviruses expressing control shRNA or each MEG3 shRNA (MEG3 sh#1 and sh#2) with or without the treatment of 1 ng/ml TGF-β for 24 h (*, p < 0.01 compared with control; **, p < 0.05 compared with control; ***, p < 0.01 compared with the sample without TGF-β treatment; ****, p < 0.05 compared with the sample without TGF-β treatment). B and D, immunoblotting was performed to detect the expression of E-cadherin, fibronectin, vimentin, ZEB1, ZEB2, phosphorylated SMAD3 (p-SMAD3), and GAPDH proteins using the corresponding antibodies in A549 (B) and LC-2/ad (D) cells. WB, Western blotting.
FIGURE 4.
FIGURE 4.
Knockdown of MEG3 affected the TGF-β-induced regulation of histone H3 methylation and EZH2 recruitment on the regulatory regions of CDH1 gene and miR-200 gene clusters in A549 or LC-2/ad cells. A549 or LC-2/ad cells were infected with retroviruses expressing control shRNA or MEG3 shRNA#1 without or with TGF-β treatment. ChIP analyses of H3K27me3, EZH2, and H3K4me3 on the regulatory regions of CDH1 (A and E), miR-200b/200a/429 (B and F), miR-200c/141 (C and G), and GAPDH genes (D and H) in A549 (A–D) or LC-2/ad (E–H) cells are shown. The occupancies of methylated histones or EZH2 protein on the regions were analyzed by quantitative PCR. Percentage enrichment over input chromatin DNA was presented (*, p < 0.01 compared with control; **, p < 0.05 compared with control).
FIGURE 5.
FIGURE 5.
Overexpression of MEG3 reduced the expression of E-cadherin but did not induce the reorganization of actin cytoskeleton of A549 and LC-2/ad cells. A and D, cell morphological changes of A549 (A) or LC-2/ad (D) cells after TGF-β treatment. The cells were infected with the control retrovirus or the retrovirus expressing MEG3 without or with the treatment of 1 ng/ml TGF-β for 6 days and were stained with 0.4% crystal violet. Scale bars, 20 μm. B and E, immunofluorescence images of cells showing the localization of E-cadherin. The panels of A549 (B) or LC-2/ad (E) cells were stained with anti-E-cadherin antibody and DAPI. The cells were treated without or with TGF-β for 48 h. Scale bars, 10 μm. C and F, fluorescence images of A549 (C) and LC-2/ad (F) cells showing reorganization of actin cytoskeleton by staining with TRITC-phalloidin (Actin) and DAPI. Scale bars, 10 μm.
FIGURE 6.
FIGURE 6.
Overexpression of MEG3 influenced the expression of part of EMT-related genes in A549 and LC-2/ad cells. QRT-PCR analysis was performed to detect the expression of CDH1/E-cadherin, FN1/fibronectin, vimentin, ZEB1, ZEB2, miR-200a, miR-200c, and JARID2 in A549 (A) and LC-2/ad (C) cells infected with the control retrovirus or the retrovirus expressing MEG3 with or without treatment of TGF-β for 24 h (*, p < 0.01 compared with control; **, p < 0.05 compared with control; ***, p < 0.01 compared with the sample without TGF-β treatment; ****, p < 0.05 compared with the sample without TGF-β treatment). B and D, immunoblotting was performed to detect the expression of E-cadherin, fibronectin, vimentin, ZEB1, ZEB2, and GAPDH proteins using the corresponding antibodies in A549 (B) and LC-2/ad (D) cells.
FIGURE 7.
FIGURE 7.
Overexpression of MEG3 affected the regulation of histone H3 methylation and EZH2 recruitment on the regulatory regions of CDH1 gene and miR-200 gene clusters in A549 or LC-2/ad cells. A549 or LC-2/ad cells were infected with the control retrovirus or the retrovirus expressing MEG3 without or with TGF-β treatment. ChIP analyses of H3K27me3, EZH2, and H3K4me3 on the regulatory regions of CDH1 (A and E), miR-200b/200a/429 (B and F), miR-200c/141 (C and G), and GAPDH genes (D and H) in A549 (A–D) or LC-2/ad (E–H) cells are shown. The occupancies of methylated histones or EZH2 protein on the regions were analyzed by quantitative PCR (*, p < 0.01 compared with control; **, p < 0.05 compared with control; ***, p < 0.01 compared with the sample without TGF-β treatment; ****, p < 0.05 compared with the sample without TGF-β treatment). WB, Western blotting.
FIGURE 8.
FIGURE 8.
Knockdown of JARID2 cancelled MEG3-mediated changes in the expression of part of EMT-related genes in A549 and LC-2/ad cells. QRT-PCR analysis was performed to detect the expression of CDH1/E-cadherin, FN1/fibronectin, vimentin, ZEB1, ZEB2, miR-200a, miR-200c, and JARID2 in A549 (A) and LC-2/ad (B) cells infected with the control retrovirus or the retrovirus expressing MEG3 and/or the retrovirus expressing JARID2 shRNA without or with treatment of TGF-β for 24 h (*, p < 0.01 compared with control; **, p < 0.05 compared with control; ***, p < 0.01 compared with the sample without TGF-β treatment; ****, p < 0.05 compared with the sample without TGF-β treatment).
FIGURE 9.
FIGURE 9.
Knockdown of JARID2 inhibited MEG3-induced changes in the regulation of histone H3 methylation and EZH2 recruitment on the regulatory regions of CDH1 gene and miR-200 gene clusters in A549 or LC-2/ad cells. A549 or LC-2/ad cells were infected with the control retrovirus or the retrovirus expressing MEG3 and/or the retrovirus expressing JARID2 shRNA without or with TGF-β treatment. ChIP analyses of H3K27me3, EZH2, and H3K4me3 on the regulatory regions of CDH1 (A and E), miR-200b/200a/429 (B and F), miR-200c/141 (C and G), and GAPDH genes (D and H) in A549 (A–D) or LC-2/ad (E–H) cells are shown. The occupancies of methylated histones or EZH2 protein on the regions were analyzed by quantitative PCR (*, p < 0.01 compared with control; **, p < 0.05 compared with control; ***, p < 0.01 compared with the sample without TGF-β treatment; ****, p < 0.05 compared with the sample without TGF-β treatment).
FIGURE 10.
FIGURE 10.
MEG3 interacted with JARID2 and stimulated the interaction and recruitment of JARID2 and EZH2 on the regulatory regions of CDH1, miR-200a, and miR-200c genes for histone H3K27 methylation in A549 cells. A, interaction of MEG3 and JARID2 detected by RIP. A549 cells were infected with the various combinations (as indicated) of the retroviruses expressing MEG3 and FLAG-tagged JARID2. The cross-linked cell lysates were immunoprecipitated with control antibody (mouse IgG) or anti-FLAG antibody, and the co-precipitated RNA was transcribed to cDNA. QPCR was performed to detect the enrichment of MEG3 in the precipitates. n.d. means not detected. B–E, A549 cells were infected with the various combinations (as indicated) of the retroviruses without or with TGF-β treatment. ChIP analyses of H3K27me3, EZH2, and FLAG-tagged JARID2 on the regulatory regions of CDH1 (B), miR-200b/200a/429 (C), miR-200c/141 (D), and GAPDH genes (E) are shown (*, p < 0.01 compared with control; ***, p < 0.01 compared with the sample without TGF-β treatment; #, p < 0.01 compared with the sample of JARID2 overexpressed cells; ##, p < 0.05 compared with the sample of MEG3 overexpressed cells). F, QRT-PCR analysis was performed to detect the expression of CDH1/E-cadherin, FN1/fibronectin, vimentin, ZEB1, ZEB2, miR-200a, and miR-200c in A549 cells infected with the various combinations of the retroviruses (*, p < 0.01 compared with control; ***, p < 0.01 compared with the sample without TGF-β treatment; #, p < 0.01 compared with the sample of JARID2 overexpressed cells; ##, p < 0.05 compared with the sample of MEG3 overexpressed cells). G, interaction of JARID2 and EZH2 was enhanced by MEG3. A549 cell lysates were immunoprecipitated (IP) with anti-EZH2 antibody and then subjected to immunoblotting with anti-EZH2 (left upper panel) and anti-FLAG antibodies (right upper panel). The cell lysates were also directly subjected to immunoblotting with anti-EZH2 and anti-FLAG antibodies to see the expression level of endogenous EZH2 and FLAG-tagged JARID2 proteins (lower panels). Open and closed arrowheads indicate endogenous EZH2 protein and FLAG-tagged JARID2 protein, respectively. WB, Western blotting.
FIGURE 11.
FIGURE 11.
MEG3 could associate with the specific regulatory regions of CDH1, miR-200a, and miR-200c genes in A549 cells. ChIRP analyses of MEG3 on the regulatory regions of CDH1 (A), miR-200b/200a/429 (B), miR-200c/141 (C), and GAPDH genes (D) in A549 cells are shown. The cells were infected with the control retrovirus or the retrovirus expressing MEG3 with or without treatment of TGF-β. The cross-linked cell lysates were incubated with biotinylated DNA probes against MEG3 lncRNA, and the binding complexes were recovered by streptavidin-conjugated magnet beads. QPCR was performed to detect the enrichment of the specific regulatory regions that associated with MEG3 lncRNA. (*, p < 0.01 compared with control; **, p < 0.05 compared with control; ***, p < 0.01 comparing to the sample without TGF-β treatment).

Similar articles

Cited by

References

    1. Bannister A. J., and Kouzarides T. (2011) Regulation of chromatin by histone modifications. Cell Res. 21, 381–395 - PMC - PubMed
    1. Greer E. L., and Shi Y. (2012) Histone methylation: a dynamic mark in health, disease and inheritance. Nat. Rev. Genet. 13, 343–357 - PMC - PubMed
    1. Kooistra S. M., and Helin K. (2012) Molecular mechanisms and potential functions of histone demethylases. Nat. Rev. Mol. Cell Biol. 13, 297–311 - PubMed
    1. Suzuki T., Terashima M., Tange S., and Ishimura A. (2013) Roles of histone methyl-modifying enzymes in development and progression of cancer. Cancer Sci. 104, 795–800 - PMC - PubMed
    1. Suzuki T., Shen H., Akagi K., Morse H. C., Malley J. D., Naiman D. Q., Jenkins N. A., and Copeland N. G. (2002) New genes involved in cancer identified by retroviral tagging. Nat. Genet. 32, 166–174 - PubMed

MeSH terms

LinkOut - more resources