. 2017 Jan 18;91(3):e01934-16.
doi: 10.1128/JVI.01934-16. Print 2017 Feb 1.

Potential for Low-Pathogenic Avian H7 Influenza A Viruses To Replicate and Cause Disease in a Mammalian Model

Affiliations

Potential for Low-Pathogenic Avian H7 Influenza A Viruses To Replicate and Cause Disease in a Mammalian Model

Mark Zanin et al. J Virol. .

Abstract

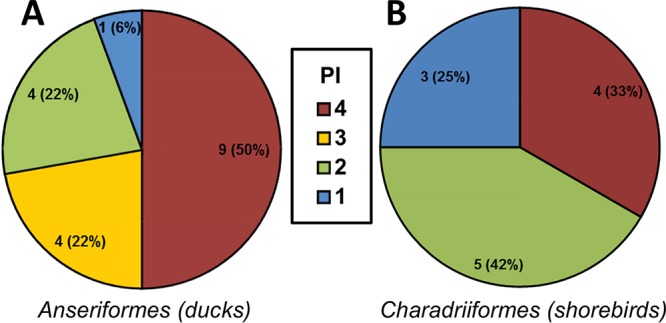
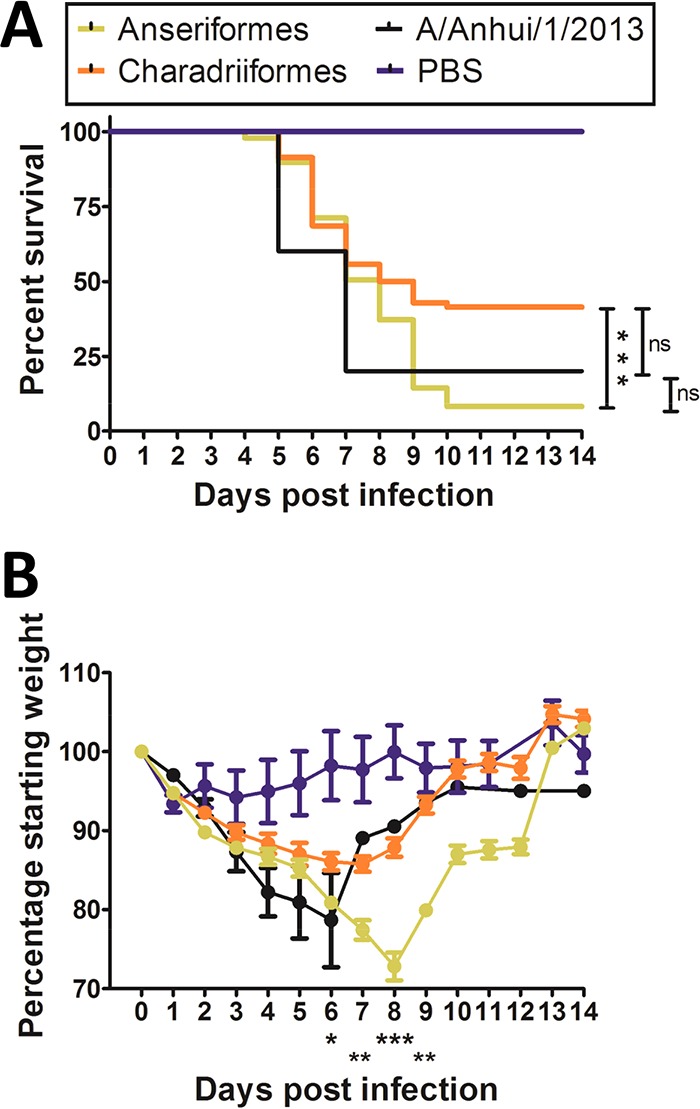
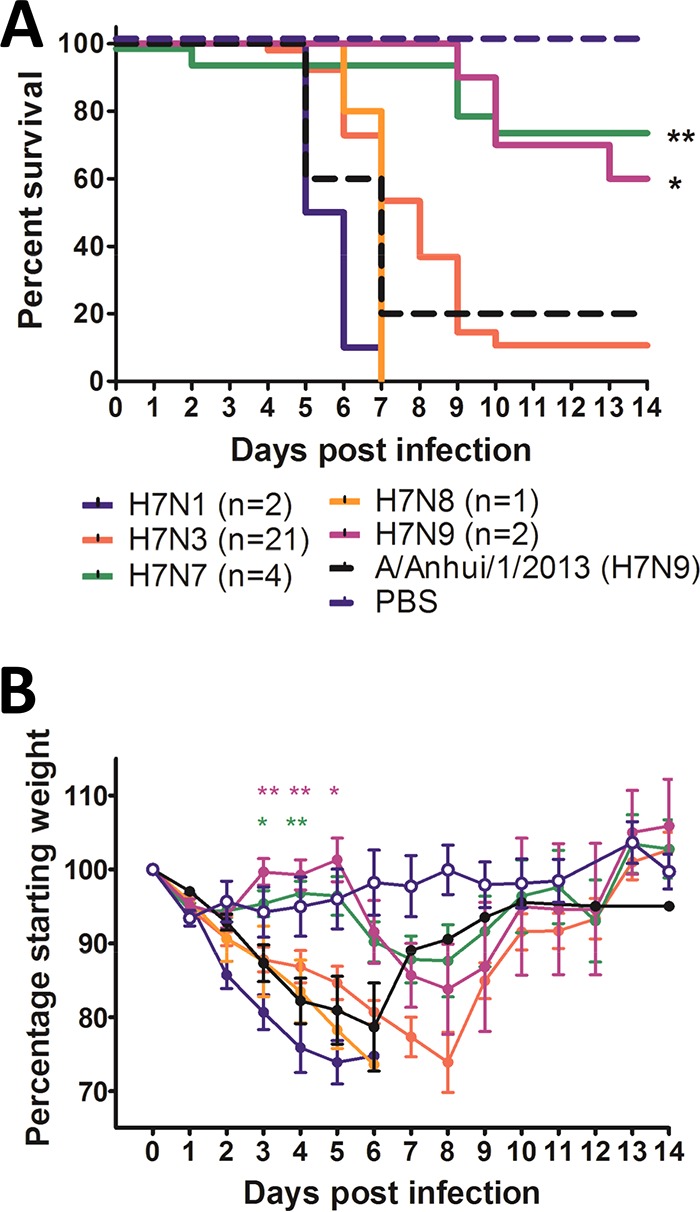
H7 subtype influenza A viruses are widely distributed and have been responsible for human infections and numerous outbreaks in poultry with significant impact. Despite this, the disease-causing potential of the precursor low-pathogenic (LP) H7 viruses from the wild bird reservoir has not been investigated. Our objective was to assess the disease-causing potential of 30 LP H7 viruses isolated from wild avian species in the United States and Canada using the DBA/2J mouse model. Without prior mammalian adaptation, the majority of viruses, 27 (90%), caused mortality in mice. Of these, 17 (56.7%) caused 100% mortality and 24 were of pathogenicity similar to that of A/Anhui/1/2013 (H7N9), which is highly pathogenic in mice. Viruses of duck origin were more pathogenic than those of shorebird origin, as 13 of 18 (72.2%) duck origin viruses caused 100% mortality while 4 of 12 (33.3%) shorebird origin viruses caused 100% mortality, despite there being no difference in mean lung viral titers between the groups. Replication beyond the respiratory tract was also evident, particularly in the heart and brain. Of the 16 viruses studied for fecal shedding, 11 were detected in fecal samples. These viruses exhibited a strong preference for avian-type α2,3-linked sialic acids; however, binding to mammalian-type α2,6-linked sialic acids was also detected. These findings indicate that LP avian H7 influenza A viruses are able to infect and cause disease in mammals without prior adaptation and therefore pose a potential public health risk.

Importance: Low-pathogenic (LP) avian H7 influenza A viruses are widely distributed in the avian reservoir and are the precursors of numerous outbreaks of highly pathogenic avian influenza viruses in commercial poultry farms. However, unlike highly pathogenic H7 viruses, the disease-causing potential of LP H7 viruses from the wild bird reservoir has not been investigated. To address this, we studied 30 LP avian H7 viruses isolated from wild avian species in the United States and Canada using the DBA/2J mouse model. Surprisingly, the majority of these viruses, 90%, caused mortality in mice without prior mammalian adaptation, and 56.7% caused 100% mortality. There was also evidence of spread beyond the respiratory tract and fecal shedding. Therefore, the disease-causing potential of LP avian H7 influenza A viruses in mammals may be underestimated, and these viruses therefore pose a potential public health risk.

Keywords: H7; avian viruses; influenza; viral pathogenesis.


Figures

FIG 1
FIG 1
Classification of H7 viruses by PI revealed that duck origin viruses were more pathogenic in mice than shorebird origin viruses. The pie charts show the number of duck origin (A) and shorebird origin (B) H7 viruses in each PI. PI-4 viruses were the most pathogenic on the basis of mortality and morbidity, while PI-1 viruses were the least pathogenic by these measures. Of the 18 duck origin viruses, 9 were classified as PI-4, 4 as PI-3, 4 as PI-2, and 1 as PI-1. Of the 12 shorebird origin viruses, 4 were classified as PI-4, none were PI-3, 5 were PI-2, and 3 were PI-1. The classifications are based on data presented in Table 1.
FIG 2
FIG 2
Duck (Anseriformes) origin H7 viruses cause greater mean mortality and weight loss in mice than shorebird (Charadriiformes) origin viruses. (A) The mean survival of mice inoculated with duck origin viruses was significantly less than that of mice inoculated with shorebird origin viruses and similar to that of mice inoculated with A/Anhui/1/2013 (H7N9). (B) Mean weight loss in mice inoculated with duck origin viruses was significantly greater on days 6 to 9 postinfection than that of mice inoculated with shorebird origin viruses and was similar to the mean weight loss in mice inoculated with A/Anhui/1/2013 (H7N9). *, P < 0.05; **, P < 0.01; ***, P < 0.001; ns, not significant. Error bars indicate standard errors of the means (SEM).
FIG 3
FIG 3
The pathogenicity of H7 influenza viruses was not restricted by NA subtype. (A) Classification by NA subtype revealed that H7N7 and H7N9 viruses were significantly less pathogenic than A/Anhui/1/2013 (H7N9). (B) Classification by NA subtype revealed that H7N7 and H7N9 viruses caused significantly less weight loss in mice on days 3 to 5 than A/Anhui/1/2013 (H7N9). The weight loss caused by viruses of other NA subtypes was similar to that of A/Anhui/1/2013 (H7N9). *, P < 0.05; **, P < 0.01. Error bars indicate SEM.
FIG 4
FIG 4
H7 viruses replicated in the lungs and showed limited replication in the brains of infected mice. (A) All viruses replicated in the lungs of inoculated mice. The mean viral lung titers of both duck (Anseriformes) and shorebird (Charadriiformes) origin viruses were similar. (B) Viral replication in the brain was limited to nine mice inoculated with duck origin viruses and seven mice inoculated with shorebird origin viruses, and titers were relatively low compared to lung viral titers. Error bars indicate SEM.
FIG 5
FIG 5
Progression of bronchointerstitial pneumonia in the lungs of mice infected with A/mallard/MN/AI08_5469/2008 (H7N3). (A) At 2 dpi, the bronchiolar epithelium was hyperplastic, the interstitium was congested, and alveolar septa were mildly thickened. (B) At 4 dpi, the bronchiolar epithelium was still slightly hyperplastic. Portions of the parenchyma displayed thickened cellular alveolar septa and mild infiltration of lymphocytes and histiocytes into the alveoli. Small amounts of hemorrhage were also seen in alveoli. (C) At 6 dpi, there was severe bronchointerstitial pneumonia. Bronchioles were either hyperplastic or necrotic. The parenchyma showed large areas of hypercellularity due to thickened cellular septa and filling of alveoli with moderate numbers of lymphocytes and histiocytes. There were also large areas of hemorrhage. (D) Uninfected lung. Sections were stained with hematoxylin and eosin. B, bronchiole; P, parenchyma; H, areas of hemorrhage. Scale bars = 200 μm. (E) The development of histopathologic changes in the lungs of mice inoculated with viruses classified as PI-4, PI-3, and PI-2 was similar in severity and progression. Histopathologic changes were scored 0 to 4: 0, unremarkable; 1, minimal; 2, mild; 3, moderate; 4, severe.
FIG 6
FIG 6
Progression of infection in the lungs of mice infected with A/mallard/MN/AI08_5469/2008 (H7N3). (A) Hyperplastic bronchiole at 2 dpi with many epithelial nuclei staining positive for influenza virus. (B) Epithelial cell nuclei in a bronchiole and nuclei of interstitial cells (the arrows point to two examples) both stained positive for influenza virus at 4 dpi. (C) Many epithelial cell nuclei in a bronchiole and multiple nuclei of interstitial cells (the arrows point to three examples) stained positive for influenza virus at 6 dpi. DAB chromogen was used to stain influenza virus-positive cells (brown), with hematoxylin as a counterstain (blue). B, bronchiole. Scale bars = 100 μm. (D) The amounts of influenza virus antigen detected in mice inoculated with viruses classified as PI-4, PI-3, and PI-2 were similar; however, less antigen was detected in mice inoculated with the PI-2 virus at 4 and 5 dpi than in mice inoculated with the PI-3 or PI-4 virus. The amount of influenza virus antigen detected by immunohistochemistry was scored subjectively 0 to 4: 0, none; 1, minimal; 2, mild; 3, moderate; and 4, severe.
FIG 7
FIG 7
Phylogenetic analysis revealed similarities between the HAs and NAs based on the PI. (A) The HAs of PI-4 viruses isolated between 2001 and 2006 clustered with the HA of the HPAI virus A/Canada/rv504/2004 (H7N3), and the HAs of two PI-4 viruses and one PI-2 virus isolated between 2010 and 2012 clustered with the HA of the HPAI virus A/Mexico/InDRE7218/2012 (H7N3). None of the HAs of these viruses were similar to that of the HPAI virus A/chicken/Chile/4957/2002 (H7N3). (B) The NAs of PI-4 viruses isolated between 2006 and 2009 clustered with the NA of A/Canada/rv504/2004 (H7N3). No other obvious clustering was observed between the NAs of the viruses studied here and those of the HPAI viruses. (C) Detail of the subtree highlighted by a frame in panel B. The neighbor-joining trees were constructed with the full amino acid-coding sequence of each gene segment of the viruses using MEGA6 and rooted to sequences from A/equine/Prague/1/1956 (H7N7). The percentages of replicate trees in which the associated taxa clustered together in the bootstrap test (1,000 replicates) are shown next to the branches. The evolutionary distances were computed using the Poisson correction method. The viruses were labeled according to their PI classifications.
FIG 8
FIG 8
Phylogenetic analysis revealed similarities between PB2, PB1, PA, and NPs based on the PI. (A) The PB2s of the HPAI viruses A/Mexico/InDRE7218/2012 (H7N3), A/Canada/rv504/2004 (H7N3), and A/chicken/SK/HR_00011/2007 (H7N3) clustered with each other and with those of PI-4 viruses. (B) PB1 of the HPAI virus A/Canada/rv504/2004 (H7N3) clustered with those of five PI-4 viruses and one PI-2 virus. (C) The PAs of the HPAI viruses A/Canada/rv504/2004 (H7N3) and A/chicken/SK/HR_00011/2007 (H7N3) clustered together, along with a those of PI-4 virus and several related PI-2 viruses. The PA of the HPAI virus A/chicken/Chile/4957/2002 (H7N3) also clustered with these viruses. The PA of A/Mexico/InDRE7218/2012 (H7N3) clustered with those of two PI-4 viruses and one PI-3 virus. (D) The NPs of A/Mexico/InDRE7218/2012 (H7N3) and A/Canada/rv504/2004 (H7N3) clustered with those of PI-4 viruses. The neighbor-joining trees were constructed with the full amino acid-coding sequence of each gene segment of the viruses using MEGA6 and rooted to sequences from A/equine/Prague/1/1956 (H7N7). The percentages of replicate trees in which the associated taxa clustered together in the bootstrap test (1,000 replicates) are shown next to the branches. The evolutionary distances were computed using the Poisson correction method. The viruses were labeled according to their PI classifications.
FIG 9
FIG 9
Phylogenetic analysis revealed that the M proteins of the viruses were similar and that two distinct groups of NS proteins were circulating. (A) The M proteins of all the viruses were similar. (B) Two clear branches were evident in the NS tree: allele A and allele B. The allele B branch contained the HPAI virus A/chicken/SK/HR_00011/2007 (H7N3) clustered with viruses with differing PIs. These NSs were also more similar to that of the HPAI virus A/chicken/Chile/4957/2002 (H7N3) than to those of the other viruses. The neighbor-joining trees were constructed with the full amino acid-coding sequence of each gene segment of the viruses using MEGA6 and rooted to sequences from A/equine/Prague/1/1956 (H7N7). The percentages of replicate trees in which the associated taxa clustered together in the bootstrap test (1,000 replicates) are shown next to the branches. The evolutionary distances were computed using the Poisson correction method. The viruses were labeled according to their PI classifications.
FIG 10
FIG 10
H7N3 viruses showed strong binding preferences for α2,3-linked sialic acids. Glycan binding arrays were comprised of α2,3-linked sialic acids (yellow shading) and α2,6-linked sialic acids (green shading). H7N3 viruses classified as PI-4 (A to F; red text), PI-3 (G and H; beige text), and PI-2 (I to K; green text), which caused 100%, 100%, and 80% mortality in mice, respectively, all showed strong preference for α2,3-linked sialic acids. There was some recognition of mammalian-like α2,6-linked sialic acids, particularly by A/shorebird/Delaware Bay/22/2006 (H7N3) (E) and A/mallard/Alberta/49/1976 (H7N3) (G). There were no indications that the binding preferences changed over time. Error bars indicate SEM.

References

    1. Abdelwhab EM, Veits J, Mettenleiter TC. 2014. Prevalence and control of H7 avian influenza viruses in birds and humans. Epidemiol Infect 142:896–920. doi: 10.1017/S0950268813003324. - DOI - PMC - PubMed
    1. Freidl GS, Meijer A, de Bruin E, de Nardi M, Munoz O, Capua I, Breed AC, Harris K, Hill A, Kosmider R, Banks J, von Dobschuetz S, Stark K, Wieland B, Stevens K, van der Werf S, Enouf V, van der Meulen K, Van Reeth K, Dauphin G, Koopmans M, FLURISK Consortium. 2014. Influenza at the animal-human interface: a review of the literature for virological evidence of human infection with swine or avian influenza viruses other than A(H5N1). Euro Surveill 19:20793. doi: 10.2807/1560-7917.ES2014.19.18.20793. - DOI - PubMed
    1. Gibson CA, Daniels RS, Oxford JS, McCauley JW. 1992. Sequence analysis of the equine H7 influenza virus haemagglutinin gene. Virus Res 22:93–106. doi: 10.1016/0168-1702(92)90037-A. - DOI - PubMed
    1. Kwon TY, Lee SS, Kim CY, Shin JY, Sunwoo SY, Lyoo YS. 2011. Genetic characterization of H7N2 influenza virus isolated from pigs. Vet Microbiol 153:393–397. doi: 10.1016/j.vetmic.2011.06.011. - DOI - PubMed
    1. Webster RG, Hinshaw VS, Bean WJ, Van Wyke KL, Geraci JR, St Aubin DJ, Petursson G. 1981. Characterization of an influenza A virus from seals. Virology 113:712–724. doi: 10.1016/0042-6822(81)90200-2. - DOI - PubMed

MeSH terms

Substances

LinkOut - more resources