. 2017 Jan 15;28(2):285-295.
doi: 10.1091/mbc.E16-07-0526. Epub 2016 Nov 16.

Ras and Rab interactor 1 controls neuronal plasticity by coordinating dendritic filopodial motility and AMPA receptor turnover

Affiliations

Ras and Rab interactor 1 controls neuronal plasticity by coordinating dendritic filopodial motility and AMPA receptor turnover

Zsófia Szíber et al. Mol Biol Cell. .

Abstract

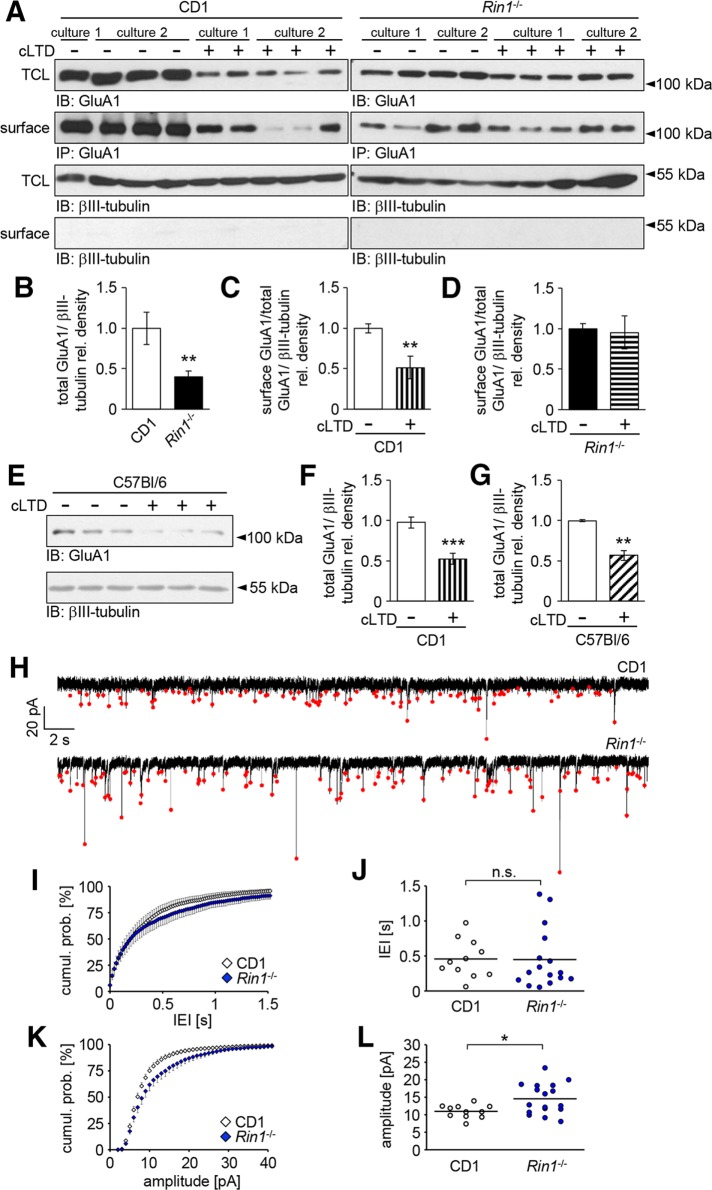
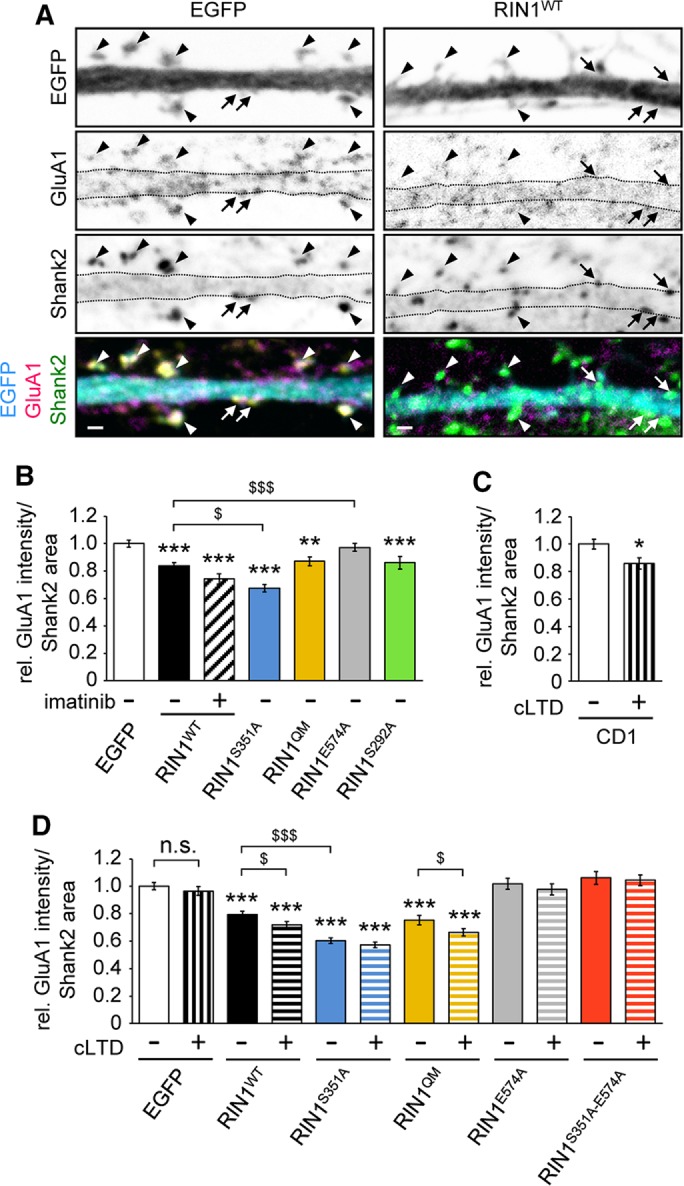
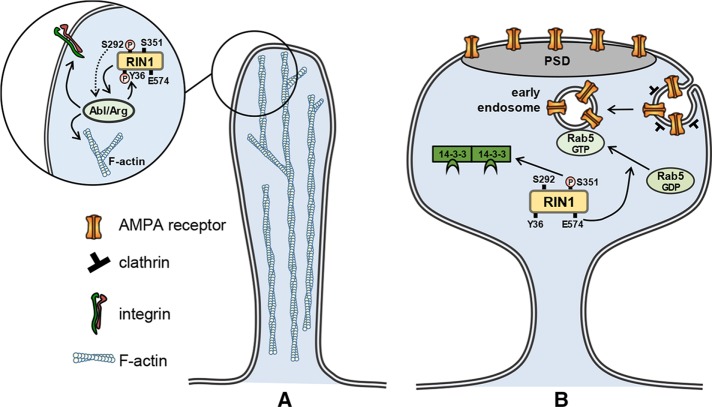
Ras and Rab interactor 1 (RIN1) is predominantly expressed in the nervous system. RIN1-knockout animals have deficits in latent inhibition and fear extinction in the amygdala, suggesting a critical role for RIN1 in preventing the persistence of unpleasant memories. At the molecular level, RIN1 signals through Rab5 GTPases that control endocytosis of cell-surface receptors and Abl nonreceptor tyrosine kinases that participate in actin cytoskeleton remodeling. Here we report that RIN1 controls the plasticity of cultured mouse hippocampal neurons. Our results show that RIN1 affects the morphology of dendritic protrusions and accelerates dendritic filopodial motility through an Abl kinase-dependent pathway. Lack of RIN1 results in enhanced mEPSC amplitudes, indicating an increase in surface AMPA receptor levels compared with wild-type neurons. We further provide evidence that the Rab5 GEF activity of RIN1 regulates surface GluA1 subunit endocytosis. Consequently loss of RIN1 blocks surface AMPA receptor down-regulation evoked by chemically induced long-term depression. Our findings indicate that RIN1 destabilizes synaptic connections and is a key player in postsynaptic AMPA receptor endocytosis, providing multiple ways of negatively regulating memory stabilization during neuronal plasticity.


Figures

FIGURE 1:
FIGURE 1:
RIN1 levels in developing hippocampal neuronal cultures. (A) The specificity of RIN1 antibody is proved by the lack of RIN1 signal in Rin1/ samples compared with CD1 lysates. RIN1 and GluA1 expression during development of C57Bl/6 (B) and CD1 (C) wild-type neuronal cultures. (D) Alkaline phosphatase (AP) treatment of cell lysates abolishes anti-pS351 RIN1 precipitation. (E) Changes in the relative phosphorylation of the Ser351 site in RIN1 during in vitro development of CD1 cultures. Neuron-specific βIII-tubulin served as a loading control (A, D) or as an indicator of neurite development (B, C, E). TCL, total cell lysates.
FIGURE 2:
FIGURE 2:
(A) Representative dendritic outlines of EGFP-expressing CD1 and Rin1/ hippocampal neurons on DIV13. (B) Dendritic branches of Rin1/ hippocampal neurons expressing EGFP, RIN1WT-EGFP, or RIN1S351A-EGFP for 24 h. (C) Average protrusion density and (D) ratio of stubby, mushroom-like or filamentous spines within the transfected hippocampal neurons. (E) pCrkL levels in HEK293T cells transfected with EGFP-tagged wild-type RIN1, RIN1S351A, RIN1QM, or RIN1E574A constructs. Anti-GFP signal indicates similar expression levels of RIN1 constructs. α-Tubulin served as a loading control. Data are presented as mean ± SEM. *p < 0.05; **p < 0.01. Asterisk represents significant differences compared with control values. Arrows indicate filamentous protrusions; arrowheads show mushroom-type dendritic spines. Scale bar, 50 μm (A), 1 μm (B).
FIGURE 3:
FIGURE 3:
Average tip movement within 1 min (A) and cumulative time-dependent displacement functions (B–D) of data obtained on filopodial motility within Rin1/ hippocampal cultures transfected with the indicated EGFP-tagged constructs. Imatinib 5 μM was applied for 1 h before imaging (A–C). Data are presented as mean ± SEM. $p < 0.05; **,$$p < 0.01; ***,$$$p < 0.001. Asterisk indicates difference from the EGFP values.
FIGURE 4:
FIGURE 4:
Transferrin uptake in pulse-labeled Rin1/ hippocampal neurons. (A) Fluorescently labeled transferrin signals associated with the plasma membrane (surface) or internalized after 1 or 5 min of chasing time. Red arrowheads show surface-localized transferrin puncta; empty arrowheads indicate internalized transferrin signals; dashed line indicates plasma membrane. The xyz-planes are represented in cut-view images (top). Scale bars, 1 μm (cut views), 5 μm (overviews). (B) The ratio of internalized transferrin signals compared with the total number of transferrin-positive puncta visible in the equatorial plane of the neuronal soma in Rin1/ neurons transfected with the indicated fluorescently tagged constructs. Data are presented as mean ± SEM. *p < 0.05; **p < 0.01; ***p < 0.001.
FIGURE 5:
FIGURE 5:
Analysis of AMPA receptor expression and activity at the cell surface. (A–D) Surface biotinylation of GluA1 subunits in CD1 and Rin1/ hippocampal neuronal cultures. (A) Representative Western blots of TCLs and biotinylated samples precipitated on NeutrAvidin beads (surface) under control conditions or 2 h after cLTD treatment. βIII-tubulin served as a loading control and was absent from the precipitated samples. TCL lysates and βIII-tubulin blots from CD1 and Rin1/ cultures were developed under the same conditions. In the case of biotinylated GluA1 subunits, exposure time for the CD1 samples was longer than in the case of the Rin1/ samples. (B) Comparison of the relative GluA1 levels in TCLs from Rin1/ or CD1 cultures. (C, D) Changes in the relative surface-labeled GluA1 levels after cLTD treatment in CD1 (C) or Rin1/ (D) cultures. (E) Representative Western blot images of total GluA1 levels in C57Bl/6 neuronal cultures after cLTD induction. (F, G) Comparison of cLTD-evoked decrease in the total GluA1 level between CD1 (F) and C57Bl/6 (G) neuronal cultures. (H) Representative whole-cell patch clamp recordings obtained from CD1 or Rin1/ neurons. The mEPSCs are indicated by red dots. (I, K) Pooled cumulative probability density distributions of mEPSC interevent intervals (IEIs) and mEPSC amplitudes, respectively. (J, L) Scatter plots showing the medians of IEIs and mEPSC amplitudes, respectively. Median mEPSC amplitude in Rin1/ cultures is significantly higher than in CD1 cultures. Data are presented as mean ± SEM. *p < 0.05; **p < 0.01; ***p < 0.001.
FIGURE 6:
FIGURE 6:
Anti-GluA1 antibody feeding in hippocampal neuronal cultures. Relative anti-GluA1 signal intensity was determined within Shank2-positive postsynaptic densities (PSDs) at the plasma membrane. (A) Representative pictures of Rin1/ dendrites transfected with EGFP or EGFP-tagged RIN1WT after 10 min of antibody feeding with anti-GluA1. PSD was delineated based on clear Shank2 positivity. Arrows point at shaft synapses; arrowheads indicate spines. Scale bar, 1 μm. (B–D) Quantification of GluA1 signal intensities within Shank2-positive PSD areas in EGFP-transfected neurons of CD1 cultures (C) or in Rin1/ neurons transfected with the indicated EGFP-tagged constructs (B, D). cLTD was evoked by 3 min of 50 μM NMDA treatment, and neurons were analyzed 2 h later (C, D). Imatinib was applied at 5 μM for 1 h (B). Data are presented as mean ± SEM. *,$p < 0.05; **p < 0.01; ***,$$$p < 0.001. Asterisk indicates difference compared with the EGFP values.
FIGURE 7:
FIGURE 7:
RIN1 signaling pathways in motile dendritic filopodia (A) and established spines (B). (A) S292 phosphorylation of RIN1 enhances the phosphorylation of the Y36 site by Abl kinases and leads to Abl/Arg activation via disengaged autoinhibition. In turn, Abl kinase activity increases actin remodeling and/or alters integrin signaling. (B) In mature spines, RIN1 is sequestered in the cytoplasm by 14-3-3 proteins through binding to the phosphorylated S351 site, thereby blocking the downstream activation of Rab5. The E574 site of RIN1 is responsible for the Rab5 GEF activity and controls the conversion of Rab5 GDP to Rab5 GTP, leading to enhanced clathrin-mediated endocytosis of AMPA receptors. Both of these pathways counteract the stabilization of synaptic connections and decrease synaptic efficacy. PSD, postsynaptic density.

Similar articles

Cited by

References

    1. Arendt T, Gärtner U, Seeger G, Barmashenko G, Palm K, Mittmann T, Yan L, Hümmeke M, Behrbohm J, Brückner MK, et al. Neuronal activation of Ras regulates synaptic connectivity. Eur J Neurosci. 2004;19:2953–2966. - PubMed
    1. Balaji K, Colicelli J. RIN1 regulates cell migration through RAB5 GTPases and ABL tyrosine kinases. Commun Integr Biol. 2013;6:e25421. - PMC - PubMed
    1. Balaji K, Mooser C, Janson CM, Bliss JM, Hojjat H, Colicelli J. RIN1 orchestrates the activation of RAB5 GTPases and ABL tyrosine kinases to determine the fate of EGFR. J Cell Sci. 2012;125:5887–5896. - PMC - PubMed
    1. Barad M, Gean PW, Lutz B. The role of the amygdala in the extinction of conditioned fear. Biol Psychiatry. 2006;60:322–328. - PubMed
    1. Bliss JM, Gray EE, Dhaka A, Dell TJO, Colicelli J. Fear learning and extinction are linked to neuronal plasticity through RIN1 signaling. J Neurosci Res. 2010;88:917–926. - PMC - PubMed

Publication types

MeSH terms

Substances

LinkOut - more resources