. 2017 Jan 1;28(1):98-110.
doi: 10.1091/mbc.E16-04-0228. Epub 2016 Nov 16.

Local Arp2/3-dependent actin assembly modulates applied traction force during apCAM adhesion site maturation

Affiliations

Local Arp2/3-dependent actin assembly modulates applied traction force during apCAM adhesion site maturation

Kenneth B Buck et al. Mol Biol Cell. .

Abstract

Homophilic binding of immunoglobulin superfamily molecules such as the Aplysia cell adhesion molecule (apCAM) leads to actin filament assembly near nascent adhesion sites. Such actin assembly can generate significant localized forces that have not been characterized in the larger context of axon growth and guidance. We used apCAM-coated bead substrates applied to the surface of neuronal growth cones to characterize the development of forces evoked by varying stiffness of mechanical restraint. Unrestrained bead propulsion matched or exceeded rates of retrograde network flow and was dependent on Arp2/3 complex activity. Analysis of growth cone forces applied to beads at low stiffness of restraint revealed switching between two states: frictional coupling to retrograde flow and Arp2/3-dependent propulsion. Stiff mechanical restraint led to formation of an extensive actin cup matching the geometric profile of the bead target and forward growth cone translocation; pharmacological inhibition of the Arp2/3 complex or Rac attenuated F-actin assembly near bead binding sites, decreased the efficacy of growth responses, and blocked accumulation of signaling molecules associated with nascent adhesions. These studies introduce a new model for regulation of traction force in which local actin assembly forces buffer nascent adhesion sites from the mechanical effects of retrograde flow.


Figures

FIGURE 1:
FIGURE 1:
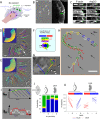
Site-directed actin assembly drives inductopodial motility and requires Arp2/3 complex activity. (A) Inductopodia are induced by unrestrained beads derivatized with anti-apCAM (4E8) antibody landing on the growth cone. Growth cone domains: P, P domain; T, T zone; C, C domain. (B) DIC image (left, cf. Supplemental Movie 1) taken immediately before fixation and confocal phalloidin-stained fluorescent image (right) showing the actin tail of an inductopodium (bracket and green arrow; bead positions in B and C: green circles). Direction of inductopodial movement is indicated by white arrow. (C) Multiple inductopodia with F-actin visualized with phalloidin (left) and Arp2/3 complex with p34Arc antibody (right). (D) 4E8 beads were applied to a growth cone in control conditions (cf. Supplemental Movie 2). Arbitrarily colored bead tracks are shown superimposed over DIC image of the growth cone. Scale bar: 5 μm. Inset, Retrograde flow shown as a color map of flow speed |vflow| calculated from flow-coupled beads only, with arrows indicating flow direction. (E) Bead tracks for the same growth cone in the presence of 50 μM CK666 (cf. Supplemental Movie 2). Inset, Map of |vflow| in 50 μM CK666. (F) Bead-velocity classification scheme. Beads are classified as being flow coupled when the flow-subtracted bead/inductopodial speed |vind| is below a threshold of 2 μm/min (blue), or when |vind| is above threshold, as retrograde, lateral, or anterograde (purple, yellow, or green, respectively) according to flow-subtracted bead-velocity angles relative to flow, θrel (light blue arrow). The latter three classifications can be grouped into a nonflow or “propulsive” velocity classification category (red). (G) Track corresponding to the dotted white track indicated by arrow in D with color coding for classified motility states. Local flow direction is indicated by black arrows. Scale bar: 1 μm. (H) Plot of observed positions, bead velocities (white arrows), and flow-corrected velocities (red arrows) of the initial portion of the track (orange box in G) shown at 5 s intervals with color-coded motility classification (circles). Velocities are also color coded: flow velocity vflow in black, uncorrected bead velocity vtot in white, and flow-corrected bead/inductopodial velocity vind in red. Scale bar: 1 μm. (I) Kinematic analysis of bead track shown in G and H. Kymograph of bead position relative to leading edge (dotted line) vs. time (top panel) showing color-coded motility states, with retrograde flow (solid black lines); velocity vs. time graph (bottom panel) with uncorrected (white) and flow-corrected (red) speed traces. (J) The P domain of each growth cone was subdivided into four annular zones for analysis of motility (cf. Supplemental Figure S1). Probabilities of the four velocity states in the front one-fourth (zone 1) or rear three-fourths (zones 2/3/4) of the P domain of the growth cone in D and E are shown as stacked histograms in control vs. 50 μM CK666 conditions. (K) Changes in flow-coupled (blue) vs. propulsive (red) state probabilities resulting from Arp2/3 complex inhibition are shown for multiple growth cones. Each line represents paired probabilities for control vs. CK666; solid lines, experiments in which [CK666] = 50 μM; dashed lines, [CK666] = 20 μM. ngc = 9 paired growth cones; total number of beads nb = 592 (control), 247 (20 mM CK-666), and 342 (50 mM CK 666).
FIGURE 2:
FIGURE 2:
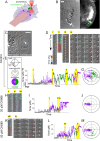
Analysis of Arp2/3-dependent forces during apCAM adhesion formation using optical trapping. (A) Schematic of optical trapping approach to apply apCAM-coated beads. (B) DIC image (left) taken immediately before fixation and confocal phalloidin-stained fluorescent image (right) showing the actin tail of an inductopodium (green arrow) at an optically restrained bead. The direction of inductopodial movement is indicated by white arrow. Scale bar: 5 μm. (C) DIC image of growth cone at beginning of experiment (cf. Supplemental Movie 5). Retrograde and anterograde directions are noted and apply to subsequent panels. (D) Time montages of force vectors overlaid on DIC images from Supplemental Movie 5, control sequence. Each sequence corresponds to time periods highlighted in yellow in F denoted by roman numerals. The montage frames are displayed at 1 s intervals progressing downward in Di and Dii, and at 5 s intervals in Diii and Div. Asterisk in panel Di denotes breakage when the bead snapped to the center of the trap; white arrowheads, actin structure detaching from bead with flow. Bracket in Diii indicates inductopodium/tail. Asterisk in Div denotes protrusive advance of intrapodium in front of the bead as it becomes stably coupled to flow. (E) Scheme showing classification of forces (low, anterograde, retrograde) and color coding for subsequent panels. Force vector angles (θ) are relative to retrograde flow, defined as 0°; force vectors with magnitudes below a threshold of 5 pN (of all vector angles) are classified as low (gray). Force vectors with magnitudes > 5 pN are classified as anterograde (90° < θ < 270°, green) or retrograde (270° < θ < 90°; purple). (F) Force magnitude vs. time plot in control, color coded according to classification in E. (G) Polar plot distribution of force vector angles (θ) and magnitude (in pN) from the entire control recording. (H) Time montages of force vectors/DIC images in Arp2/3-inhibited (20 μM CK666) conditions (cf. Supplemental Movie 6). Each sequence (v, vi, vii, shown at 1 s intervals) corresponds to time periods highlighted in yellow. (I) Force magnitude vs. time plot in 20 μM CK666. (J) Polar plot distribution of force vectors in 20 μM CK666. (K) Time montage of force vectors/DIC images in the inactive analogue CK689 (20 μM; cf. Supplemental Movie 7). Time montage of 1 s (vii) and 5 s (ix) intervals corresponding to yellow highlighted areas of L. Asterisk, continued inductopodial protrusion during coupling. (L) Force vs. time plot of 20 μM CK869 recording. (M) Polar plot distribution of force vectors in 20 μM CK689. Scale bars (B, C, D, H, and K): 5 μm.
FIGURE 3:
FIGURE 3:
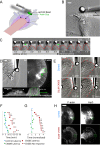
(A) Schematic of evoked growth assay elicited using stiff restraint of apCAM bead with glass needle. (B) DIC image taken from the beginning of evoked growth assay (cf. Supplemental Movie 8) showing 5 μm apCAM-functionalized bead being restrained by a glass needle. White arrow, intrapodium extending in the P domain. (C) Time montage of apCAM-evoked growth response of growth cone in B. Red dashed line outlines the shape of the C-domain; arrowheads indicate site-directed actin cup; dotted white line indicates original extent of P domain. Forward protrusion of P domain toward end of advance period is indicated by white arrow in front of bead. (D) F-actin accumulation at restrained apCAM target site. A growth cone was fixed at the end of the latency period (DIC, left panel) and stained with phalloidin (average projection of confocal z-stack, right panel; cf. Supplemental Movie 9). Bottom, y-z view of 3D confocal reconstruction taken from Supplemental Movie 9 showing height of F-actin cup in relation to 5 μm bead (outlined by dashed green circle). (E) CK-666 blocks apCAM-evoked growth. Top row, DIC images of the same growth cone in control conditions at the beginning (0 min) and end (6.25 min) of the evoked growth response. Bottom row, the same growth cone in the presence of 50 mM CK666 Arp2/3 inhibitor, at the beginning (0 min) and end (12 min) of the recording. Red dashed line indicates outline of the C domain. Scale bar: 5 μm. (F) Pictogram of evoked growth response times. Responses of individual growth cones in different conditions are shown in horizontally aligned groups showing the control latency (blue diamonds) and latency in 50 μM CK666 (filled red squares); for experiments in which no C-domain targeting or peripheral advance was observed, the length of the recording is noted (empty squares with arrows). A subset of growth cones were also challenged with restrained apCAM beads in the presence of the inactive analogue CK689 (green triangles). (G) The data from F are shown normalized to control latency times. (H) F-actin and Arp2/3 complex localization in control (top row) vs. 50 μM CK666 (bottom row). Growth cones were fixed at 0.5× latency and stained for F-actin with phalloidin (left panels) or Arp2/3 complex (right panels, anti Arp-3).
FIGURE 4:
FIGURE 4:
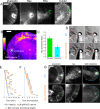
Rac accumulates at apCAM target sites, and its activity is required for evoked growth responses. (A) Growth cones were challenged with needle-restrained apCAM beads, fixed at the end of the latency period, and stained for F-actin (phalloidin) or with antibodies to Rac, Rho, or Cdc42 and fluorescent secondary antibodies. (B) Rac1 enrichment at apCAM target adhesions is enhanced by force restraint. Bag cells were injected with fixable Texas red–dextran before apCAM target assay, then fixed during latency and probed with monoclonal Rac1 antibody and fluorescent secondary antibodies for volume-corrected ratio imaging. Positions of restrained and unrestrained beads are noted. (C) Rac enrichment is enhanced at force-restrained beads. Rac enrichment factor is calculated by dividing the Rac/volume ratio of either a restrained bead or unrestrained bead by the Rac/volume ratio of nonbead P-domain region of interest. Numbers in parentheses denote number of experiments. Error bars are SEM. (D) Top row, DIC images of control-evoked growth assay at beginning (0 min) and end (5 min) of the evoked growth response. Bottom row, DIC images of the same growth cone subjected to restrained apCAM bead in media containing 100 μM NSC23766 Rac inhibitor. Red dashed line outlines the C domain. (E) Pictogram of evoked growth responses of individual growth cones in control and Rac-inhibited conditions, plotted as in Figure 3F, showing control latency period (blue diamonds), latency of growth cone responses in 100 μM NSC23766 (filled orange squares), or length of recordings in which no growth response was observed (empty squares). (F) Responses from E shown normalized to control latencies. (G) Rac activity is required for F-actin cup and localization of Rac and WRC protein. Growth cones were fixed at 0.5× latency and stained for F-actin (phalloidin), Rac, or WRC (WAVE2 antibody) in the absence (top row) or presence of 100 mM NSC23766 (bottom row). Scale bars: 10 μm (A and B); 5 μm (D and G).
FIGURE 5:
FIGURE 5:
Schematic depicting apCAM bead interactions with retrograde flow and site-directed actin assembly events. See Discussion for details.

Similar articles

Cited by

References

    1. Bard L, Boscher C, Lambert M, Mege RM, Choquet D, Thoumine O. A molecular clutch between the actin flow and N-cadherin adhesions drives growth cone migration. J Neurosci. 2008;28:5879–5890. - PMC - PubMed
    1. Block SM, Blair DF, Berg HC. Compliance of bacterial flagella measured with optical tweezers. Nature. 1989;338:514–518. - PubMed
    1. Campellone KG, Welch MD. A nucleator arms race: cellular control of actin assembly. Nat Rev. 2010;11:237–251. - PMC - PubMed
    1. Chan CE, Odde DJ. Traction dynamics of filopodia on compliant substrates. Science. 2008;322:1687–1691. - PubMed
    1. Cojoc D, Difato F, Ferrari E, Shahapure RB, Laishram J, Righi M, Di Fabrizio EM, Torre V. Properties of the force exerted by filopodia and lamellipodia and the involvement of cytoskeletal components. PLoS One. 2007;2:e1072. - PMC - PubMed

Publication types

LinkOut - more resources