. 2017 Jan;173(1):434-455.
doi: 10.1104/pp.16.01484. Epub 2016 Nov 16.

Photoperiod Affects the Phenotype of Mitochondrial Complex I Mutants

Pierre Pétriacq  1   2   3   4   5   6   7   8   9 Linda de Bont  1   2   3   4   5   6   7   8   9 Lucie Genestout  1   2   3   4   5   6   7   8   9 Jingfang Hao  1   2   3   4   5   6   7   8   9 Constance Laureau  1   2   3   4   5   6   7   8   9 Igor Florez-Sarasa  1   2   3   4   5   6   7   8   9 Touhami Rzigui  1   2   3   4   5   6   7   8   9 Guillaume Queval  1   2   3   4   5   6   7   8   9 Françoise Gilard  1   2   3   4   5   6   7   8   9 Caroline Mauve  1   2   3   4   5   6   7   8   9 Florence Guérard  1   2   3   4   5   6   7   8   9 Marlène Lamothe-Sibold  1   2   3   4   5   6   7   8   9 Jessica Marion  1   2   3   4   5   6   7   8   9 Chantal Fresneau  1   2   3   4   5   6   7   8   9 Spencer Brown  1   2   3   4   5   6   7   8   9 Antoine Danon  1   2   3   4   5   6   7   8   9 Anja Krieger-Liszkay  1   2   3   4   5   6   7   8   9 Richard Berthomé  1   2   3   4   5   6   7   8   9 Miquel Ribas-Carbo  1   2   3   4   5   6   7   8   9 Guillaume Tcherkez  1   2   3   4   5   6   7   8   9 Gabriel Cornic  1   2   3   4   5   6   7   8   9 Bernard Pineau  1   2   3   4   5   6   7   8   9 Bertrand Gakière  10   11   12   13   14   15   16   17   18 Rosine De Paepe  1   2   3   4   5   6   7   8   9
Affiliations

Photoperiod Affects the Phenotype of Mitochondrial Complex I Mutants

Pierre Pétriacq et al. Plant Physiol. 2017 Jan.

Abstract

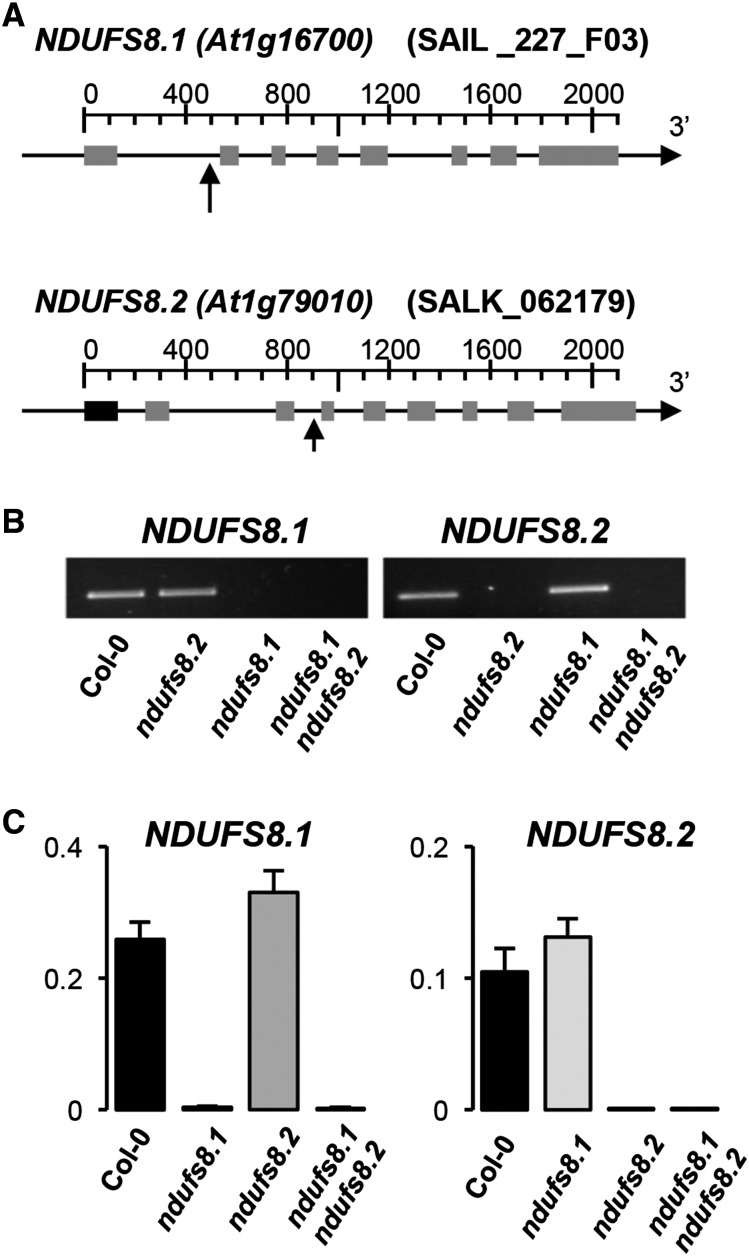
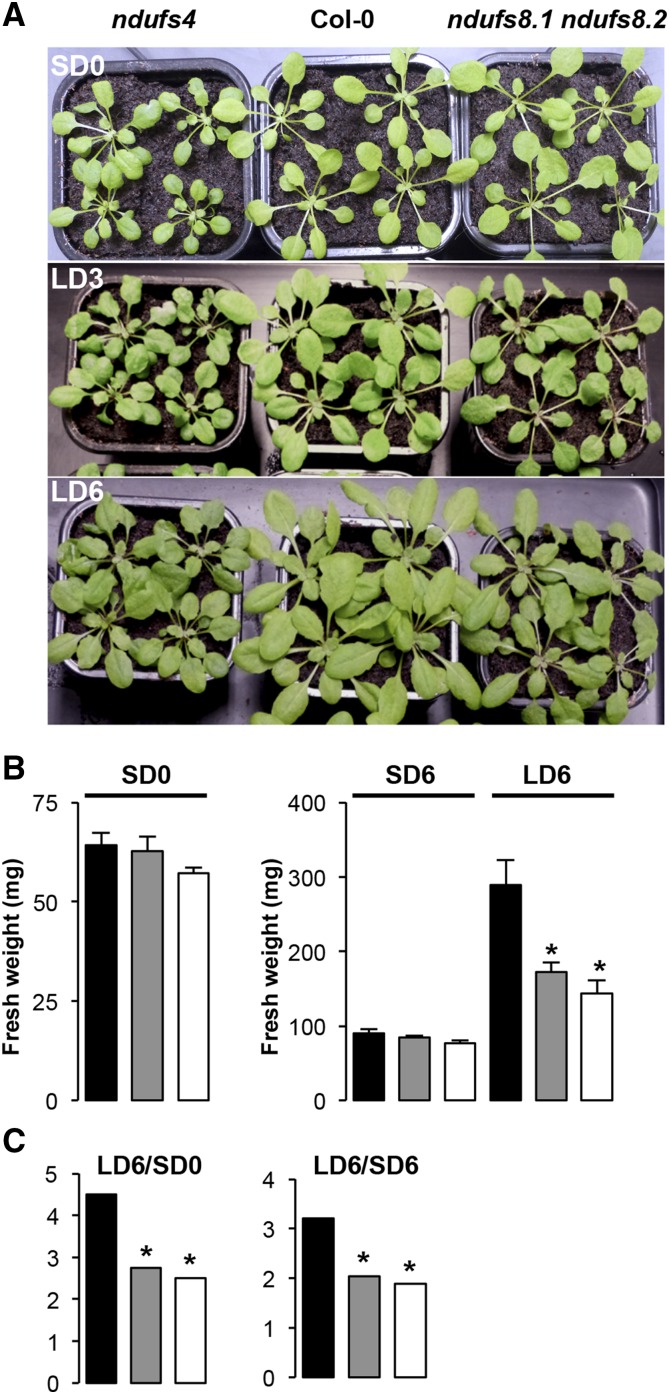
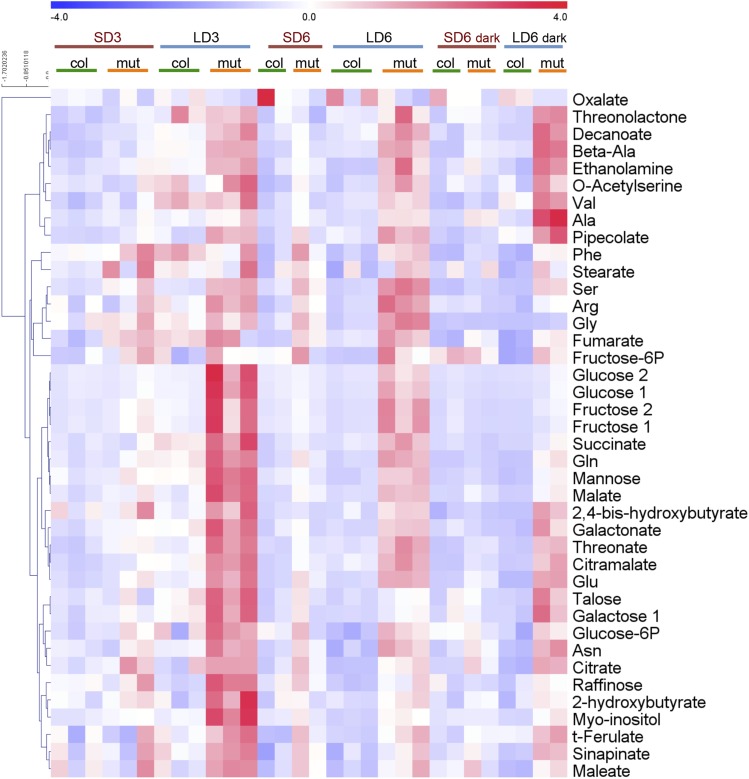
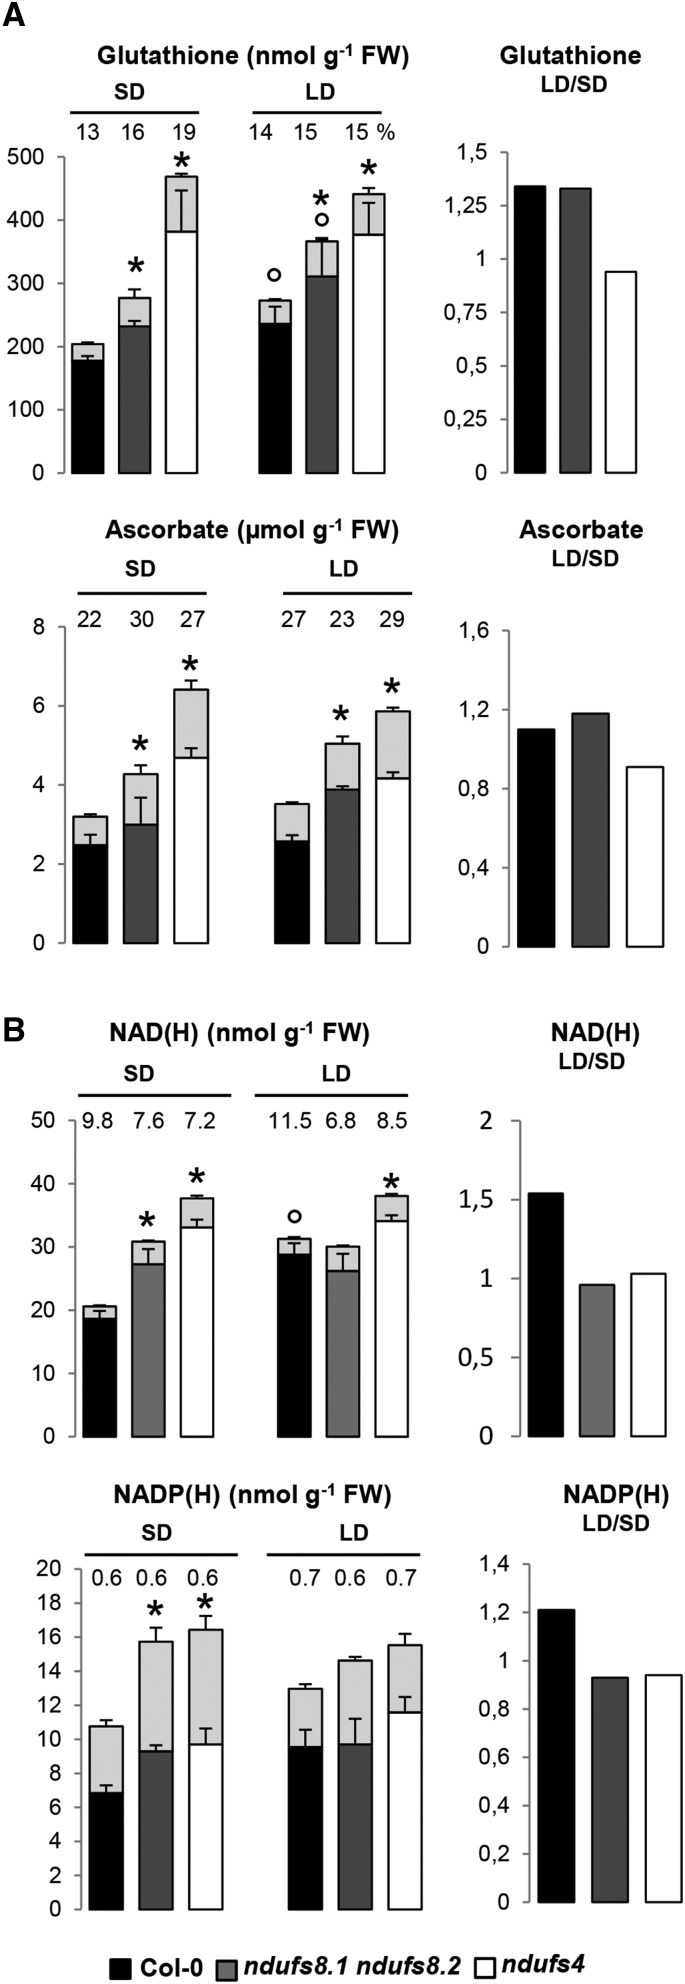
Plant mutants for genes encoding subunits of mitochondrial complex I (CI; NADH:ubiquinone oxidoreductase), the first enzyme of the respiratory chain, display various phenotypes depending on growth conditions. Here, we examined the impact of photoperiod, a major environmental factor controlling plant development, on two Arabidopsis (Arabidopsis thaliana) CI mutants: a new insertion mutant interrupted in both ndufs8.1 and ndufs8.2 genes encoding the NDUFS8 subunit and the previously characterized ndufs4 CI mutant. In the long day (LD) condition, both ndufs8.1 and ndufs8.2 single mutants were indistinguishable from Columbia-0 at phenotypic and biochemical levels, whereas the ndufs8.1 ndufs8.2 double mutant was devoid of detectable holo-CI assembly/activity, showed higher alternative oxidase content/activity, and displayed a growth retardation phenotype similar to that of the ndufs4 mutant. Although growth was more affected in ndufs4 than in ndufs8.1 ndufs8.2 under the short day (SD) condition, both mutants displayed a similar impairment of growth acceleration after transfer to LD compared with the wild type. Untargeted and targeted metabolomics showed that overall metabolism was less responsive to the SD-to-LD transition in mutants than in the wild type. The typical LD acclimation of carbon and nitrogen assimilation as well as redox-related parameters was not observed in ndufs8.1 ndufs8 Similarly, NAD(H) content, which was higher in the SD condition in both mutants than in Columbia-0, did not adjust under LD We propose that altered redox homeostasis and NAD(H) content/redox state control the phenotype of CI mutants and photoperiod acclimation in Arabidopsis.


Figures

Figure 1.
Figure 1.
Molecular characterization of single and double insertion mutants affected in the two Arabidopsis genes encoding the NDUFS8 subunit of CI. A, Gene structures and sites of insertion of T-DNA in ndufs8.1 (At1g79010) and ndufs8.2 (At1g16700) genes (arrows). B, Electrophoresis of RT-PCR products using NDUFS8.1- and NDUFS8.2-specific primers in the wild type (Col-0), ndufs8.1 and ndufs8.2 single mutants, and the ndufs8.1 ndufs8.2 double mutant. C, RT-quantitative PCR (qPCR) analysis of NDUFS8.1 and NDUFS8.1 genes in the wild type (Col-0), the ndufs8.1 and ndufs8.2 single mutants, and the ndufs8.1 ndufs8.2 double mutant, using ACTIN2 (ACT2) as a reference. Data are means + se of three independent measurements.
Figure 2.
Figure 2.
CI assembly/activity in Col-0 and single and double mutants for the NDUFS8 subunit. Membrane proteins extracted from leaves of Col-0 (lanes 1), single ndufs8.1 (lanes 2) and ndufs8.2 (lanes 3) mutants, and the ndufs8.1 ndufs8.2 double mutant (lanes 4) were solubilized with digitonin that preserves the assembly of supercomplexes and resolved by BN/PAGE on 4%/13% gradient acrylamide gels. After migration, gels were stained for CI activity using NDH/NBT or blotted on polyvinylidene difluoride membranes for immunodetection studies. Left, In-gel NDH/NBT-stained leaf proteins. CI and the CI/III supercomplex (purple signals and red arrows), detected in Col-0 and in both ndufs8.1 and ndufs8.2 single mutants, are absent in the double mutant. The PSI complex that originated from thylakoid membranes is indicated by the arrowhead (Pineau et al., 2008). Middle, The anti-NAD9 immunosignal, revealed at the level of CI in the wild type and in both ndufs8.1 and ndufs8.2 single mutants, is not detected in the ndufs8.1 ndufs8.2 double mutant. Right, The accumulation of complex IV using anti-COX2 antibody (bottom of the gel) is similar in all genotypes.
Figure 3.
Figure 3.
Respiratory pathways and mitochondrial proteins in Col-0 and the ndufs8.1 ndufs8.2 mutant. A, Respiration rates of Col-0 and the ndufs8.1 ndufs8.2 double mutant were determined by oxygen discrimination. Measurements were performed on plants grown in controlled chambers under 12-h/12-h day/night. vt, Total oxygen uptake; vcyt, COX activity; valt, AOX activity; τ, partition to the AOX pathway. Data are means + se of measurements performed on at least three different plants. Asterisks indicate significant differences between the wild type and the mutant. B, AOX capacity. The percentage of cyanide (KCN)-resistant respiration in leaf tissues was determined as described by Florez-Sarasa et al. (2009). Data are means + se of measurements performed on at least three different plants. The asterisk indicates a significant difference between Col-0 and the mutant. C, Immunodetection of mitochondrial proteins on total leaf membranes (tot mb; left) and mitochondrial membranes (mt mb; right); asterisks indicate mitochondrion-specific immunosignals. The experiment was performed at least three times with similar results.
Figure 4.
Figure 4.
Growth comparisons of Col-0, ndufs8.1 ndufs8.2, and ndufs4 plants in the SD-to-LD transfer experiment. A, Col-0 and mutant plants (ndufs8.1 ndufs8.2 and ndufs4) were initially grown in controlled rooms under SD to achieve a similar development (eight- to nine-leaf stage; SD0), then transferred to LD for 3 d (LD3) or 6 d (LD6). B, Histograms of fresh weight (mg) of SD0, SD6, and LD6 plants in Col-0 (black bars), ndufs8.1 ndufs8.2 (gray bars), and ndufs4 (white bars). Data are means + se of measurements on at least eight different plants in all genotypes. Differences between mutant and Col-0 values are much higher in the LD than in the SD condition. Asterisks indicate significant differences between mutants and Col-0 according to Student’s t test. C, LD-SD ratios of plant biomass (fresh weight) in Col-0 (black bars), ndufs8.1 ndufs8.2 (gray bars), and ndufs4 (white bars) plants. Asterisks indicate significant differences between mutants and Col-0.
Figure 5.
Figure 5.
Untargeted metabolomics by HILIC-qTOF-MS. Multivariate analyses of the number of anions (ESI) and cations (ESI+) detected by HILIC-qTOF-MS from Col-0 (squares), ndufs8.1 ndufs8.2 (triangles), and ndufs4 (circles) plants grown in SD (white symbols) or LD (gray symbols; n = 3). A, Unsupervised principal component analysis displaying the overall metabolic trends between samples. Variances are given in parentheses. PC1 and PC2, Principal components 1 and 2. B, Hierarchical clustering analysis showing metabolic relationships between genotypes and photoperiods (single linkage, tree sorted by size).
Figure 6.
Figure 6.
GC-MS determination of metabolites in Col-0, ndufs8.1 ndufs8.2, and ndufs4 plants. Leaves were sampled from SD6/LD6 plants at the middle of the day period. Analyte contents are expressed in relative units. Black columns, Col-0; gray columns, ndufs8.1 ndufs8.2; white columns, ndufs4. GABA, γ-Aminobutyrate; 2-OG, 2-oxoglutarate.
Figure 7.
Figure 7.
Heat map and hierarchical clustering (cosine correlation) of metabolites found to be significant with respect to genotype in a two-way ANOVA (GC-MS metabolomics). Col-0 (col) and ndufs8.1 ndufs8.2 (mut) leaves were sampled from SD3/LD3 plants at the middle of the light period and from SD6/LD6 plants both at the middle of the light period and at the end of the night period (dark). Metabolomics analyses were carried out three times (i.e. three biological replicates). Relative metabolite contents are represented as mean-centered values with a color scale (blue, low content; red, high content). Numbers close to metabolite names refer to individual analytes associated with the metabolite of interest.
Figure 8.
Figure 8.
Analysis of growth-related parameters in Col-0 and ndufs8.1 ndufs8.2. Leaves were sampled from Col-0 and ndufs8.1 ndufs8.2 plants at the middle of the light period on day 12. A, Carbon exchange-related parameters determined on leaves of 2- to 3-month-old rosette plants at the same developmental stage. Carboxylation efficiency (Ce; µmol CO2 m−2 s−1), stomatal conductance for CO2 (gs; mol m−2 s−1) calculated at growth illumination, Rubisco capacity (in vitro-measured maximum activity; nmol CO2 min−1 mg−1 protein), chlorophyll a/b ratios, night respiration (Rn; μmol CO2 m−2 s−1), and total leaf ATP (nmol g−1 fresh weight [FW]) are means + se of three to six measurements on different plants. Different letters indicate significant differences according to Student’s t test. B, Nitrogen assimilation-related parameters. Total leaf free amino acids (µmol g−1 fresh weight) determined from HPLC quantification (Supplemental Fig. S12), soluble proteins (mg g−1 fresh weight), total nitrogen content (%), NR capacity (maximum activity; µmol NO2 h−1 mg−1 protein), RT-qPCR analysis of the major nitrate reductase gene (NR2; expression relative to ACT2), and nitrate contents (µmol g−1 fresh weight) are means + se of three to six measurements on different plants. Different letters indicate significant differences according to Student’s t test. C, RT-qPCR analysis of TOR2/LST8 genes of the nutrient-dependent TOR pathway using ACT2 as a reference. Data are means + se of three to six measurements on different plants. Different letters indicate significant differences according to Student’s t test. D, RT-qPCR analysis of CCA1/LHY clock regulators. Data are means + se of six measurements on different plants. Different letters indicate significant differences according to Student’s t test.
Figure 9.
Figure 9.
ROS content and expression levels of antioxidant enzymes in Col-0 and ndufs8.1 ndufs8.2 plants maintained under SD and LD conditions. A, Typical EPR spectroscopy results, determined on leaf discs sampled from SD12/LD12 plants, as described by Michelet and Krieger-Liszkay (2012). B, Total soluble ROS pools (hydrogen peroxide [H2O2] equivalents) detected by luminol chemiluminescence in leaves sampled from SD12/LD12 plants at the middle of the light period (left) and at the end of the dark period (right). Data are means + se of measurements on four to six different plants. Different letters indicate significant differences according to Student’s t test. FW, Fresh weight. C, RT-qPCR analysis of redox enzymes of leaves sampled from SD12/LD12 plants at the middle of the light period. ACT2 was used as a reference. Data are means + se of measurements on three to six different plants. Different letters indicate statistical differences according to Student’s t test.
Figure 10.
Figure 10.
Pools of foliar redox buffers and cofactors in Col-0, ndufs8.1 ndufs8.2, and ndufs4 plants. Leaves were sampled from SD6/LD6 plants at the middle of the day period. Black columns, Col-0; dark gray columns, ndufs8.1 ndufs8.2; white columns, ndufs4. A, Redox buffers. Left, Total leaf content of reduced and oxidized (top, light gray) forms of glutathione (nmol g−1 fresh weight [FW]) and ascorbate (µmol g−1 fresh weight). Redox state (% of oxidized forms) is indicated above the histograms. Data are means + se from at least four extracts from different plants. Asterisks indicate significant differences (P < 0.05) between wild-type and mutant total pools according to Student’s t test; circles indicate significant differences between SD and LD values for the same genotype. Right, LD-SD ratios in the three genotypes. B, Redox cofactors. Left, Total leaf content of oxidized and reduced (top, light gray) forms of NAD(H) and NAD(P)H (nmol g−1 fresh weight). NAD(P)+-NAD(P)H ratios are indicated above the histograms. Results are means + se of eight extracts from different plants. Asterisks indicate significant differences (P < 0.05) between wild-type and mutant total pools according to Student’s t test; the circle indicates a significant difference between SD and LD values for the same genotype. Right, LD-SD ratios in the three genotypes.
Figure 11.
Figure 11.
Pools of mitochondrial NAD+ and transcriptional analysis of NAD+ biosynthetic genes. In all experiments, leaves were sampled from SD12/LD12 Col-0 and ndufs8.1 ndufs8.2 plants at the middle of the day period. A, NAD+ (nmol g−1 fresh weight [FW]) contents of mitochondrial preparations. Results are means + se of three extracts from different plants. B, RT-qPCR analyses of NAD+ biosynthetic genes were carried out using ACT2 as a reference. Results are means + se of at least six extracts from different plants. Different letters indicate significant differences according to Student’s t test.

Similar articles

Cited by

References

    1. Ahmad M, Lin C, Cashmore AR (1995) Mutations throughout an Arabidopsis blue-light photoreceptor impair blue-light-responsive anthocyanin accumulation and inhibition of hypocotyl elongation. Plant J 8: 653–658 - PubMed
    1. Alonso JM, Stepanova AN, Leisse TJ, Kim CJ, Chen H, Shinn P, Stevenson DK, Zimmerman J, Barajas P, Cheuk R, et al. (2003) Genome-wide insertional mutagenesis of Arabidopsis thaliana. Science 301: 653–657 - PubMed
    1. Araújo WL, Nunes-Nesi A, Nikoloski Z, Sweetlove LJ, Fernie AR (2012) Metabolic control and regulation of the tricarboxylic acid cycle in photosynthetic and heterotrophic plant tissues. Plant Cell Environ 35: 1–21 - PubMed
    1. Becker B, Holtgrefe S, Jung S, Wunrau C, Kandlbinder A, Baier M, Dietz KJ, Backhausen JE, Scheibe R (2006) Influence of the photoperiod on redox regulation and stress responses in Arabidopsis thaliana L. (Heynh.) plants under long- and short-day conditions. Planta 224: 380–393 - PubMed
    1. Brangeon J, Sabar M, Gutierres S, Combettes B, Bove J, Gendy C, Chétrit P, Des Francs-Small CC, Pla M, Vedel F, et al. (2000) Defective splicing of the first nad4 intron is associated with lack of several complex I subunits in the Nicotiana sylvestris NMS1 nuclear mutant. Plant J 21: 269–280 - PubMed