. 2016 Nov 17:7:13472.
doi: 10.1038/ncomms13472.

Spatially precise visual gain control mediated by a cholinergic circuit in the midbrain attention network

Affiliations

Spatially precise visual gain control mediated by a cholinergic circuit in the midbrain attention network

Ali Asadollahi et al. Nat Commun. .

Abstract

A primary function of the midbrain stimulus selection network is to compute the highest-priority location for attention and gaze. Here we report the contribution of a specific cholinergic circuit to this computation. We functionally disconnected the tegmental cholinergic nucleus isthmi pars parvocellularis (Ipc) from the optic tectum (OT) in barn owls by reversibly blocking excitatory transmission in the Ipc. Focal blockade in the Ipc decreases the gain and spatial discrimination of OT units specifically for the locations represented by the visual receptive fields (VRFs) of the disconnected Ipc units, and causes OT VRFs to shift away from that location. The results demonstrate mechanisms by which this cholinergic circuit controls bottom-up stimulus competition and by which top-down signals can bias this competition, and they establish causal linkages between a particular circuit, gain control and dynamic shifts of VRFs. This circuit may perform the same function in all vertebrate species.


Figures

Figure 1
Figure 1. Experimental set-up.
(a) The drawing depicts the owl brain and plane of section. (b) Nissl-stained, transverse section of midbrain showing the OT and nucleus Ipc (outlined in red). Layer 10 in the OT is indicated by the triangle. (c) Schematic of the experimental set-up: extracellular recording electrode in layers 11–13 and multi-barrelled iontophoretic and recording electrode in the Ipc. The drawing represents an ‘aligned' pair of OT and Ipc sites. Red: cholinergic neuron; shaded portion of OT: deep (multimodal and motor) layers.
Figure 2
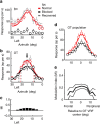
Figure 2. Effect of Ipc blockade on spatial tuning at aligned sites in the Ipc and OT.
(a) Data from a multi-unit recording at the Ipc injection site. (b) Data recorded simultaneously from a single OT unit at an aligned site in the OT. Responses to a dark looming dot (full contrast; 8° per s) at different locations across the visual field were measured before, during and after iontophoretic application of kyn at the Ipc site. Symbols represent mean and s.e. (n=12); dashed vertical lines indicate locations of half-max responses; curves are best-fit Gaussian functions. Downward arrow indicates the Ipc VRF centre, measured in a. (c) Response modulation index (MI; Methods) calculated from the Gaussian fits for the responses shown in b. (d) Population average and s.e.m. of the responses of OT units from aligned OT–Ipc pairs (n=28) tested as described in b. The data are plotted in degrees frontal versus peripheral relative to the VRF centre. (e) Population average MI and s.e.m. resulting from Ipc blockade for OT units from aligned OT–Ipc pairs (n=28).
Figure 3
Figure 3. Effect of Ipc blockade on unit responses at aligned OT sites.
The data compare single-unit responses in the OT measured before versus during Ipc blockade, for aligned OT–Ipc pairs. (a) Change in response rate measured at the VRF centre (n=28). (b) Change in the spontaneous rate (n=28). (c) Shift in the half-max locations of the VRF (n=56). (d) Change in spatial resolution, measured as max d′ (n=28). Solid vertical line: mean value; horizontal arrow indicates significant shift from zero (P<0.05; paired t-test).
Figure 4
Figure 4. Effect of Ipc blockade on spatial tuning at non-aligned sites in the OT.
(a) Data from a multi-unit recording at the Ipc injection site. (b) Data from a simultaneously recorded single OT unit at a non-aligned site in the OT. Conventions are the same as in Fig. 2. (c) Response modulation index calculated from the Gaussian fits shown in b. (d) Population average modulation index (MI) and s.e.m. resulting from Ipc blockade for OT units from non-aligned pairs (n=19). For each location, MI values were calculated only for those OT units that gave a significant response before blockade (Methods). The data are plotted relative to the Ipc-aligned border of the OT VRF (Methods).
Figure 5
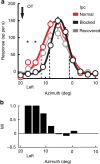
Figure 5. Effect of Ipc blockade on response modulation at non-aligned sites in the OT.
(a) Data from a single OT unit for a non-aligned OT-Ipc pair. VRF locations (azimuth, elevation): OT (L6, −6); Ipc (L19, −5). Downward arrow: location of the Ipc VRF centre. Asterisks: stimulus locations that did not drive the OT unit during Ipc blockade. Conventions are the same as in Fig. 2. (b) Response modulation index calculated from the Gaussian fits shown in a. The modulation index (MI) was calculated only for those locations that yielded a significant response before blockade.
Figure 6
Figure 6. Effect of Ipc blockade on population visual responses in the OT.
(a) Population summary of the effect of Ipc blockade on the Ipc-aligned half-max response (open circles) and the Ipc-non-aligned half-max response (solid dots) for non-aligned OT–Ipc sites (n=19). The directions of the shifts in half-max values are plotted as a function of the relative positions of the VRF centres for each OT–Ipc pair. (b) Extent of the blockade in the Ipc. The plot shows the effect of Ipc blockade on OT responses at the VRF centre. The data compare the strength of OT unit responses (n=52) to looming-dot stimuli (full contrast; 8° per s), measured at the centre of the OT VRF, before versus during Ipc blockade. This plot includes data from two OT–Ipc pairs for which the effect of blockade on the OT VRF centre was measured, but for which the effects on the entire OT tuning curve was not measured. Per cent change is plotted as a function of the distance, in degrees of space, between the OT and Ipc VRF centres. Dashed line indicates 50% of the maximum observed blockade effect (69% response reduction). (c) Illustration of the average population visual response across the OT space map, measured relative to the maximum response before Ipc blockade (colour bar; Methods). The drawings represent a lateral view of the space map on the surface of the OT. Top: before Ipc blockade (Ipc connected); bottom: during Ipc blockade (Ipc disconnected).
Figure 7
Figure 7. Effect of Ipc blockade on contrast-response functions in the OT for aligned OT–Ipc sites.
(a) Data from a single OT–Ipc pair. The graph shows the responses (mean and s.e.m.) of an OT unit to various contrasts of a dark looming-dot stimulus (8° per s) before (red), during (black) and after (grey) iontophoretic application of kyn at the Ipc site. The inset shows the data recorded simultaneously from the Ipc injection site, and it uses the same colour code. Curves are best-fit sigmoidal functions (Methods). (be) Population summaries (n=40) of values derived from best-fit sigmoidal functions. Inset shows per cent changes. Dashed vertical line indicates zero change; solid vertical line indicates mean change; horizontal arrow indicates significant shift from zero (P<0.05; paired t-test). In e, the mean change was zero.
Figure 8
Figure 8. Effect of Ipc blockade on OT response time course.
The data compare the time courses of OT unit responses to looming-dot stimuli (8° per s) presented at the centre of the VRF measured before, during and after Ipc blockade. Vertical dashed lines: duration of the stimulus. (a,b) Time courses of single OT units to full contrast stimuli. (c,d) Population average (n=41) time courses of responses to 90% contrast (c) and 20% contrast (d) looming dots. Shaded lines: s.e.m.

References

    1. Womelsdorf T., Anton-Erxleben K. & Treue S. Receptive field shift and shrinkage in macaque middle temporal area through attentional gain modulation. J. Neurosci. 28, 8934–8944 (2008). - PMC - PubMed
    1. Tolias A. S. et al.. Eye movements modulate visual receptive fields of V4 neurons. Neuron 29, 757–767 (2001). - PubMed
    1. Moran J. & Desimone R. Selective attention gates visual processing in the extrastriate cortex. Science 229, 782–784 (1985). - PubMed
    1. Armstrong K. M., Fitzgerald J. F. & Moore T. Changes in visual receptive fields with microstimulation of frontal cortex. Neuron 50, 791–798 (2006). - PubMed
    1. Connor C. E., Preddie D. C., Gallant J. L. & Van Essen D. C. Spatial attention effects in macaque area V4. J. Neurosci. 17, 3201–3214 (1997). - PMC - PubMed

Publication types

LinkOut - more resources