. 2016 Nov 17:7:13342.
doi: 10.1038/ncomms13342.

Salinity tolerance loci revealed in rice using high-throughput non-invasive phenotyping

Affiliations

Salinity tolerance loci revealed in rice using high-throughput non-invasive phenotyping

Nadia Al-Tamimi et al. Nat Commun. .

Abstract

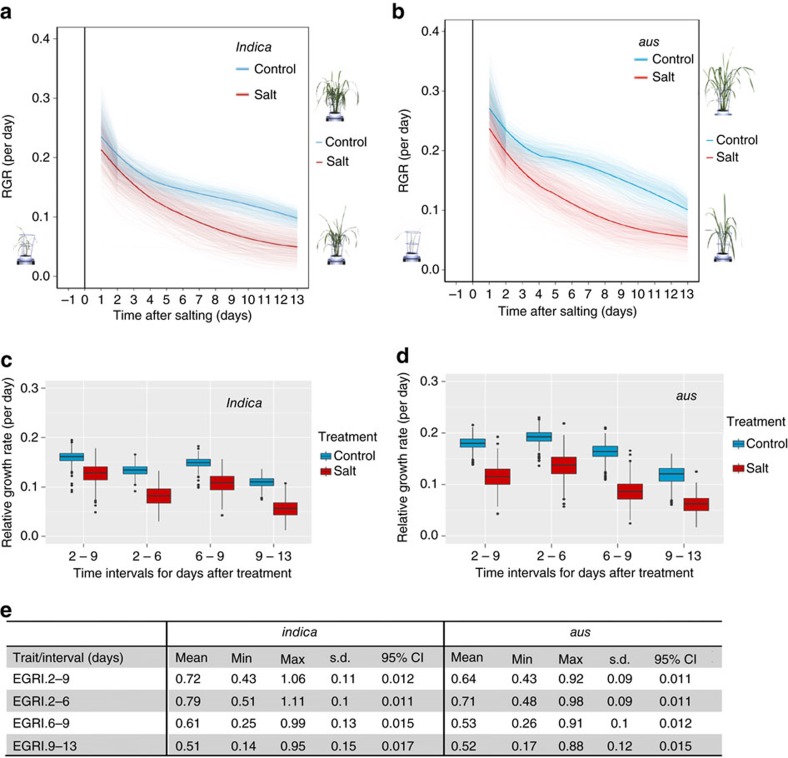
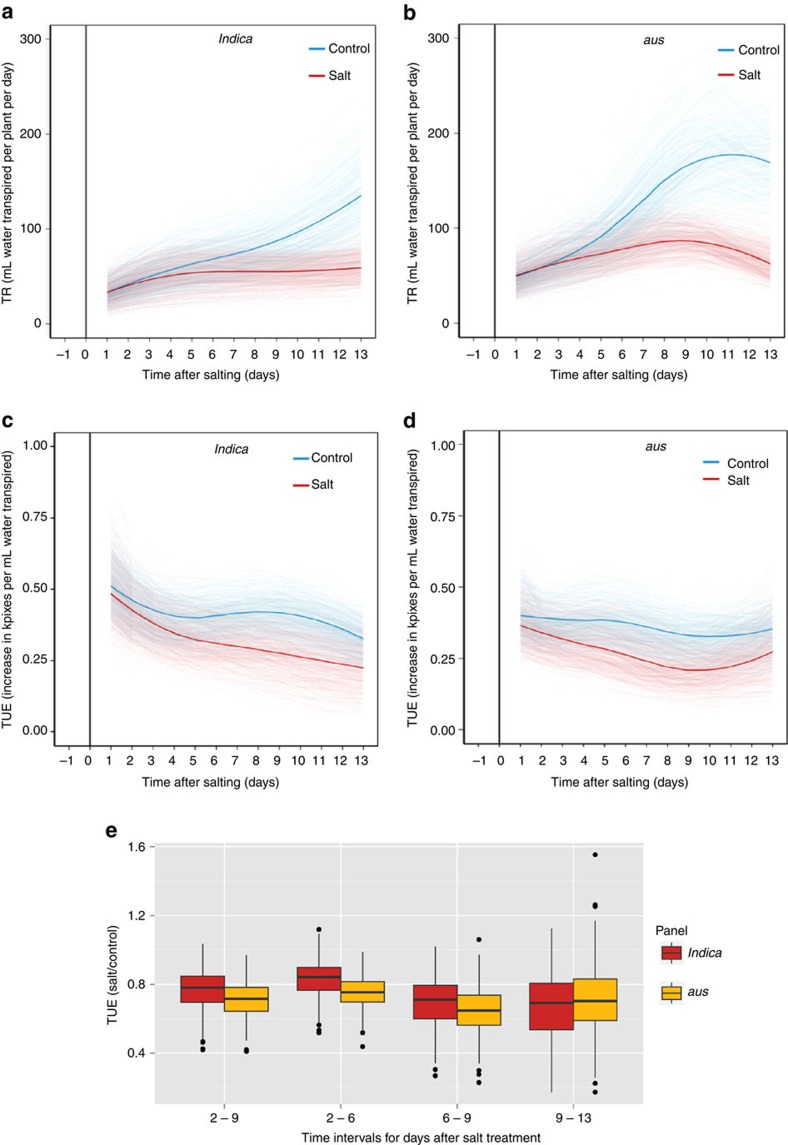
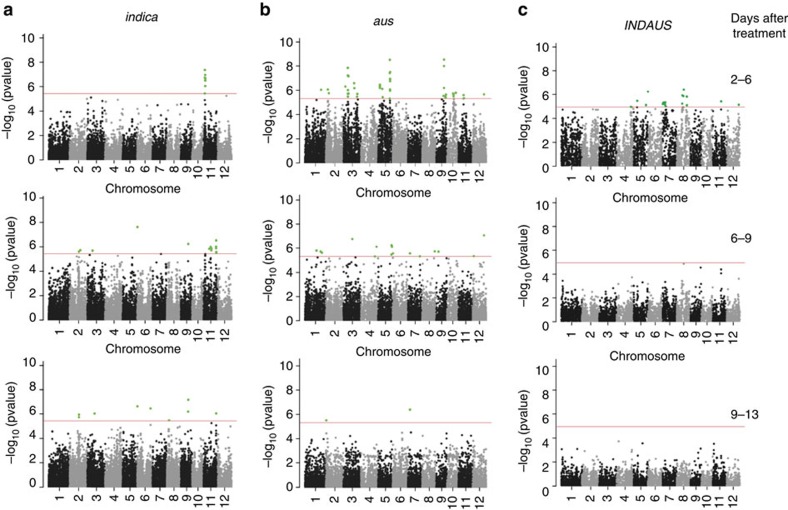
High-throughput phenotyping produces multiple measurements over time, which require new methods of analyses that are flexible in their quantification of plant growth and transpiration, yet are computationally economic. Here we develop such analyses and apply this to a rice population genotyped with a 700k SNP high-density array. Two rice diversity panels, indica and aus, containing a total of 553 genotypes, are phenotyped in waterlogged conditions. Using cubic smoothing splines to estimate plant growth and transpiration, we identify four time intervals that characterize the early responses of rice to salinity. Relative growth rate, transpiration rate and transpiration use efficiency (TUE) are analysed using a new association model that takes into account the interaction between treatment (control and salt) and genetic marker. This model allows the identification of previously undetected loci affecting TUE on chromosome 11, providing insights into the early responses of rice to salinity, in particular into the effects of salinity on plant growth and transpiration.


Figures

Figure 1
Figure 1. Relative growth rate (RGR) of salinity-induced responses comparing indica and aus.
(a) Smoothed RGR values were obtained from projected shoot area (PSA) values to which splines had been fitted, as shown in Supplementary Fig. 2. This was applied to the data from individual indica and (b) aus plants. The solid line represents the grand average of control conditions (blue) and saline conditions (red). In each panel, the RGB image of a rice plant on the left is representative of a plant 1 day before salt application. The RGB image on the top right side represents the same plant after 13 days of salt treatment, while the RGB image on the bottom right represents the same plant genotype at 13 days under control conditions. (c) Values of RGR at different time intervals for indica (n=528; partially replicated; median=0.13, 0.15, 0.11 and 0.10 for intervals: 2–9, 2–6, 6–9 and 9–13 days after salting, respectively) and (d) Values of RGR at different time intervals for aus (n=226; fully replicated; median=0.15, 0.17, 0.13 and 0.09 for intervals: 2–9, 2–6, 6–9 and 9–13 days after salting, respectively). (e) Table comparing the mean early growth response index (EGRI) at different time intervals for indica and aus. Min and max refer to the minimum and maximum means, respectively. s.d. refers to standard deviation. CI, confidence interval.
Figure 2
Figure 2. Transpiration of salinity-induced responses comparing indica and aus.
Spline curve fits of transpiration rate (TR) through time for individual (a) indica and (b) aus plants and transpiration use efficiency (TUE) through time for individual (c) indica and (d) aus plants. The solid blue lines represent the grand average spline in control conditions and the solid red lines represent the same in saline conditions. (e) Box plots of the TUE salinity tolerance index (salt/control), comparing indica (n=528; partially replicated; median=0.78, 0.84, 0.71 and 0.69 for intervals: 2–9, 2–6, 6–9 and 9–13, respectively) and aus (n=226; fully replicated; median=0.71, 0.75, 0.64 and 0.70 for intervals: 2–9, 2–6, 6–9 and 9–13 days after salting, respectively).
Figure 3
Figure 3. Marker-by-treatment interaction model using transpiration use efficiency in response to salinity.
SNPs are highlighted in green if they reach genome-wide significance for association with TUE at each time interval in (a) indica, (b) aus and (c) INDAUS. SNPs associated with TUE are shown at the different time intervals: 2–6, 6–9 and 9–13 days after treatment (panels top to bottom). Horizontal red lines indicate Bonferroni-adjusted threshold of α=0.05, which corresponded to P=8.99 × 10⁻⁶, 2.57 × 10⁻⁶ and 3.02 × 10⁻⁶ for the INDAUS, indica and aus subpopulations, respectively.

References

    1. Qadir M. et al. Economics of salt-induced land degradation and restoration. Nat. Resour. Forum 38, 282–295 (2014).
    1. Munns R. & Tester M. Mechanisms of salinity tolerance. Annu. Rev. Plant Biol. 59, 651–681 (2008). - PubMed
    1. Grattan S. R., Zeng L., Shannon M. C. & Roberts S. R. Rice is more sensitive to salinity than previously thought. Calif. Agric. 56, 189–195 (2002).
    1. Wicke B. et al. The global technical and economic potential of bioenergy from salt-affected soils. Energy Environ. Sci. 4, 2669 (2011).
    1. Vinod K. K., Krishnan S. G., Babu N. N., Nagarajan M. & Singh A. K. in Salt Stress in Plants eds Parvaiz Ahmad M., Azooz M., Prasad M. N. V. 219–260Springer (2013).

Publication types