. 2016 Nov 17:6:37130.
doi: 10.1038/srep37130.

Phosphorylation induces distinct alpha-synuclein strain formation

Affiliations

Phosphorylation induces distinct alpha-synuclein strain formation

Meng-Rong Ma et al. Sci Rep. .

Abstract

Synucleinopathies are a group of neurodegenerative diseases associated with alpha-synuclein (α-Syn) aggregation. Recently, increasing evidence has demonstrated the existence of different structural characteristics or 'strains' of α-Syn, supporting the concept that synucleinopathies share several common features with prion diseases and possibly explaining how a single protein results in different clinical phenotypes within synucleinopathies. In earlier studies, the different strains were generated through the regulation of solution conditions, temperature, or repetitive seeded fibrillization in vitro. Here, we synthesize homogeneous α-Syn phosphorylated at serine 129 (pS129 α-Syn), which is highly associated with the pathological changes, and demonstrate that phosphorylation at Ser129 induces α-Syn to form a distinct strain with different structures, propagation properties, and higher cytotoxicity compared with the wild-type α-Syn. The results are the first demonstration that post-translational modification of α-Syn can induce different strain formation, offering a new mechanism for strain formation.


Figures

Figure 1
Figure 1. Preparation and folding analysis of pS129 α-Syn.
(a) Semisynthesis strategy for the preparation of pS129 α-Syn. The scheme shows how recombinant α-Syn(1–106)SR was generated and how pS129 α-Syn was prepared via ligation and desulfurization. (b) SDS-PAGE analysis of the generation of pS129 α-Syn(A107C). After 4 h, the α-Syn(1–106)SR was converted to pS129 α-Syn(A107C) completely. (c) ESI-MS of pS129 α-Syn was performed to confirm the identity of the protein after desulfurization. The observed mass of 14,541.0 Da is consistent with the calculated mass of 14,538.1 Da. (d) Western blot analysis of WT α-Syn and pS129 α-Syn. The primary antibodies are indicated at the right side of each blot. (e) Characterization of WT α-Syn and pS129 α-Syn by CD in the absence or presence of lipid vesicles composed of POPG, in which are shown WT α-Syn (solid line, red), pS129 α-Syn (solid line, blue), WT α-Syn:POPG = 1:10 (dashed line, red), and pS129 α-Syn:POPG = 1:10 (dashed line, blue).
Figure 2
Figure 2. Structural characterization of WT fiber and PS fiber.
(a) TEM analyses of WT fiber (left) and PS fiber (right) after incubation for 1 week. (Scale bars: 200 nm.) (b) ThT fluorescence intensity of WT fiber and PS fiber. After 1 week of incubation, the ThT fluorescence was measured via mixing α-Syn fibers with the ThT solution, and the final concentrations of ThT and α-Syn fibers were 10 μM and 3.5 μM, respectively. (c) X-ray diffraction pattern of WT fiber (upper) and PS fiber (lower).Both fibers showed a typical cross-β diffraction pattern containing the characteristic reflections at 4.8 Å and 9.6 Å. Partial enlarged details are presented at the right of each pattern. The PS fiber had an additional reflection at 8.1 Å. (d) Proteolytic digestion patterns of WT (upper) and PS (lower) α-Syn fibers (30 μM according to monomer concentration) with 0.1 μg/mL PK at 25 °C, monitored over time (1 h) with silver-stained SDS-PAGE.
Figure 3
Figure 3. Toxicity of WT fiber and PS fiber.
(a) Cell viability of SH-SY5Y cells measured by MTT assay. SH-SY5Y cells were treated with buffer (black bar), 1 μM WT fiber (red bar), or 1 μM PS fiber (blue bar) for 24 h. (b) Caspase-3 activation in SH-SY5Y cells. SH-SY5Y cells were treated with buffer (black bar), 1 μM WT fiber (red bar), or 1 μM PS fiber (blue bar) for 24 h. Caspase-3 activation was measured with Caspase 3 Activity Assay Kit. (c) Intracellular ROS levels in SH-SY5Y cells. SH-SY5Y cells were treated with buffer (black bar), 1 μM WT (red bar), or 1 μM PS (blue bar) α-Syn fibers for 1 h and loaded with 2.5 μM 2′,7′-dichlorofluorescein diacetate (DCFH-DA) for 30 min. The fluorescence was measured with a plate reader. (d) Calcein release from POPG lipid vesicles induced by 10 μM WT (red curve) or 10 μM PS (blue curve) α-Syn fibers. Identical volumes of assembly buffer were added to the lipid vesicles to be used as control (black curve). The calcein-loaded lipid vesicles were treated with α-Syn fibers, and fluorescence was monitored for 1 h. In Fig. 3, values for WT and PS fibers are mean ± SD shown as percentages relative to controls. In (a,c), n = 6 independent measurements; in (b,d), n = 3 independent measurements. Statistical significance was determined by one-way ANOVA, *P < 0.05. (a)P = 0.0101, α-value: 0.05; (b) P = 0.0320, α-value: 0.050; (c) P = 0.0111, α-value: 0.050.
Figure 4
Figure 4. Propagation capacities of WT fiber and PS fiber in vitro.
(a) The kinetics of aggregation of WT monomeric α-Syn (35 μM) in the absence of preformed fiber (black dot) or presence of WT (red dot) or PS (blue dot) α-Syn fibers (3.5 μM based on monomer) monitored by ThT fluorescence. Data were obtained by subtracting the identical concentration of ThT solution. (b) ThT fluorescence intensity of WT2 and PS2 α-Syn fibers. WT monomeric α-Syn (70 μM) was incubated with 10% WT or PS fibers (7 μM based on monomer) for 1 week with constant agitation to form WT2 (red bar) and PS2 (blue bar) α-Syn fibers. After 7 days of incubation, ThT fluorescence were performed. (c) TEM analyses of WT2 fiber (left) and PS2 fiber (right) after incubation for 1 week. (Scale bars: 200 nm.) (d) Proteolytic digestion patterns of WT2 (left) and PS2 (right) α-Syn fibers with PK, monitored over time (1 h) with silver-stained SDS-PAGE. (e) Cell viability of SH-SY5Y cells treated with buffer (black bar), 1 μM WT2 α-Syn fiber (red bar), or 1 μM PS2 α-Syn fiber (blue bar) for 24 h, measured by MTT assay. Values for WT2 and PS2 fibers are mean ± SD (n = 6 independent measurements) shown as percentages relative to control. Statistical significance was determined by one-way ANOVA, *P < 0.05. P = 0.0104, α-value: 0.050.
Figure 5
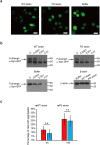
Figure 5. Propagation capacities of WT strain and PS strain in mammalian cells.
(a) Confocal images of N2a cells stably expressing GFP-tagged α-Syn treated with 1 μM WT and PS strains, respectively, for 18 h. Both strains induced intracellular foci formation. The confocal image of cells untreated with α-Syn strains was used as control; the intracellular α-Syn-GFP remained diffuse. Scale bar, 20 μm. (b) Western blot analysis of the proteolytic digestion patterns of α-Syn-GFP in N2a cells treated with 1 μM WT or PS strains for 24 h. The control cells were treated with the same volume of PBS. The cell lysate was harvested via sonication for 12 s on ice with a sonifier. Aliquots of cell lysate were exposed to increasing concentrations of PK (0.0001−0.01 μg/mL) for 10 min at 25 °C, and the degradation pattern was analyzed by western blot. The digestion patterns of α-Syn-GFP aggregates seeded by the WT strain were significantly different from those seeded by the PS strain. Both degradation patterns of α-Syn-GFP were significantly different from that of the control cells. Βeta-actin was used as a loading control. The molecular mass marker is shown on the right of each blot. (c) The percentage of N2a cells stably expressing GFP-tagged α-Syn with aggregates after treatment with 1 μM WT and PS strains, respectively, for 4 h or 18 h. The number of total cells and cells with aggregates were counted in a blind manner by two scientists. Values for all strains are mean ± SD (n = 3 independent measurements). Statistical significance was determined by one-way ANOVA. There is no significant difference between the two strains.

References

    1. Lashuel H. A., Overk C. R., Oueslati A. & Masliah E. The many faces of alpha-synuclein: from structure and toxicity to therapeutic target. Nat. Rev. Neurosci. 14, 38–48 (2013). - PMC - PubMed
    1. Goedert M., Clavaguera F. & Tolnay M. The propagation of prion-like protein inclusions in neurodegenerative diseases. Trends Neurosci. 33, 317–325 (2010). - PubMed
    1. Li J. Y. et al. Lewy bodies in grafted neurons in subjects with Parkinson’s disease suggest host-to-graft disease propagation. Nat. Med. 14, 501–503 (2008). - PubMed
    1. Hansen C. et al. α-Synuclein propagates from mouse brain to grafted dopaminergic neurons and seeds aggregation in cultured human cells. J. Clin. Invest. 121, 715–725 (2011). - PMC - PubMed
    1. Masuda-Suzukake M. et al. Prion-like spreading of pathological a-synuclein in brain. Brain 136, 1128–1138 (2013). - PMC - PubMed

Publication types

MeSH terms

LinkOut - more resources