. 2016 Nov 17:6:37289.
doi: 10.1038/srep37289.

Lent-On-Plus Lentiviral vectors for conditional expression in human stem cells

Affiliations

Lent-On-Plus Lentiviral vectors for conditional expression in human stem cells

Karim Benabdellah et al. Sci Rep. .

Abstract

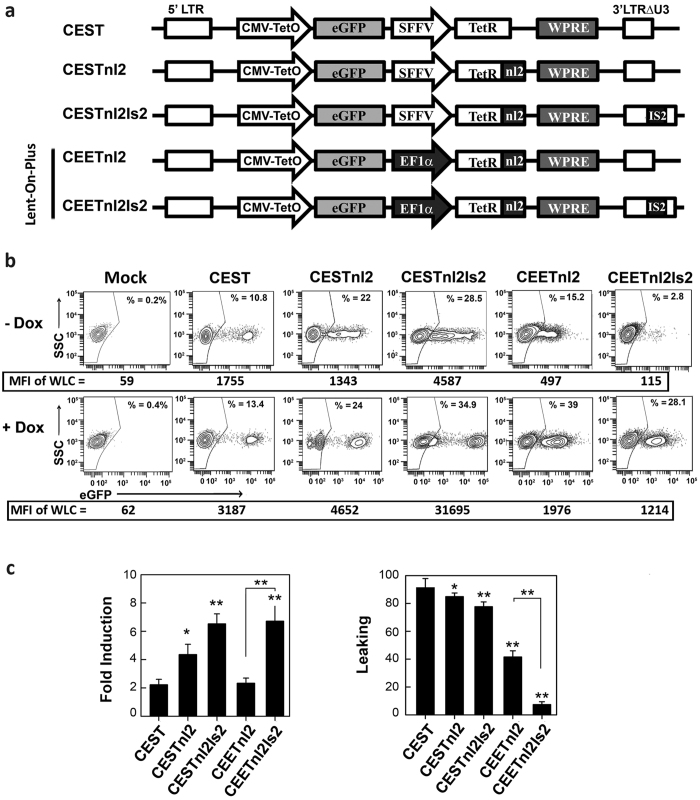
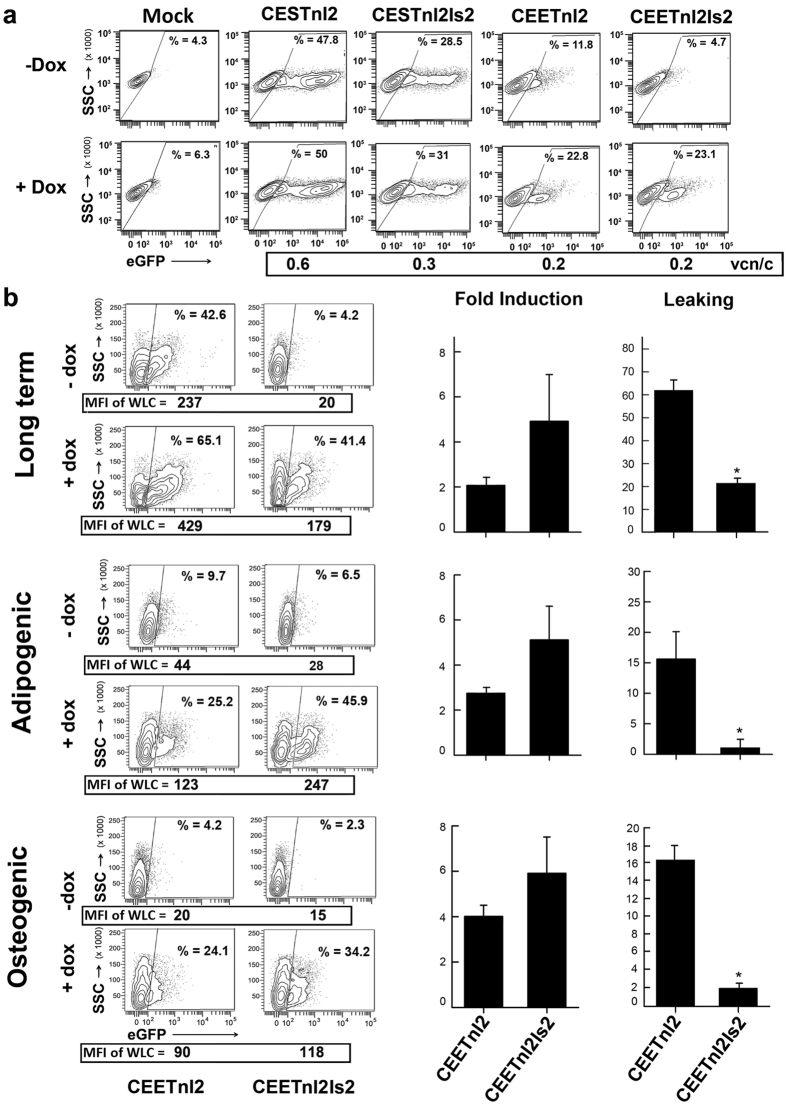
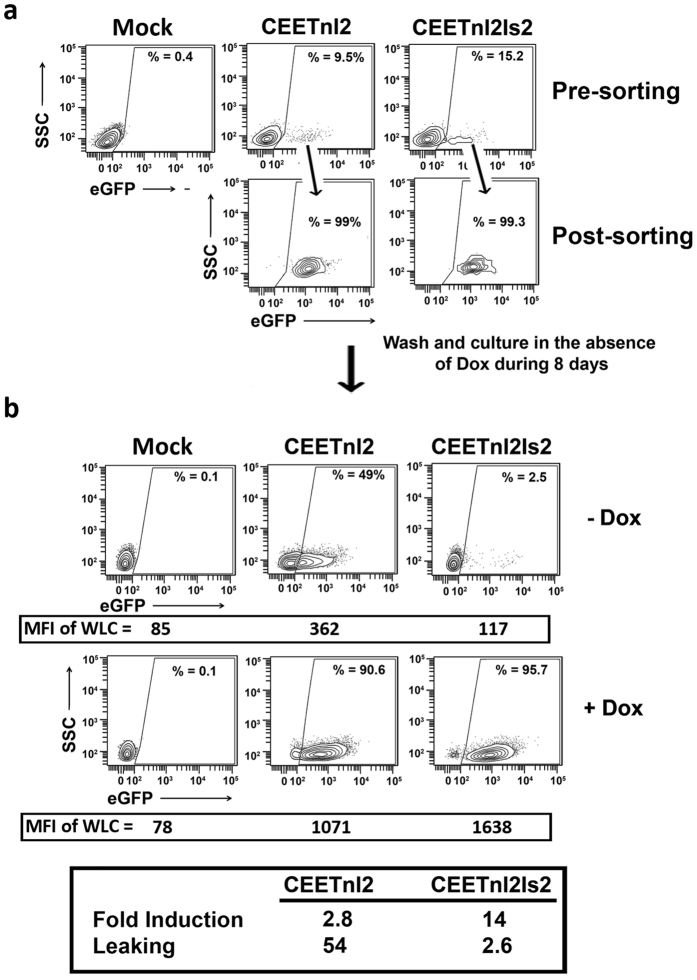
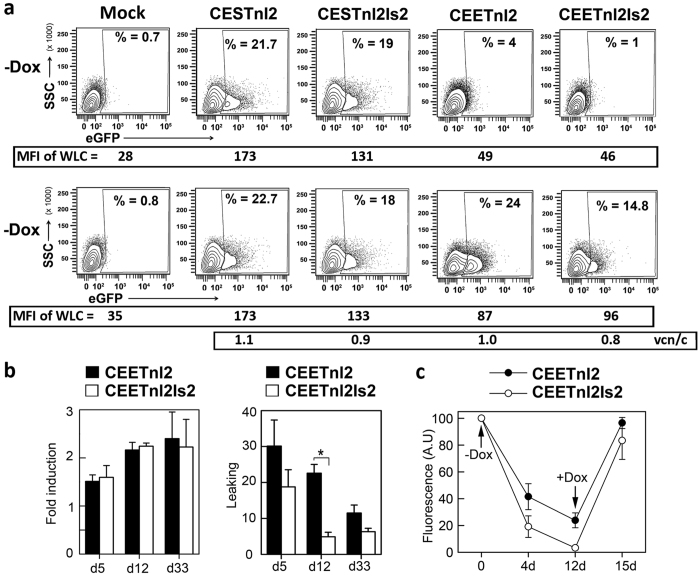
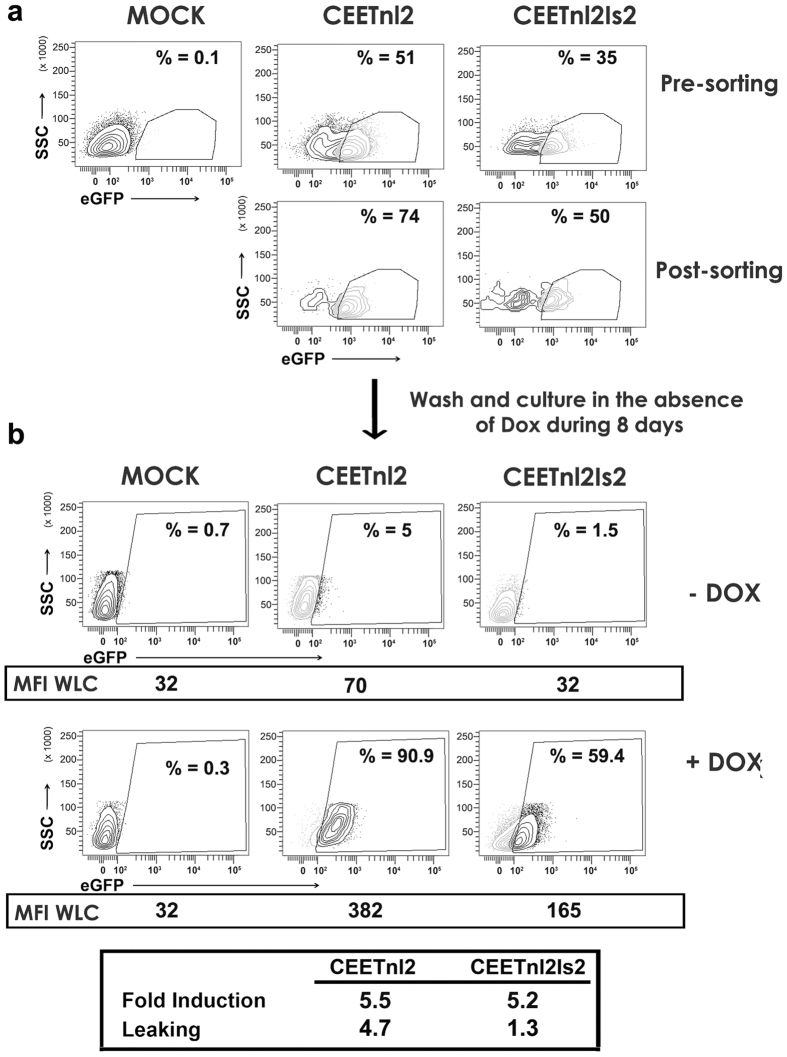
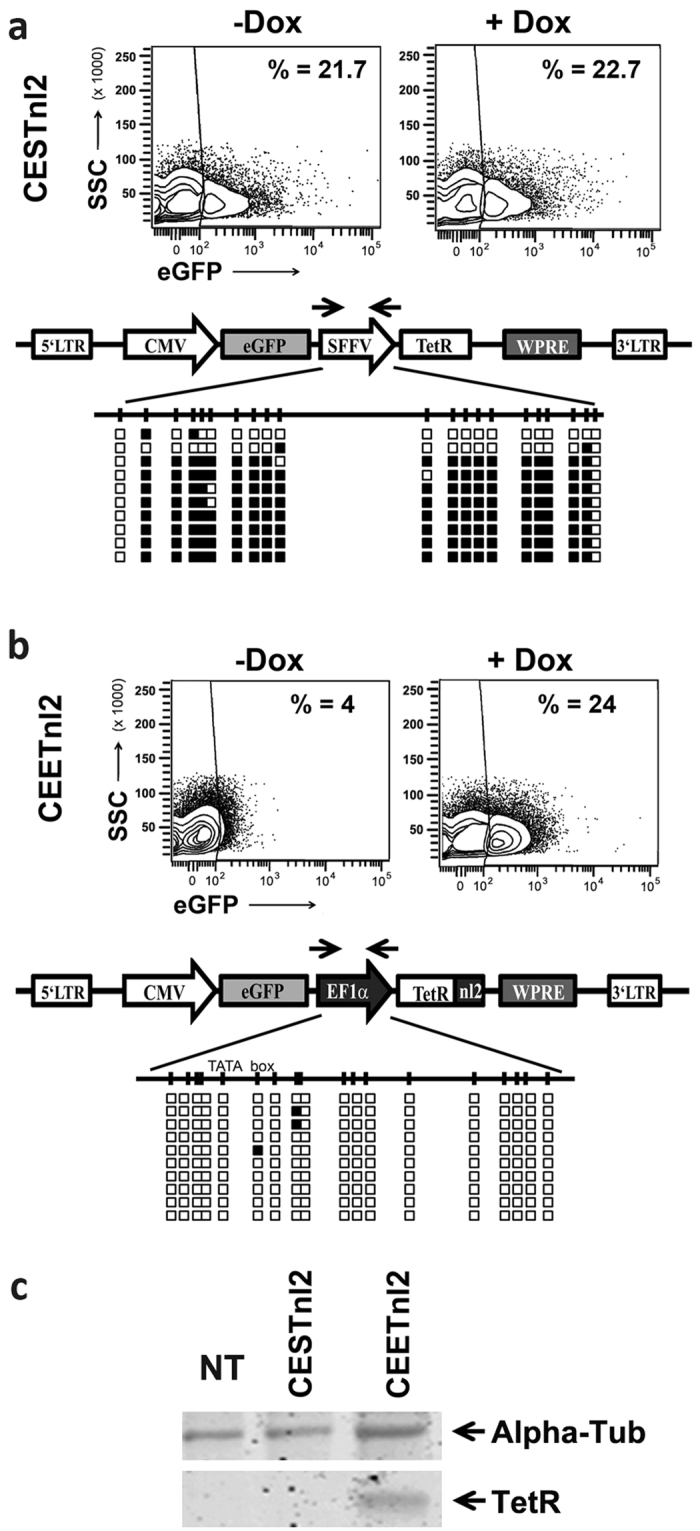
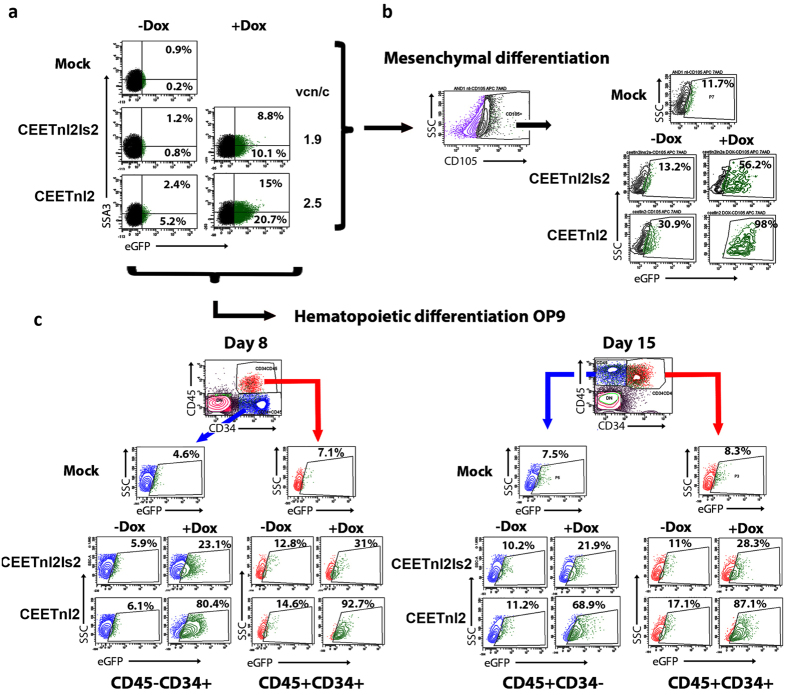
Conditional transgene expression in human stem cells has been difficult to achieve due to the low efficiency of existing delivery methods, the strong silencing of the transgenes and the toxicity of the regulators. Most of the existing technologies are based on stem cells clones expressing appropriate levels of tTA or rtTA transactivators (based on the TetR-VP16 chimeras). In the present study, we aim the generation of Tet-On all-in-one lentiviral vectors (LVs) that tightly regulate transgene expression in human stem cells using the original TetR repressor. By using appropriate promoter combinations and shielding the LVs with the Is2 insulator, we have constructed the Lent-On-Plus Tet-On system that achieved efficient transgene regulation in human multipotent and pluripotent stem cells. The generation of inducible stem cell lines with the Lent-ON-Plus LVs did not require selection or cloning, and transgene regulation was maintained after long-term cultured and upon differentiation toward different lineages. To our knowledge, Lent-On-Plus is the first all-in-one vector system that tightly regulates transgene expression in bulk populations of human pluripotent stem cells and its progeny.


Conflict of interest statement

The authors have applied for an spanish patent “Lent-On-Plus system for conditional expression on human stem cells”. Spanish application number: P201631406 Applicant: Fundación Progreso y Salud, Date of receipt 4 November 2016. This patent application does not alter the authors’ adherence to all the Scientific Report journal policies on sharing data and materials. Therefore all materials presented in the manuscript will be freely available to the scientific community although not for commercial purposes.

Figures

Figure 1
Figure 1. Second generation all-in-one LVs achieve tight transgene regulation in 293 T cells with just one copy integration/cell.
(a). Schematic representation of the CEST LV (top) and the new all-in-one Tet-On LVs developed in this study (CESTnl2, CESTnl2Is2 and the Lent-On-Plus LVs: CEETnl2 and CEETnl2Is2). CMV (CMV-TetO); eGFP (enhanced green florescence protein); SFFV (spleen focus forming virus LTR promoter); hEF1α (human eukaryotic translocation elongation factor α1 promoter); TetRnl2 (TetR repressor incorporating the nuclear localization signal of the glucocorticoid receptor: see Fig. S1 for details). (b) Representative plots showing eGFP expression profiles of untransduced 293 T (Mock) and 293 T cells transduced with the different LVs (as indicated at the top of each plot) in the absence (top) or presence (bottom) of Dox (0.1 μg/ml). A MOI = 0.3 was used to keep the percentage of eGFP+ cells below 30% (in order to keep transduced cells with only one LV integration). The gates of the eGFP+ populations were set to 0.2–0.4% of eGFP+ cells in the untransduced population (Mock; left plots) and subtracted to the % obtained under the different vectors and conditions for the analysis. The percentage (%) of the eGFP+ population (used to measure leaking) are shown in each plot. The MFI of the whole living cells (WLC) (used to measure fold induction) are indicated at the bottom of each plot (c). Graphs showing fold induction (left) and leaking (right) of the different LVs in 293 T. Fold induction and leaking were calculated as indicated in M&M. To measure leaking, the background (% of eGFP+ of Mock cells) were subtracted to the % of the eGFP+ under the different conditions. Values represent mean +/− standard error of the mean of at least four separate experiments (*p < 0.05; **p < 0.01). Asterisks indicate significance related to CEST (on top of the bars) or significance between the CEETnl2 and CEETnl2Is2 (as indicated in the Figure)
Figure 2
Figure 2. Performance of the different Tet-On LVs on hMSCs.
(a) Representative plots showing eGFP expression profiles of untransduced hMSCs (Mock) and hMSCs transduced with CESTnl2, CESTnl2Is2, CEETnl2 and CEETnl2Is2 LVs in the absence (top) or presence (bottom) of Dox (0.1 μg/ml). Since hMSCs are more resistant to LVs transduction than 293 T cells, a MOI = 1 was used to keep the percentage of transduced hMSCs below 30%. Vector copy number per cell (vcn/c) is indicated at the bottom of each plot. The gates of the eGFP+ populations were set to have 4–6% of eGFP+ cells in the untransduced population. The percentage (%) of the eGFP+ population are shown in each plot (b) hMSCs transduced with the Lent-On-Plus (CEETnl2 and CEETnl2Is2) LVs where kept in culture for up to 40 days (top plots and graphs) or differentiated toward the adipogenic (middle plots and graphs) and osteogenic (bottom plots and graphs) lineages. Representative plots showing eGFP expression profiles in the absence or presence of Dox are shown at the left and graphs showing fold induction and leaking are shown at the right. The MFI of the whole living cells (WLC) (used to measure fold induction) are indicated at the bottom of each plot. The gates of the eGFP+ were set to have 0.6%, 5,9% and 1.7% of eGFP+ cells in the untransduced population of the long term, adipogenic and osteogenic cells respectively (Fig. S5). Values represent mean +/− standard error of the mean of at least three separate experiments (*p < 0.05)
Figure 3
Figure 3. Performance of the Lent-On-Plus LVs on sorted hMSCs.
(a) Plots showing eGFP expression before (top plots) and after (bottom plots) purification of the eGFP+ populations of CEETnl2 and CEETnl2Is2-transduced hMSCs using fluorescence-activated cell sorting (FACS) Aria II Flow Cytometer. A MOI = 0.4 was used to keep the percentage of transduced hMSCs below 15%. (b) After sorting, the hMSCs were kept in the absence of Dox for 8 days and then induced (+Dox) or not (−Dox) for additional 5 days and analyzed for eGFP expression. The Percentages (%) of eGFP+ cells in the different population are shown inside each plot. The MFI of the whole living cells (WLC) (used to measure fold induction) are indicated at the bottom of each plot. Fold induction and leaking of the CEETnl2- and CEETnl2Is2-transduced sorted populations are indicated in the table (bottom).
Figure 4
Figure 4. Lent-On-Plus (CEETln2 and CEETln2Is2) LVs efficiently generates Doxycycline-responsive hESCs without selection or cloning.
(a) Representative plots showing eGFP expression profiles of hESCs (AND-1) control (Mock) and hESCs transduced with CESTnl2, CESTnl2Is2, CEETnl2 and CEETnl2Is2 LVs in the absence (top) or presence (bottom) of Dox (0.1 μg/ml). hESCs were transduced at MOI = 5 with the different LVs and analyzed 10 days later. The percentages (%) of the eGFP+ populations are shown in each plot. The MFIs of the whole living cells (WLC) are indicated at the bottom of each plot. The vcn/c of transduced cells are shown at the bottom of the figure. (b) Graphs showing fold induction (left) and leaking (right) of the CEETnl2 and CEETnl2Is2 LVs in hESCs at different time points during expansion (day 5, day 12 and day 33 post-transduction). Values represent mean +/− standard error of the mean of at least three separate experiments using AND-1 and H9 hESCs transduced at MOI = 5 with the different LVs (*p < 0.05). (c) Graph showing relative eGFP expression levels of CEETnl2 and CEETnl2Is2-transduced hESCs (AND-1) upon withdrawal (day 0) and addition (Day 12) of Dox along time in culture. Data represent fluorescence intensity relative to Day 0. Values represent mean +/− standard error of the mean of at least three separate experiments.
Figure 5
Figure 5. Performance of the Lent-On-Plus LVs on sorted hESCs.
(a) Plots showing eGFP expression before (Pre-sorting) and after (Post-sorting) purification of the eGFP+ populations of CEETnl2 and CEETnl2Is2-transduced hESCs using fluorescence-activated cell sorting (FACS) Aria II Flow Cytometer. A MOI = 30 was used to achieve over 35% eGFP+ cells and good expression levels. (b) Sorted hESCs were kept in the absence of Dox for 8 days and then induced (+Dox) or not (−Dox) for additional 5 days and analyzed for eGFP expression. The Percentages (%) of eGFP+ cells are shown inside each plot. The MFI of the whole living cells (WLC) (used to measure fold induction) are indicated at the bottom of each plot. Fold induction and leaking of the CEETnl2- and CEETnl2Is2-transduced sorted populations are indicated in the table (bottom).
Figure 6
Figure 6. Methylation analysis of all-in-one Tet-ON LVs in hESCs.
DNA from CESTnl2- (a) and CEETnl2- (b) transduced hESCs were extracted at day 15 post-transduction and converted with sodium bisulfate (see M&M for details). Plots showing Dox responsiveness of CESTnl2 and CEETnl2 at the time of lysis are shown at the top of (a,b) respectively. The converted DNA was subjected to PCR using the primers pair indicated in each figure and sequenced. The drawing below the LV schemes (bottom panels in (a,b)) represents the CpG islands contained in the promoter region that was analyzed. Black and white boxes represent methylated and unmethylated CpG respectively. It can be observed that SFFV is highly methylated in AND-1 (a) while hEF1α is highly resistant to methylation (b). (c) TetR expression is restricted to the CEET-transuced hESCs. hESCs (AND-1) transduced with the CESTnl2 and CEETnl2 were lysed and analyzed for TetR expression by Western Blot (see M&M for details).
Figure 7
Figure 7. Transgene regulation of Lent-On-Plus (CEETnl2 and CEETnl2Is2) in mesenchymal and hematopoietic cells derived from hESCs.
(a) AND-1 hESC were transduced with concentrated Lent-On-Plus (CEETnl2 and CEETnl2Is2) LVs. eGFP and SSA3 (a pluripotency marker) expressions were analyzed in the presence (left plots) or absence (right plots) of Dox (0.1 μg/ml). The gate of the eGFP+ populations were set to have 0.5–1-% of SSE3+eGFP+ cells in untransduced population (Mock; top plot). (b) Lent-On-Plus regulatable hESCs were differentiated to mesenchymal stromal cells (see M&M for details). At day 10 of differentiation Dox was added and eGFP expression levels analyzed 5 days later. The plots show eGFP expression levels in the CD105 population of untransduced (Mock; top plot), CEETnl2Is2-transduced (middle plots) and CEETnl2 (bottom plots) in the presence or absence of Dox as indicated at the top of the plots. (c) Lent-On-Plus regulatable hESCs were differentiated toward the hematopoietic lineage using the OP9 differentiation protocol (see M&M for details). The cells were maintained in the presence or absence of Dox from day 1 of differentiation and the eGFP expression analyzed in the different hematopoietic populations (CD45 − CD34+, CD45+CD34+ and CD45+CD34−) as indicated at the different days (Day 8; Top-Left plot and Day 15; Top-right plot). Background levels in untransduced hESCs were set between 4.6–8.3% for each population (arrows) at each day of differentiation (Mock, second top plots). The percentage of cells expressing eGFP in the presence or absence of Dox of the CEETnl2- and CEETnl2Is- transduced hESCs are shown inside each plot for each hematopoietic population.

References

    1. DeRouen M. C., McCormick J. B., Owen-Smith J. & Scott C. T. The race is on: human embryonic stem cell research goes global. Stem Cell Rev 8, 1043–1047 (2012). - PMC - PubMed
    1. Ting D. T., Kyba M. & Daley G. Q. Inducible transgene expression in mouse stem cells. Methods Mol Med 105, 23–46 (2005). - PubMed
    1. Goverdhana S. et al. Regulatable gene expression systems for gene therapy applications: progress and future challenges. Mol Ther 12, 189–211 (2005). - PMC - PubMed
    1. Ormsbee Golden B. D., Wuebben E. L. & Rizzino A. Sox2 expression is regulated by a negative feedback loop in embryonic stem cells that involves AKT signaling and FoxO1. PLoS ONE 8, e76345 (2013). - PMC - PubMed
    1. Vieyra D. S. & Goodell M. A. Pluripotentiality and conditional transgene regulation in human embryonic stem cells expressing insulated tetracycline-ON transactivator. Stem Cells 25, 2559–2566 (2007). - PubMed

Publication types