

Trade-offs between robustness and small-world effect in complex networks
- PMID: 27853301
- PMCID: PMC5112524
- DOI: 10.1038/srep37317
Trade-offs between robustness and small-world effect in complex networks
Abstract
Robustness and small-world effect are two crucial structural features of complex networks and have attracted increasing attention. However, little is known about the relation between them. Here we demonstrate that, there is a conflicting relation between robustness and small-world effect for a given degree sequence. We suggest that the robustness-oriented optimization will weaken the small-world effect and vice versa. Then, we propose a multi-objective trade-off optimization model and develop a heuristic algorithm to obtain the optimal trade-off topology for robustness and small-world effect. We show that the optimal network topology exhibits a pronounced core-periphery structure and investigate the structural properties of the optimized networks in detail.
Figures
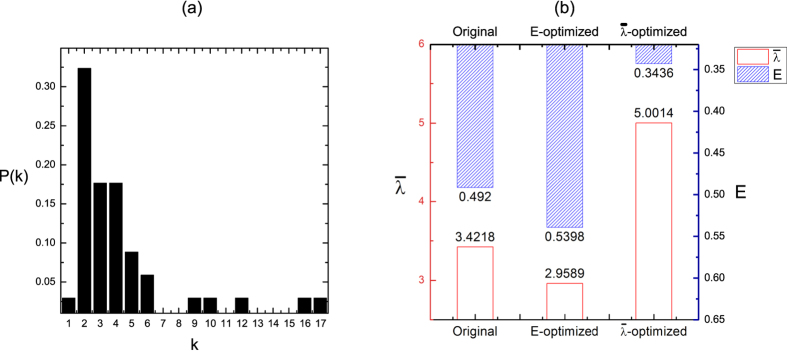
 (red) and E (blue) before and after the optimization. The real network is the social network in a karate club at a US university in the 1970s. It has 34 nodes and 78 links. The length of column with red line corresponds to the value of
  axis, while the column with blue shading corresponds to the E axis. The results are averaged over 100 independent realizations.
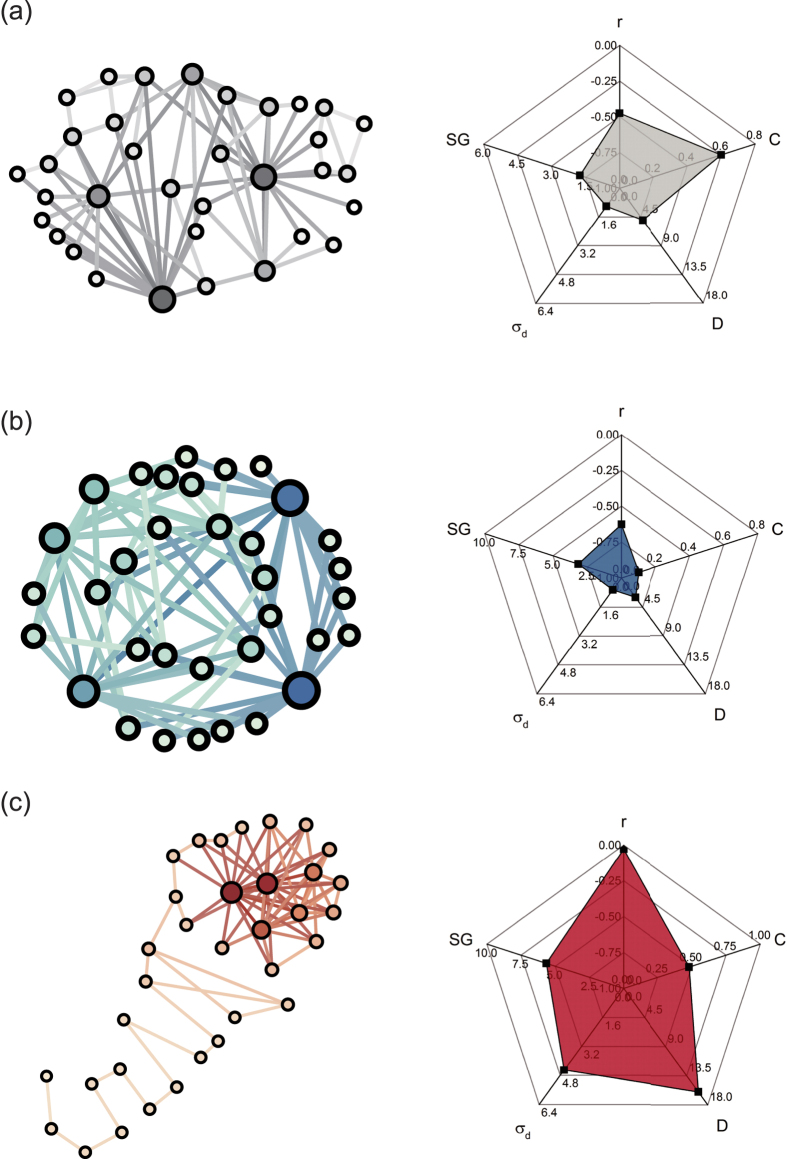
 -optimized network have the same degree sequence. The degree of node is proportional to its size. The radar graphs show the values of topology metrics including assortativity coefficient r, clustering coefficient C, network diameter D, standard deviation of distance distribution σd and spectral gap SG.
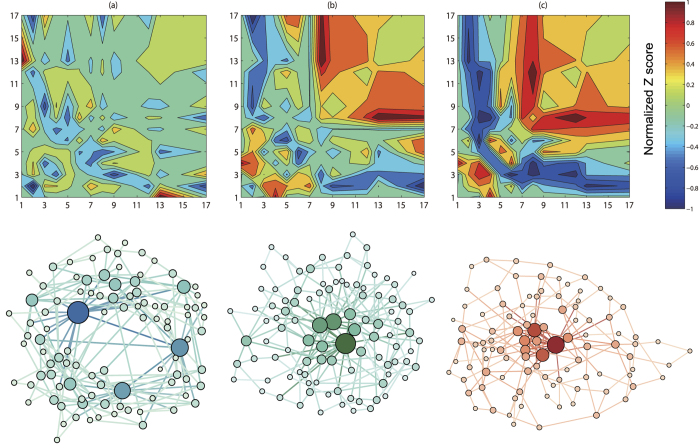
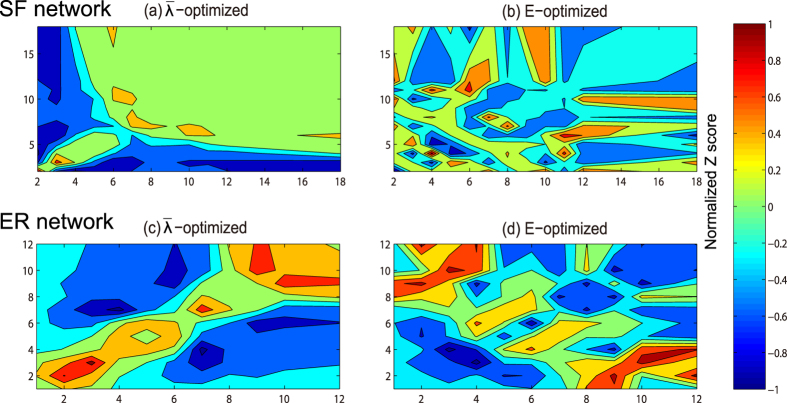
 . (b) The network with both relatively high
  and E. (c) The network with high
  and low E. The Z score value is normalized to a range of −1 to 1 and indicated by the color. The higher the value of Z(di, dj) score is, the more links between di-degree nodes and dj-degree nodes the network has.
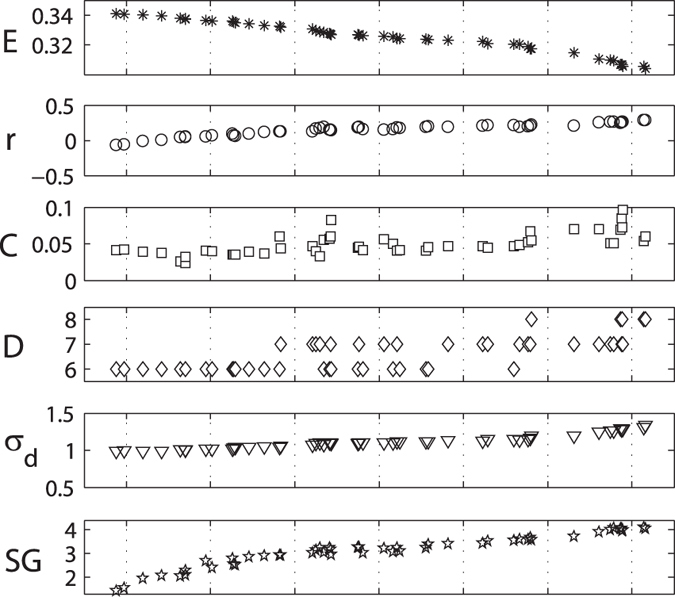
 .
.
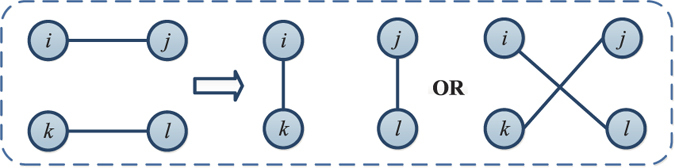
 is the set of nodes which connect to node i in Gr1 but disconnect to node i in Gr2. Similarly, Vi(Gr2) and
  can be obtained. Here
  and
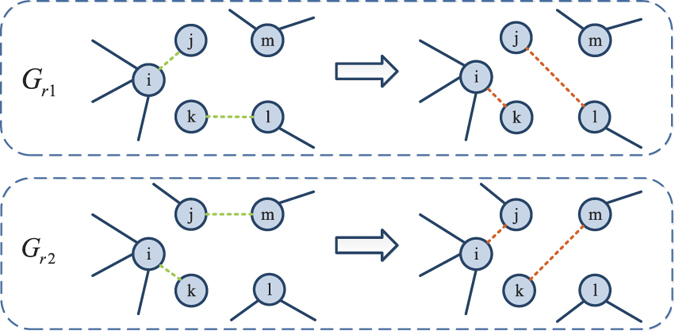
and  . Then randomly select a node m in Gr2 which connects to node j but disconnects to node k. In Gr1, links eij and ekl are removed, and links eik and ejl are added. In Gr2, links eik and ejm are removed, and links eij and ekm are added. The green dot lines represent the selected links for cross operator in original network. The red dot lines represent the generated links after cross operator.
References
-
- Albert R. & Barabási A. L. Statistical mechanics of complex networks. Reviews of Modern Physics 74, 47–51 (2002).
-
- Newman M. E. J. The structure and function of complex networks. Siam Review 45, 167–256 (2003).
-
- Boccaletti S., Latora V., Moreno Y., Chavez M. & Hwang D. U. Complex networks: Structure and dynamics. Physics Reports 424, 175–308 (2006).
-
- Amaral L. A. N. & Uzzi B. Complex systems - a new paradigm for the integrative study of management, physical, and technological systems. Management Science 53, 1033–1035 (2007).
-
- Alderson D. L. Catching the ‘network science’ bug: Insight and opportunity for the operations researcher. Operations Research 56, 1047–1065 (2008).
Publication types
LinkOut - more resources
Full Text Sources
Other Literature Sources
