. 2016 Nov 17:6:37436.
doi: 10.1038/srep37436.

Aβ42 oligomers modulate β-secretase through an XBP-1s-dependent pathway involving HRD1

Affiliations

Aβ42 oligomers modulate β-secretase through an XBP-1s-dependent pathway involving HRD1

Yannis Gerakis et al. Sci Rep. .

Abstract

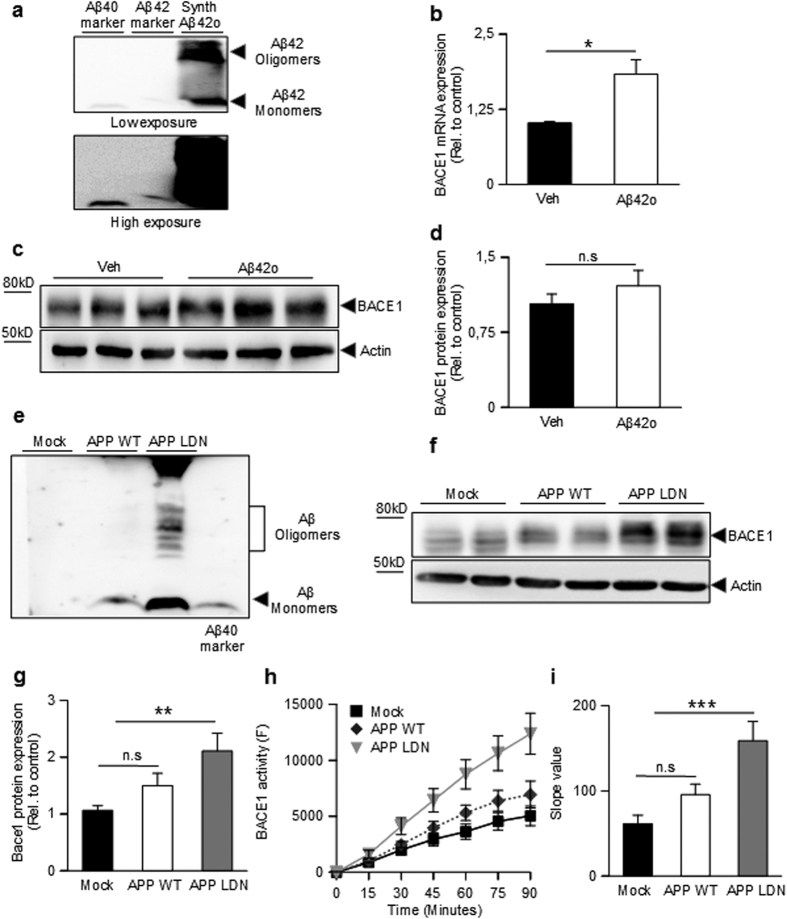
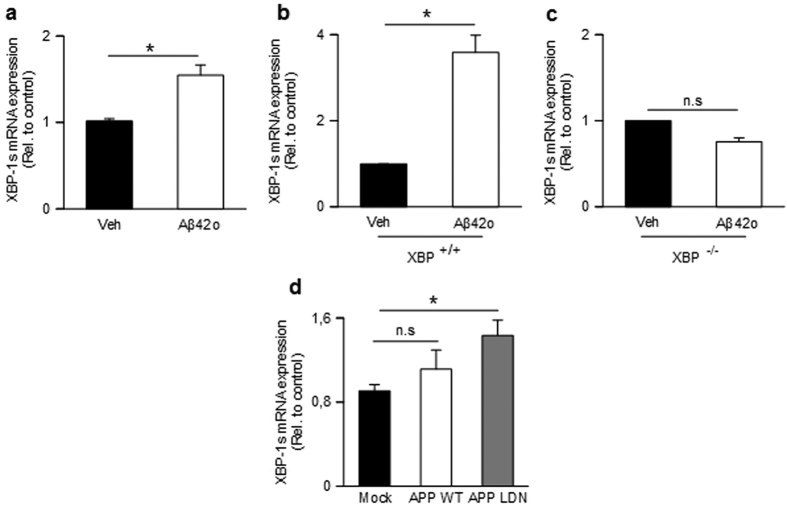
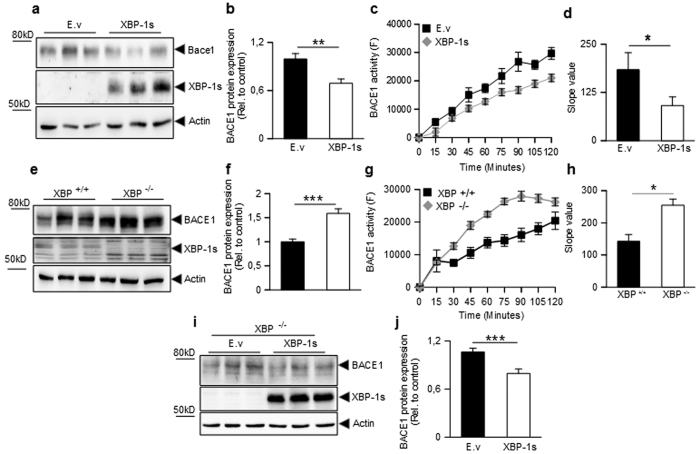
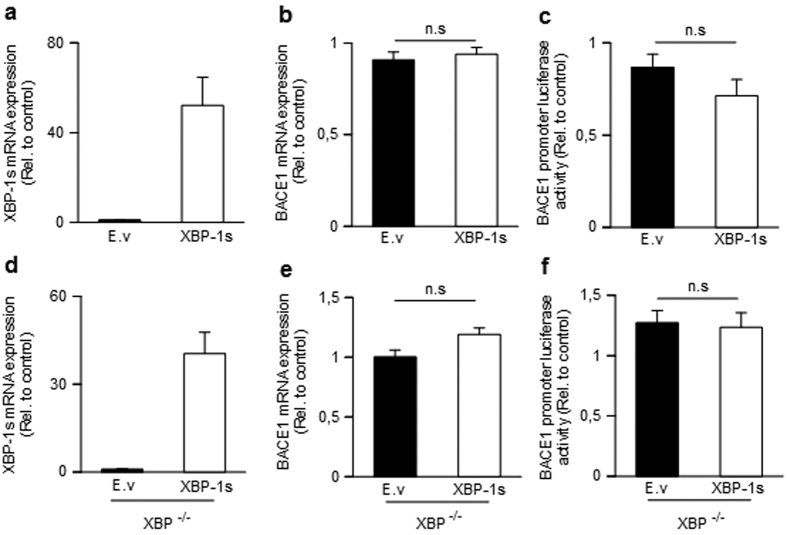
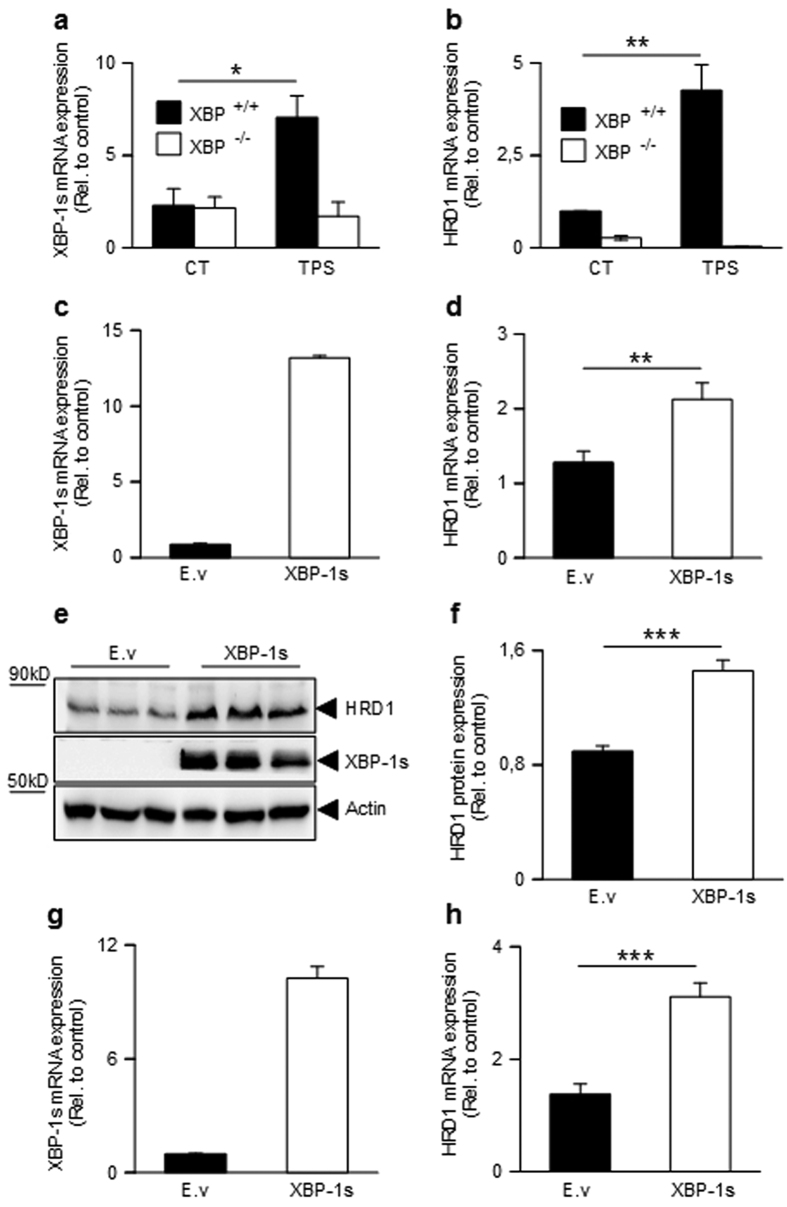
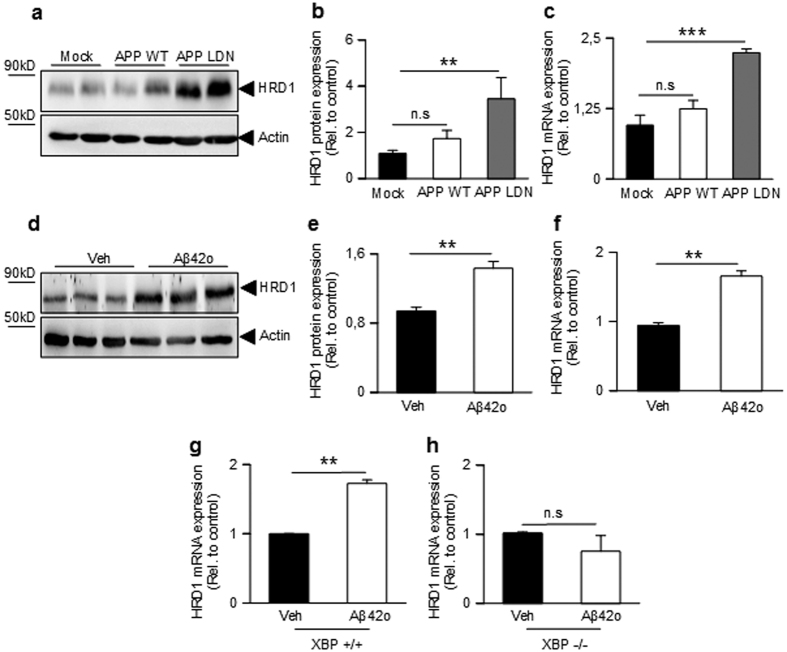
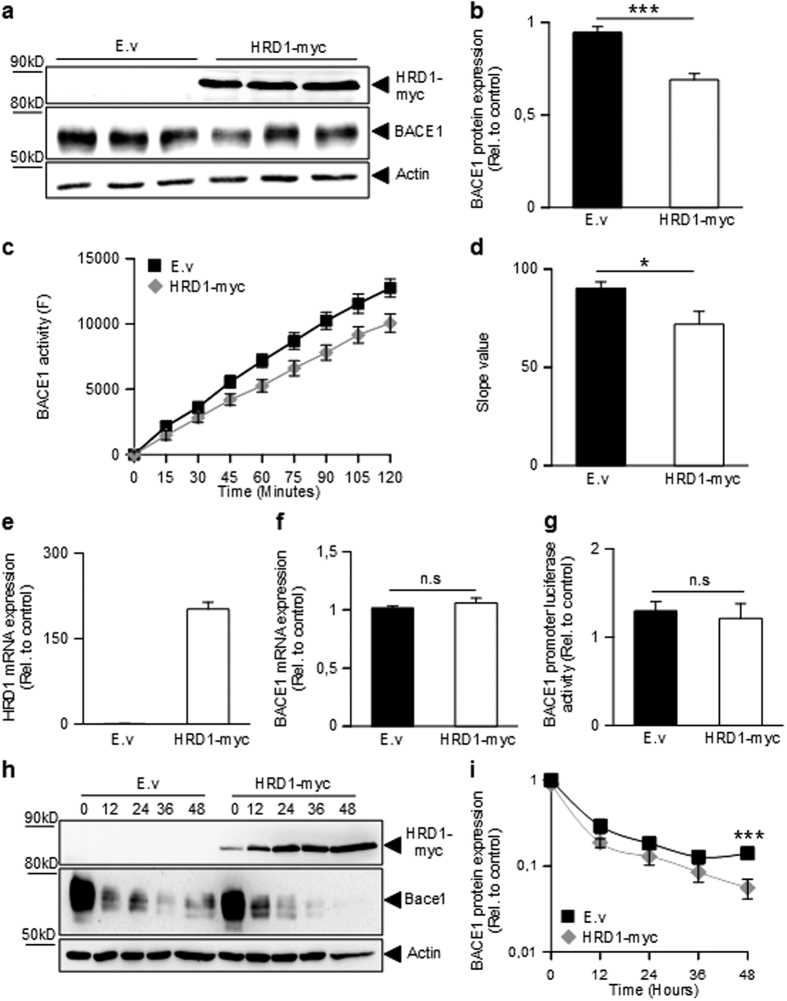
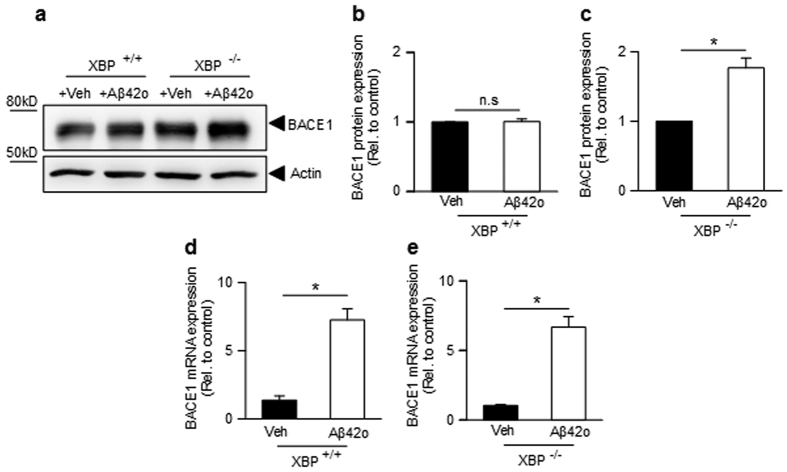
The aspartyl protease β-site APP cleaving enzyme, BACE1, is the rate-limiting enzyme involved in the production of amyloid-β peptide, which accumulates in both sporadic and familial cases of Alzheimer's disease and is at the center of gravity of the amyloid cascade hypothesis. In this context, unravelling the molecular mechanisms controlling BACE1 expression and activity in both physiological and pathological conditions remains of major importance. We previously demonstrated that Aβ controlled BACE1 transcription in an NFκB-dependent manner. Here, we delineate an additional cellular pathway by which natural and synthetic Aβ42 oligomers enhance active X-box binding protein XBP-1s. XBP-1s lowers BACE1 expression and activity indirectly, via the up-regulation of the ubiquitin-ligase HRD1 that acts as an endogenous down-regulator of BACE1. Thus, we delineate a novel pathway by which cells could compensate for Aβ42 oligomers production and thus, associated toxicity, by triggering a compensatory mechanism aimed at lowering BACE-1-mediated Aβ production by a molecular cascade involving XBP-1s and HRD1. It thus identifies HRD1 as a potential target for a novel Aβ-centered therapeutic strategy.


Figures

Figure 1
Figure 1. Influence of synthetic and natural Aβ42 oligomers on BACE1.
(a) Western blot analysis of synthetic Aβ42 oligomers (Aβo) obtained as described in the Methods. (b) Quantitative PCR analysis of BACE1 mRNA levels in SH-SY5Y neuroblastoma cells treated overnight with synthetic Aβo. BACE1 mRNAs are normalized using the expression of human Rpl69 housekeeping gene. (c,d) Western blot analysis (c) and densitometric quantification (d) of BACE1 expression in Aβo-treated SH-SY5Y cells. Graphs show the mean of three independent experiments (6 and 8 biological replicates per group in (b and d), respectively). A Student one-tailed T-test is applied for statistics (*p-value = 0,02 and n.s = non significant, in (b and d), respectively). (e) Western blot analysis of media recovered from CHO cells stably overexpressing either wild type βAPP (APPWT) or βAPP bearing the London mutation (APPLDN) compared to mock-transfected CHO cells. (f,g) Western blot analysis (f) and densitometric analysis of BACE1 (g) protein expression in the indicated cell lines. The graph shows the mean of 5 independent experiments (10 biological replicates per group). For statistics, a one-way ANOVA followed by a post hoc Bonferroni-Holm test is applied (**p-value = 0,0053 alpha 0,01; n.s non significant). (h) Specific BACE1 activity measured in the indicated cell line. BACE1 activity corresponds to the inhibitor-sensitive fluorimetry and is expressed relatively to control and normalized by protein quantification using Bradford method. The graph represents the mean BACE1 activity of 4 independent experiments, with 8 biological replicates plotted per group. (i) Represents the slope value of the curves in (h). Statistic analysis is as in B (***p-value = 0,001 alpha 0,01; n.s non significant).
Figure 2
Figure 2. Influence of synthetic and natural Aβ42 oligomers on XBP-1s mRNA levels.
(a) Quantitative PCR analysis of XBP-1s mRNA in SH-SY5Y (a), XBP+/+ (b) and XBP−/− (c) cells treated overnight with synthetic Aβo. XBP-1s mRNAs are normalized using the expression of human Rpl69 housekeeping gene. The graphs show the mean of three independent experiments (6 and 3 biological replicates per group in (a,b and c), respectively). Student one-tailed T-test is applied for statistics (*p-value = 0,02 (a) and 0,03 (b,c); n.s non-significant). (d) Quantitative PCR analysis of XBP-1s mRNA in indicated CHO cell lines. XBP-1s mRNAs are normalized as above and graph shows the mean of 3 independent experiments (9 biological replicates per group). Statistical analysis is performed by a one-way ANOVA followed by a post hoc Bonferroni-Holm is applied (*p-value = 0,02 alpha 0,05; n.s, non-significant).
Figure 3
Figure 3. Modulation of BACE1 expression and catalytic activity by XBP-1s.
(a–h) Western blot analysis (a,e), densitometric quantification (b,f) and specific activities (c,g) of BACE1 24 hours after transient transfection of HEK293 cells with XBP-1s encoding vector or empty vector (E.v) (a–c) or in XBP+/+ or XBP−/− mouse fibroblasts (e–g). BACE1 activity is expressed relatively to control and normalized by protein quantification using Bradford method. Graphs represents the mean of 6 (b), 3 (c,g), and 5 (f) independent experiments and correspond to 24 (b), 9 (c) and 15 (f,g) biological replicates per group. In (d and h), bars represent the slope values of the curves presented in (c and g), respectively. All statistics are carried out with student one-tailed T-test: (**p-value = 0,0076 (B); *p-value = 0,04 (D); ***p-value = 0,0006 (f); *p-value = 0,04 (h). (i,j) Western blot analysis (i) and densitometric quantification (j) of BACE1 expression 24 hours after transient transfection of XBP−/− cells with either control empty vector (E.v) or XBP-1s cDNA. Bars in (j) are the mean of 5 independent experiments (15 biological replicates per group). ***p-value = 0,0002.
Figure 4
Figure 4. Influence of XBP-1s on BACE1 promoter transactivation and mRNA levels.
(a,b) Quantitative PCR analysis of XBP-1s (a,d) and BACE1 (b,e) mRNA levels 24 hours after transient transfection of HEK293 (a,b) or XBP1−/− (d,e) cells with either empty vector (E.v) or XBP-1s cDNA. BACE1 and XBP-1s mRNAs are normalized using the expression of Rpl69 housekeeping gene. (c,f) Luciferase activity measured in HEK293 (c) or XBP1−/− (f) cells co-transfected with either empty vector (E.v) or XBP-1s cDNA, a BACE1 human promoter in frame with luciferase transcript (see methods) and a vector coding for beta-galactosidase. Luciferase activity was normalized with beta-galactosidase activity and protein concentration of samples and then expressed relatively to control. Graphs show the mean of four (ac) or 3 (d–f) independent experiments corresponding to 24 (a,b), 12 (c) and 18 (d–f) biological replicates per group. Student one-tailed T-test is applied for statistics (n.s not significant).
Figure 5
Figure 5. Modulation of HRD1 by thapsigargin and XBP-1s in human cells and XBP-depleted cells.
(a,b) Quantitative PCR analysis of XBP-1s (a,c) and HRD1 (b,d) mRNA levels in XBP+/+ or XBP−/− fibroblasts control (Ct) or treated 6 hours with thapsigargin (1 μM, TPS, (a,b) or 24 hours after transient transfection of HEK293 cells with empty vector (E.v.) or XBP-1s (c,d). (e,f) Western blot analysis (e) and densitometric quantification (f) of HRD1 protein expression in HEK293 cells transiently transfected with XBP-1s as above. (g,h) Quantitative PCR analysis of XBP-1s (g) and HRD1 (h) mRNA levels 24 hours after transient transfection of XBP−/− cells with either empty vector (E.v.) or XBP-1s. All HRD1 and XBP-1s mRNAs are normalized using the expression of mouse Rpl69 housekeeping gene. Graphs shows the mean of 3 independent experiments, 6 (a,b), 18 (c,d,g,h) and 9 (f) biological replicates per condition. Student one-tailed T-test are applied for statistics (*p-value = 0,02 (a); **p-value = 0,01 (b); **p-value = 0,004 (d); ***p-value = 0,00001 (f); ***p-value 0,00007 (h)).
Figure 6
Figure 6. Effect of synthetic and natural Aβ42o on HRD1 protein and mRNA expressions and effect of Aβ42o on BACE1 in XBP−/− fibroblasts.
(a–f) Western blot (a,d), densitometric analysis (b,e) and mRNA levels (c,f) of HRD1 in indicated CHO cell lines (a–c) or in synthetic Aβo-treated SH-SY5Y (d–f). (g,h) Quantitative PCR analysis of HRD1 mRNA levels in Aβo-treated XBP+/+ (g) and XBP−/− (h) cells. HRD1 mRNAs are normalized using the expression of Top1 housekeeping gene (CHO cell line) or Rpl69 (SH-SY5Y and fibroblasts). Graphs show the mean of 4 (b) or 3 (c,eh) independent experiments corresponding to 10 (b), 6 (c,f), 8 (e) and 3 (g,h) biological replicates per group. In (b and c), a one-way ANOVA followed by a post hoc Bonferroni-Holm test is applied for statistics (**p-value = 0,01 alpha 0,05 (b) and ***p-value = 0,00000246 alpha 0,01 (c); n.s non significant). In (eh), a student one-tailed T-test is applied for statistics (**p-value = 0,002 (e), **p-value = 0,01 (f); **p-value = 0,0047 (g); n.s: not significant).
Figure 7
Figure 7. HRD1 controls BACE1 at a post-transcriptional level.
Western blot analysis (a), densitometric quantification (b) and specific activities (c) of BACE1 24 hours after transient transfection of HEK293 cells with control (E.v) or HRD1-myc cDNA. BACE1 activity is expressed relatively to control and normalized by protein quantification using Bradford method. Graphs represents the mean of 6 (b) and 3 (c) and correspond to 18 (b) and 9 (c) biological replicates per group. (d) Represents the slope value of the curve presented in (c). Student one-tailed T-test is applied for statistics (***p-value = 7 × 10−8 (b) and *p-value = 0,03 (c). (e,f) Quantitative PCR analysis of HRD1 and BACE1 mRNA 24 hours after transient transfection of HEK293 cells with control (E.v) or HRD1-myc cDNA. BACE1 and HRD1 mRNAs are normalized using the expression of human Rpl69 housekeeping gene. The graph shows the mean of 3 independent experiments (9 biological replicates per group). Student one-tailed T-test is applied for statistics (n.s non significant). (g) Luciferase activity measured in HEK293 cells co-transfected with control or HRD1 coding vector, a BACE1 human promoter in frame with luciferase and a vector coding for beta-galactosidase. Luciferase activity was normalized with beta-galactosidase activity and protein concentration of samples and then expressed relatively to control. The graph shows the mean of 3 independent experiments (18 replicates per group). Student one-tailed T-test is applied for statistics (n.s non significant). (h) Western blot analysis of HEK293 cells transiently transfected with control (E.v.) or HRD1-myc cDNA for 12 h before treatment with cycloheximide (1 μM) up to 48 h. (i) Densitometric analysis of BACE1 expression normalized with actin and represented relatively to control (cells transfected with control vector at T0) through time. Note that ordinate axis follows a logarithmic scale. The graph shows the quantification of four independent experiments (4 replicates per condition). Student one-tailed T-test is applied for statistics (***p-value = 0,001).
Figure 8
Figure 8. Influence of XBP1 depletion on Aβ42o-induced effect on BACE1 protein and mRNA expression.
(ac) Western blot analysis (a), densitometric quantification (b,c) and quantitative PCR mRNA analysis (d,e) of BACE1 after an overnight treatment of XBP+/+ (a,b,d) or XBP−/− (a,c,e) fibroblasts. BACE1 mRNAs are normalized using the expression of human Rpl69 housekeeping gene. Bars show the mean of 3 independent experiments (3 biological replicates per group). Student one-tailed T-test is applied for statistics (*p-value = 0,03 (c); *p-value = 0,03 (d); *p-value = 0,02) (e).

Similar articles

Cited by

References

    1. Selkoe D. J. The molecular pathology of Alzheimer’s disease. Neuron 6, 487–498 (1991). - PubMed
    1. Checler F. Processing of the beta-amyloid precursor protein and its regulation in Alzheimer’s disease. J Neurochem 65, 1431–1444 (1995). - PubMed
    1. Zhang H., Ma Q., Zhang Y. W. & Xu H. Proteolytic processing of Alzheimer’s beta-amyloid precursor protein. J Neurochem 120 Suppl 1, 9–21, doi: 10.1111/j.1471-4159.2011.07519.x (2012). - DOI - PMC - PubMed
    1. Vassar R., Kovacs D. M., Yan R. & Wong P. C. The beta-secretase enzyme BACE in health and Alzheimer’s disease: regulation, cell biology, function, and therapeutic potential. J Neurosci 29, 12787–12794, doi: 10.1523/JNEUROSCI.3657-09.2009 (2009). - DOI - PMC - PubMed
    1. Pardossi-Piquard R. & Checler F. The physiology of the beta-amyloid precursor protein intracellular domain AICD. J Neurochem 120 Suppl 1, 109–124, doi: 10.1111/j.1471-4159.2011.07475.x (2012). - DOI - PubMed

Publication types

MeSH terms