

A Mouse Model for Binge-Level Methamphetamine Use
- PMID: 27853417
- PMCID: PMC5090006
- DOI: 10.3389/fnins.2016.00493
A Mouse Model for Binge-Level Methamphetamine Use
Abstract
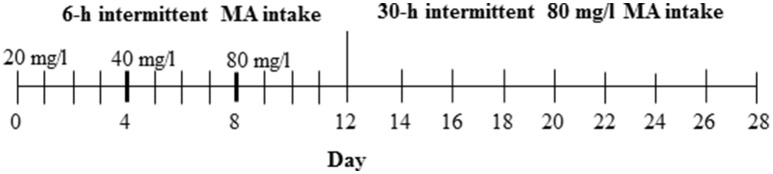
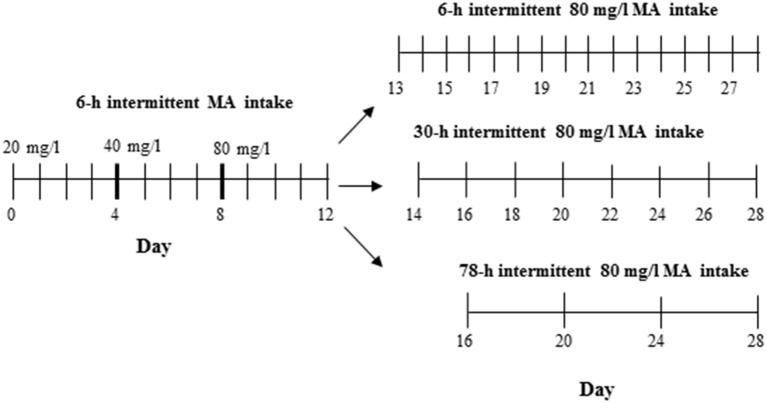
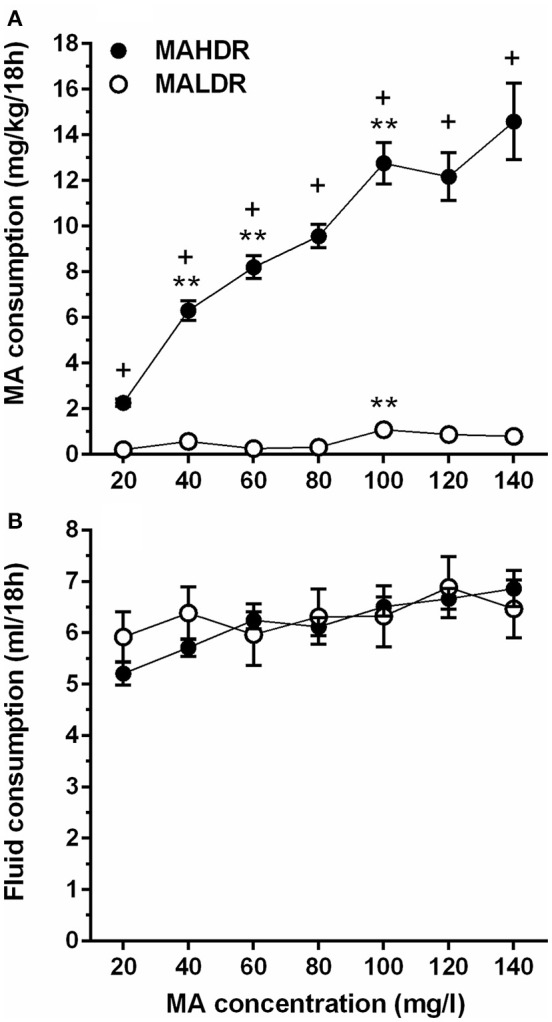
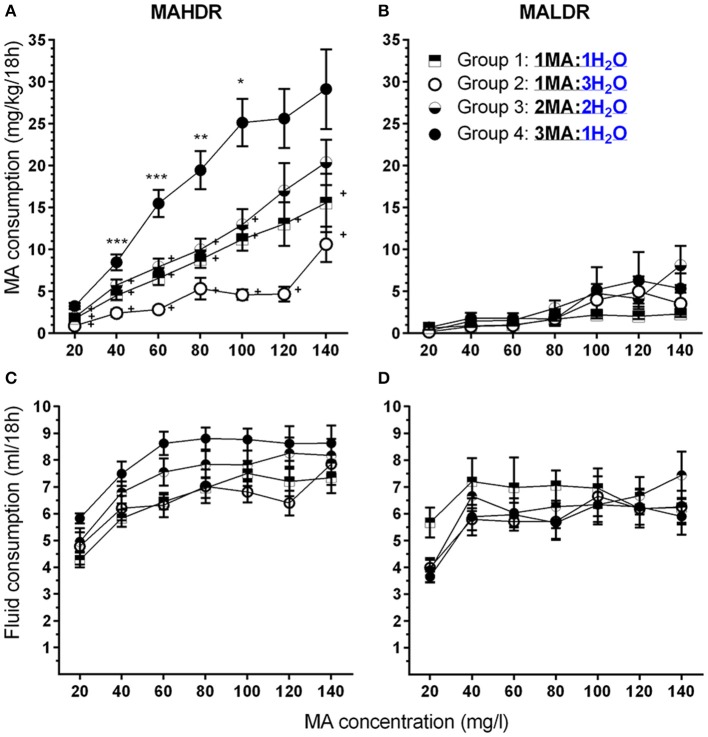
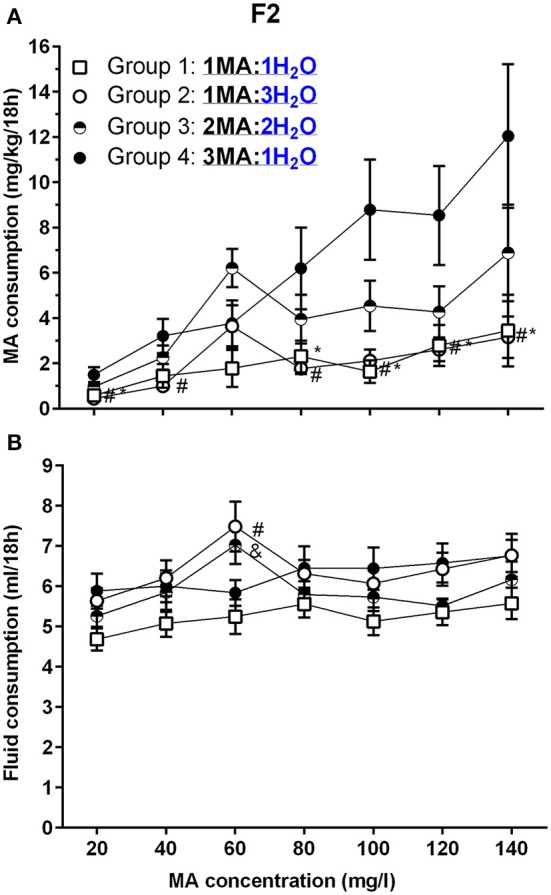
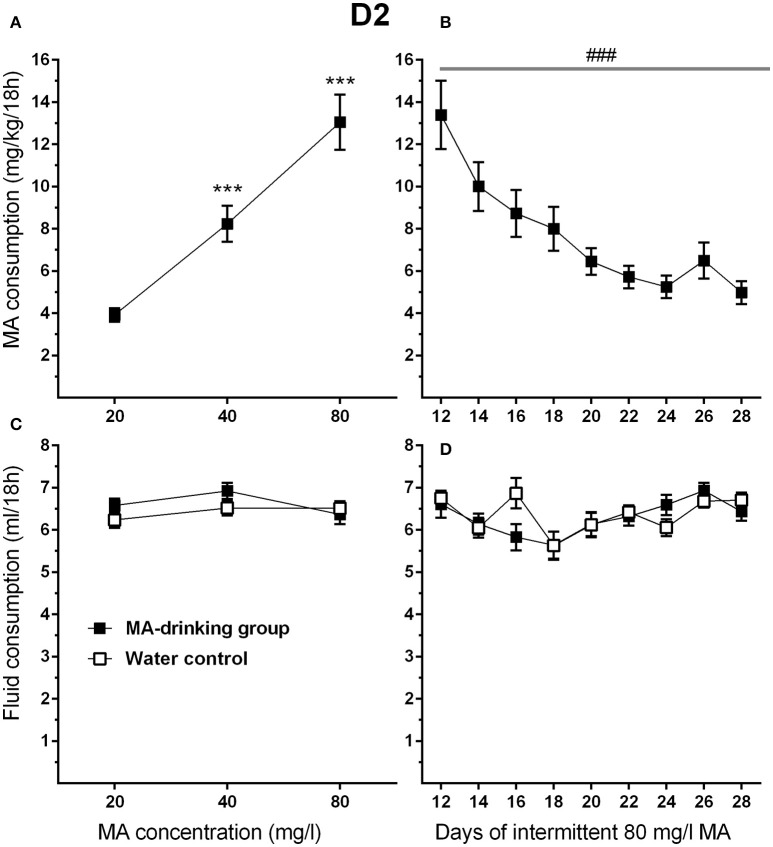
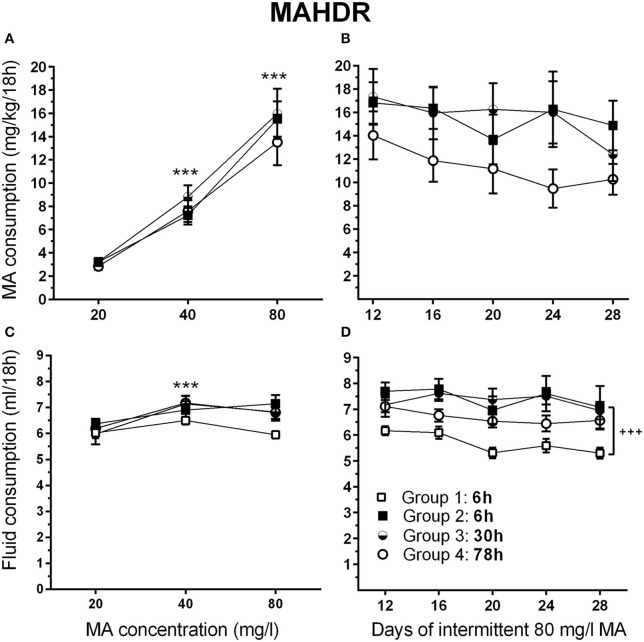
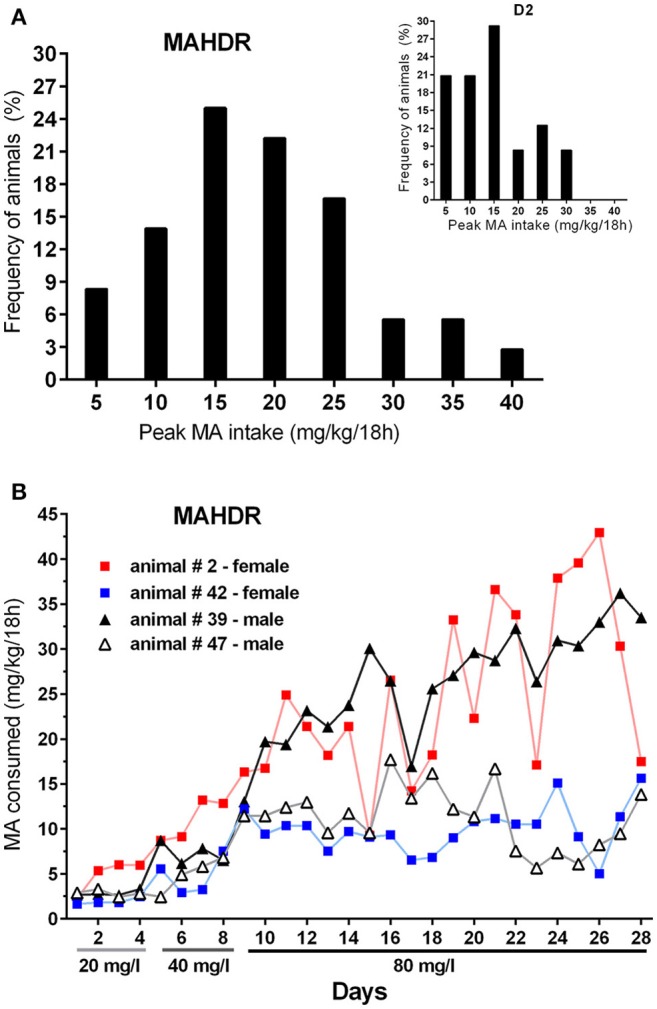
Binge/crash cycles of methamphetamine (MA) use are frequently reported by individuals suffering from MA use disorders. A MA binge is self-reported as multiple daily doses that commonly accumulate to 800 mg/day (~10 mg/kg/day for a 170 pound human). A genetic animal model with a similar vulnerability to binge-level MA intake is missing. We used selectively bred MA high drinking (MAHDR) and low drinking (MALDR) mouse lines to determine whether several procedural variations would result in binge-level MA intake. Data were also collected in two progenitor populations of the MA drinking lines, the DBA/2J (D2) strain and the F2 cross of the D2 and C57BL/6J strains. The impact of 3 factors was examined: (1) concentration of MA in the two-bottle choice procedure used for selective breeding; (2) ratio of bottles containing MA vs. water, and (3) length of the withdrawal (or abstinence) period between MA drinking sessions. When MA concentration was progressively increased every 4 days in 20 mg/l amounts from 20 to 140 mg/l, maximum intake in MALDR mice was 1.1 mg/kg, whereas MAHDR mice consumed as much as 14.6 mg/kg. When these concentrations were tested in a multiple bottle choice procedure, the highest ratio of MA to water bottles (3:1) was associated with escalated MA intake of up to 29.1 mg/kg in MAHDR mice and 12.0 mg/kg in F2 mice; MALDR mice did not show a ratio-dependent escalation in MA intake. Finally, MAHDR and D2 mice were offered 3 bottles of MA vs. water at increasing concentrations from 20 to 80 mg/l, and tested under an intermittent 6-h withdrawal period, which was lengthened to 30 h (D2 mice) or to 30 or 78 h (MAHDR). D2 and MAHDR mice initially consumed similar amounts of 14-16 mg/kg MA, but D2 mice reduced their MA intake 3-fold after introduction of 30-h abstinence periods, whereas MAHDR mice retained their high level of intake regardless of withdrawal period. MAHDR mice provide a genetic model of binge-level MA intake appropriate for the study of associated MA-induced neurobiological changes and pharmaceutical treatments.
Keywords: MAHDR; MALDR; abstinence; genetic; selected line; self-administration; voluntary consumption; withdrawal.
Figures
Similar articles
-
Methamphetamine drinking microstructure in mice bred to drink high or low amounts of methamphetamine.Behav Brain Res. 2014 Oct 1;272:111-20. doi: 10.1016/j.bbr.2014.06.035. Epub 2014 Jun 27. Behav Brain Res. 2014. PMID: 24978098 Free PMC article.
-
Absence of TAAR1 function increases methamphetamine-induced excitability of dorsal raphe serotonin neurons and drives binge-level methamphetamine intake.Neuropsychopharmacology. 2025 Jun;50(7):1136-1144. doi: 10.1038/s41386-025-02063-w. Epub 2025 Feb 11. Neuropsychopharmacology. 2025. PMID: 39934409 Free PMC article.
-
Depression-like symptoms of withdrawal in a genetic mouse model of binge methamphetamine intake.Genes Brain Behav. 2019 Mar;18(3):e12533. doi: 10.1111/gbb.12533. Epub 2018 Nov 26. Genes Brain Behav. 2019. PMID: 30375183 Free PMC article.
-
An animal model of differential genetic risk for methamphetamine intake.Front Neurosci. 2015 Sep 23;9:327. doi: 10.3389/fnins.2015.00327. eCollection 2015. Front Neurosci. 2015. PMID: 26441502 Free PMC article. Review.
-
Scheduled access alcohol drinking by alcohol-preferring (P) and high-alcohol-drinking (HAD) rats: modeling adolescent and adult binge-like drinking.Alcohol. 2014 May;48(3):225-34. doi: 10.1016/j.alcohol.2013.10.004. Epub 2013 Oct 31. Alcohol. 2014. PMID: 24290311 Free PMC article. Review.
Cited by
-
Trace amine-associated receptor gene polymorphism increases drug craving in individuals with methamphetamine dependence.PLoS One. 2019 Oct 10;14(10):e0220270. doi: 10.1371/journal.pone.0220270. eCollection 2019. PLoS One. 2019. PMID: 31600226 Free PMC article. Clinical Trial.
-
Verification of a genetic locus for methamphetamine intake and the impact of morphine.Mamm Genome. 2018 Apr;29(3-4):260-272. doi: 10.1007/s00335-017-9724-5. Epub 2017 Nov 10. Mamm Genome. 2018. PMID: 29127441 Free PMC article.
-
A Zebrafish Model of Neurotoxicity by Binge-Like Methamphetamine Exposure.Front Pharmacol. 2021 Nov 22;12:770319. doi: 10.3389/fphar.2021.770319. eCollection 2021. Front Pharmacol. 2021. PMID: 34880760 Free PMC article.
-
Trace amine-associated receptor 1 regulation of methamphetamine-induced neurotoxicity.Neurotoxicology. 2017 Dec;63:57-69. doi: 10.1016/j.neuro.2017.09.006. Epub 2017 Sep 15. Neurotoxicology. 2017. PMID: 28919515 Free PMC article.
-
Prenatal methamphetamine exposure causes dysfunction in glucose metabolism and low birthweight.Front Endocrinol (Lausanne). 2022 Oct 24;13:1023984. doi: 10.3389/fendo.2022.1023984. eCollection 2022. Front Endocrinol (Lausanne). 2022. PMID: 36353228 Free PMC article.
References
-
- Carroll M. E., Stotz D. C. (1983). Oral d-amphetamine and ketamine self-administration by rhesus monkeys: effects of food deprivation. J. Pharmacol. Exp. Ther. 227, 28–34. - PubMed
Grants and funding
LinkOut - more resources
Full Text Sources
Other Literature Sources
Molecular Biology Databases
Miscellaneous