

Spatial spread of the West Africa Ebola epidemic
- PMID: 27853607
- PMCID: PMC5108957
- DOI: 10.1098/rsos.160294
Spatial spread of the West Africa Ebola epidemic
Abstract
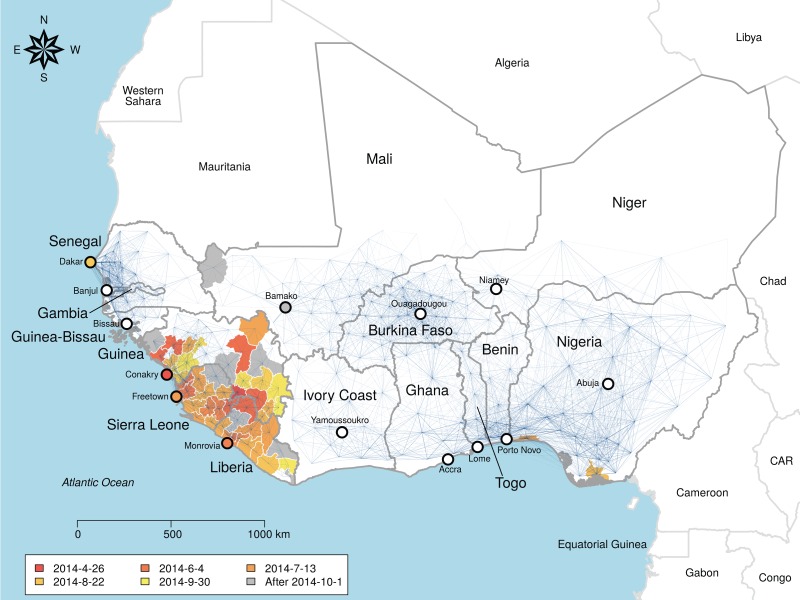
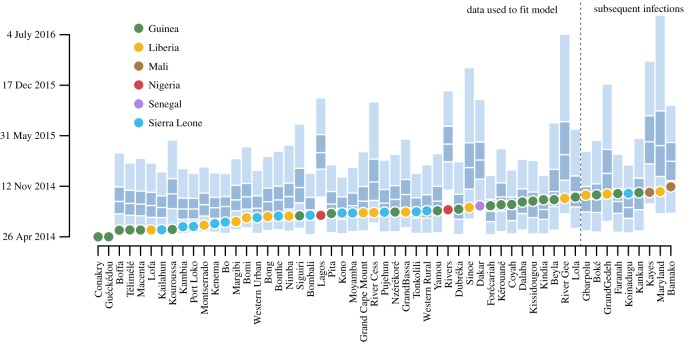
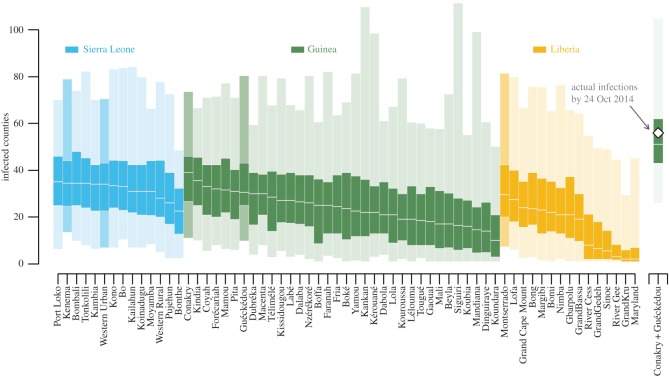
Controlling Ebola outbreaks and planning an effective response to future emerging diseases are enhanced by understanding the role of geography in transmission. Here we show how epidemic expansion may be predicted by evaluating the relative probability of alternative epidemic paths. We compared multiple candidate models to characterize the spatial network over which the 2013-2015 West Africa epidemic of Ebola virus spread and estimate the effects of geographical covariates on transmission during peak spread. The best model was a generalized gravity model where the probability of transmission between locations depended on distance, population density and international border closures between Guinea, Liberia and Sierra Leone and neighbouring countries. This model out-performed alternative models based on diffusive spread, the force of infection, mobility estimated from cell phone records and other hypothesized patterns of spread. These findings highlight the importance of integrated geography to epidemic expansion and may contribute to identifying both the most vulnerable unaffected areas and locations of maximum intervention value.
Keywords: Ebola; disease ecology; epidemiology; gravity model; network model.
Figures
References
-
- World Health Organization. 2015. Ebola data and statistics. Geneva, Switzerland: WHO.
-
- WHO Ebola Response Team. 2014. Ebola virus disease in West Africa—the first 9 months of the epidemic and forward projections. New Engl. J. Med. 371, 1481–1495. (doi:10.1056/NEJMoa1411100) - DOI - PMC - PubMed
-
- Meltzer MI, Atkins CY, Santibanez S, Knust B, Petersen BW, Ervin ED, Nichol ST, Damon IK, Washington ML. 2014. Estimating the future number of cases in the Ebola epidemic—Liberia and Sierra Leone, 2014–2015. Morb. Mortal. Wkly. Rep. 63, 1–14. - PubMed
-
- Keeling MJ. 1997. Disease extinction and community size: modeling the persistence of measles. Science 275, 65–67. (doi:10.1126/science.275.5296.65) - DOI - PubMed
-
- Gire SK, et al. 2014. Genomic surveillance elucidates Ebola virus origin and transmission during the 2014 outbreak. Science 345, 1369–1372. (doi:10.1126/science.1259657) - DOI - PMC - PubMed
Grants and funding
LinkOut - more resources
Full Text Sources
Other Literature Sources