. 2016 Aug 18;5(10):e1218106.
doi: 10.1080/2162402X.2016.1218106. eCollection 2016.

The ratio of CD8+/FOXP3 T lymphocytes infiltrating breast tissues predicts the relapse of ductal carcinoma in situ

Affiliations

The ratio of CD8+/FOXP3 T lymphocytes infiltrating breast tissues predicts the relapse of ductal carcinoma in situ

Michaela Semeraro et al. Oncoimmunology. .

Abstract

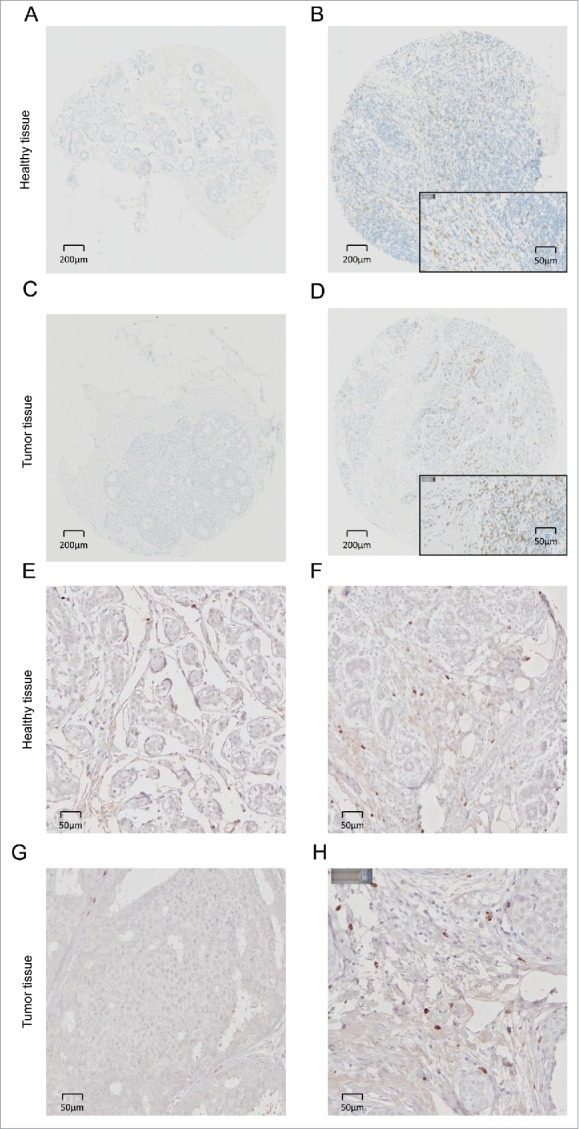
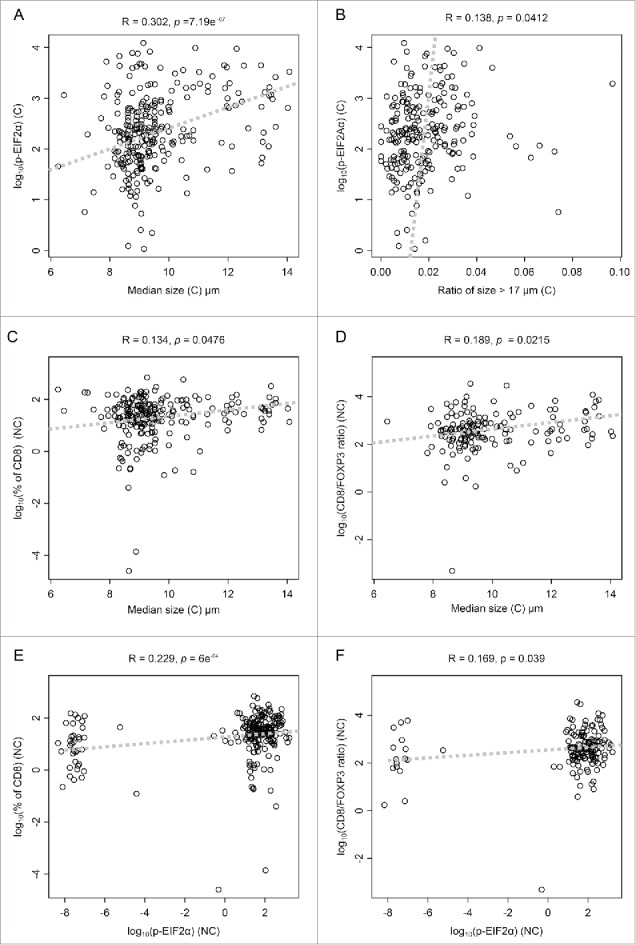
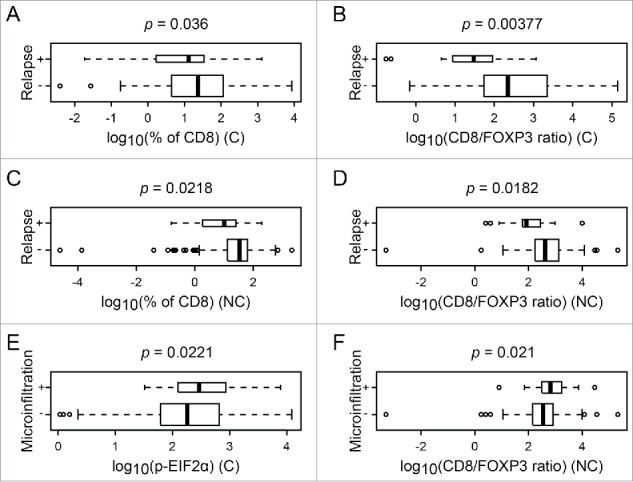
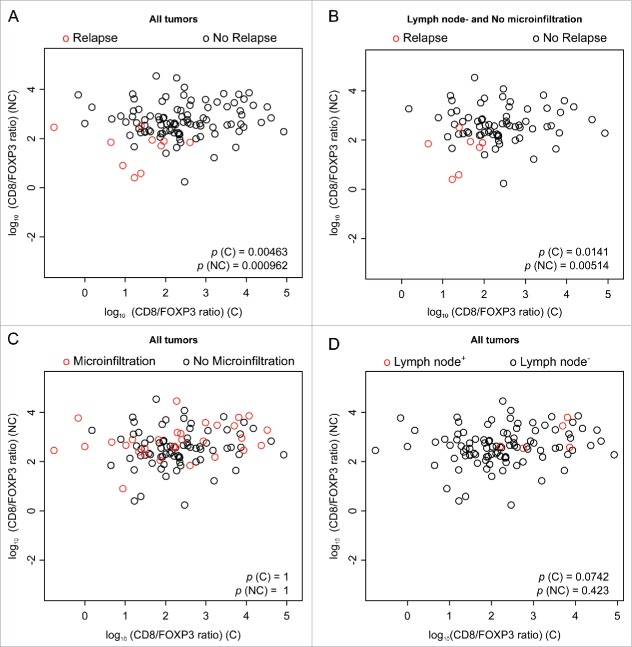
In a series of 248 tumor samples obtained from image-guided biopsies from patients diagnosed with ductal carcinoma in situ of the breast, we attempted to identify biomarkers that predict microinfiltration at definitive surgery or relapse during follow-up. For this, we used immunohistochemical methods, followed by automated image analyses, to measure the mean diameter of nuclei (which correlates with ploidy), the phosphorylation of eukaryotic initiation factor 2α (eIF2α, which reflects endoplasmic reticulum stress) as well as the density and ratio of CD8+ cytotoxic T lymphocytes and FOXP3+ regulatory T cells. The median nuclear diameter of malignant cells correlated with eIF2α phosphorylation (in cancerous tissue), which in turn correlated with the density of the CD8+ infiltrate and the CD8+/FOXP3 ratio (both in cancerous and the adjacent non-cancerous parenchyma). Neither microinfiltration nor lymph node involvement was associated with the probability of relapse. Both correlated positively with the CD8+/FOXP3 ratio in the malignant area. In contrast, relapse was associated with a paucity of the CD8+ infiltrate as well as an unfavorable CD8+/FOXP3 ratio, both in malignant and non-malignant parenchyma. The combined analysis of the CD8+/FOXP3 ratio in cancerous and non-cancerous tissues revealed a significant impact of their interaction on the probability of relapse, but not on the presence of microinfiltration or lymph node metastasis. Altogether, these results support the idea of an immunosurveillance system that determines the risk of relapse in ductal carcinoma in situ of the breast.

Keywords: Cytotoxic T cells; hyperploidy; immunogenic cell death; immunosuppressive regulatory T cells; intraductal carcinoma.


Figures

Figure 1.
Figure 1.
Venn representation of clinical data. The three sets represent the three clinical classifications. The p-values represent the results of Fisher's exact tests, searching for a correlation between each pair of clinical classification.
Figure 2.
Figure 2.
Intraductal carcinoma (DCIS) and breast control tissue micro-array (TMA) with analysis of the phosphorylation of eIF2α. (A) Representative core (hematoxylin/eosin stain). (B) Automated image segmentation by Definiens Software: automatic assessment of the epithelial component (orange) and the stromal tissue (yellow). (C, D) Two examples of high-magnification images to visualize, analyze, and quantify by automated Definiens Software each nucleus for each core. Nuclei are classified according to the surface: small (yellow); orange (medium); red (large); gray (not classified). Several parameters (area, roundness, compactness, distance to scene border, length, width, and circularity) were provided for each nucleus in a parallel analysis. (E–H) Representative pictures of phospho-eIF2α staining: (E, G) weak phospho-eIF2α cytoplasm staining in normal breast tissue and cancer tissue, (F, H) intense phospho-eIF2α cytoplasm staining in normal breast tissue and in malignant areas. The average of the immunohistochemical marker intensity of the cytoplasmic staining is expressed as absolute number by semi-automated Definiens Software quantification. Magnification 20×.
Figure 3.
Figure 3.
CD8+ and FOXP3+ infiltrating lymphocytes in intraductal breast cancer (DCIS) and in healthy tissue. Representative pictures of immunohistochemical staining of primary paraffin-embedded breast normal tissue samples and DCIS using CD8+ (negative CD8 staining in (A, C) and positive CD8 staining in (B, D)) or FOXP3-specific (negative FOXP3 staining in (E, G) and positive FOXP3 staining in (F, H)) antibodies (brown). The exact number of CD8+ lymphocytes was evaluated after manual spot recognition by ImageJ software and R software analysis (http://www.r-project.org/) in the epithelial tissue and in the surrounding stromal tissue.
Figure 4.
Figure 4.
Heat map representation of statistical correlations among all measured parameters. Top right triangle is a two-entries table of signed p-values (p-value sign corresponds to relation sign). Bottom left triangle is a color representation of signed p-value, in log10 scale given by small color panel on top (dashed yellow lines represent significant threshold: ± log10(0.05). The relation tests between two numerical parameters (median nuclear size, eIF2α, CD8+ infiltrate, CD8+/FOXP3 ratio) is the Pearson's correlation test. The relation test between a numerical parameter and a two-level parameter (relapse, microinfiltration, menopause, lymph node positivity, ER+, PR+) is the t-test. The relation test between a two-level parameter and another two-level parameter is the Fisher's exact test. The relation test between a numerical parameter and a multi-level (>2) parameter (grade, HER2+) uses a linear model (explaining numerical parameter with the multi-level parameter). The relation test between a two-level parameter and a multi-level (>2) parameter is the t-test. (C) and (NC) represent cancerous and non-cancerous tissue, respectively.
Figure 5.
Figure 5.
Scatter plots of significant correlations. Scatter representation of parameters pairs, whose Pearson's correlation coefficient is significantly different from zero. Correlation coefficient (r-value) and p-value of Pearson's correlation test is given on top of each panel. (C) and (NC) represent cancerous and non-cancerous tissue, respectively. Dashed lines represent the first principal component.
Figure 6.
Figure 6.
Box plot of significant difference of numerical parameters, according to clinical annotation. Box plot of different numerical parameters that are significantly different according to relapse or microinfiltration. The p-value of the associated t-test is given on top of each panel. (C) and (NC) represent cancerous and non-cancerous tissue, respectively.
Figure 7.
Figure 7.
Scatter plots of CD8+/FOXP3 infiltration, with clinical color annotation. Scatter representation of CD8+/FOXP3 ratio, in cancerous (C) and in non-cancerous (NC) tissue. Panels (A), (C), and (D) include all patients listed in Table 1; Panel (B) includes only the sub-cohort with lymph node negative and no microinfiltration. The colors represent the clinical annotation: Panels (A) and (B): relapse; Panel (C): microinfiltration; Panel (D): lymph node+. The p-values are based on two-dimensional linear model, testing the significance of the linear coefficients.

Similar articles

Cited by

References

    1. Denkert C, Loibl S, Noske A, Roller M, Muller BM, Komor M, Budczies J, Darb-Esfahani S, Kronenwett R, Hanusch C et al.. Tumor-associated lymphocytes as an independent predictor of response to neoadjuvant chemotherapy in breast cancer. J Clin Oncol 2010; 28:105-13; PMID:19917869; http://dx.doi.org/10.1200/JCO.2009.23.7370 - DOI - PubMed
    1. Denkert C, von Minckwitz G, Brase JC, Sinn BV, Gade S, Kronenwett R, Pfitzner BM, Salat C, Loi S, Schmitt WD et al.. Tumor-infiltrating lymphocytes and response to neoadjuvant chemotherapy with or without carboplatin in human epidermal growth factor receptor 2-positive and triple-negative primary breast cancers. J Clin Oncol 2015; 33:983-91; PMID:25534375; http://dx.doi.org/10.1200/JCO.2014.58.1967 - DOI - PubMed
    1. Dieci MV, Mathieu MC, Guarneri V, Conte P, Delaloge S, Andre F, Goubar A. Prognostic and predictive value of tumor-infiltrating lymphocytes in two phase III randomized adjuvant breast cancer trials. Ann Oncol 2015; 26:1698-704; PMID:25995301; http://dx.doi.org/10.1093/annonc/mdv239 - DOI - PMC - PubMed
    1. Dieci MV, Criscitiello C, Goubar A, Viale G, Conte P, Guarneri V, Ficarra G, Mathieu MC, Delaloge S, Curigliano G et al.. Prognostic value of tumor-infiltrating lymphocytes on residual disease after primary chemotherapy for triple-negative breast cancer: a retrospective multicenter study. Ann Oncol 2015; 26:1518; PMID:26109735; http://dx.doi.org/10.1093/annonc/mdv239 - DOI - PMC - PubMed
    1. Kroemer G, Senovilla L, Galluzzi L, Andre F, Zitvogel L. Natural and therapy-induced immunosurveillance in breast cancer. Nat Med 2015; 21:1128-38; PMID:26444637; http://dx.doi.org/10.1038/nm.3944 - DOI - PubMed

Publication types

LinkOut - more resources