

High-throughput T cell receptor sequencing reveals distinct repertoires between tumor and adjacent non-tumor tissues in HBV-associated HCC
- PMID: 27853640
- PMCID: PMC5087304
- DOI: 10.1080/2162402X.2016.1219010
High-throughput T cell receptor sequencing reveals distinct repertoires between tumor and adjacent non-tumor tissues in HBV-associated HCC
Abstract
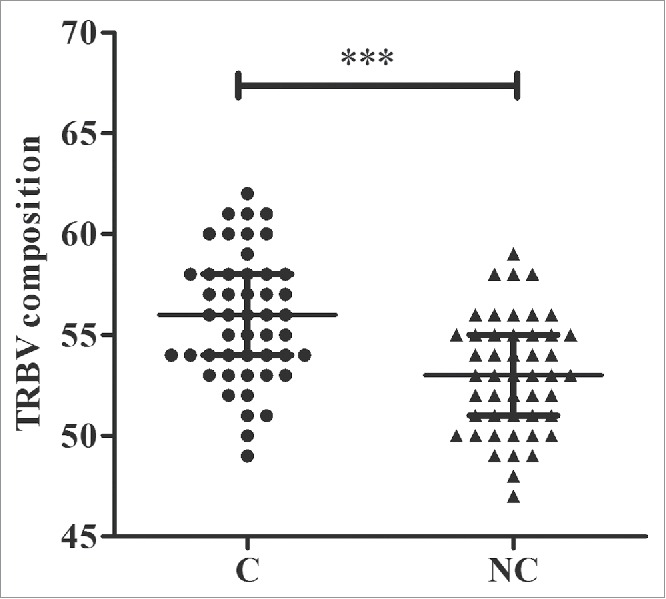
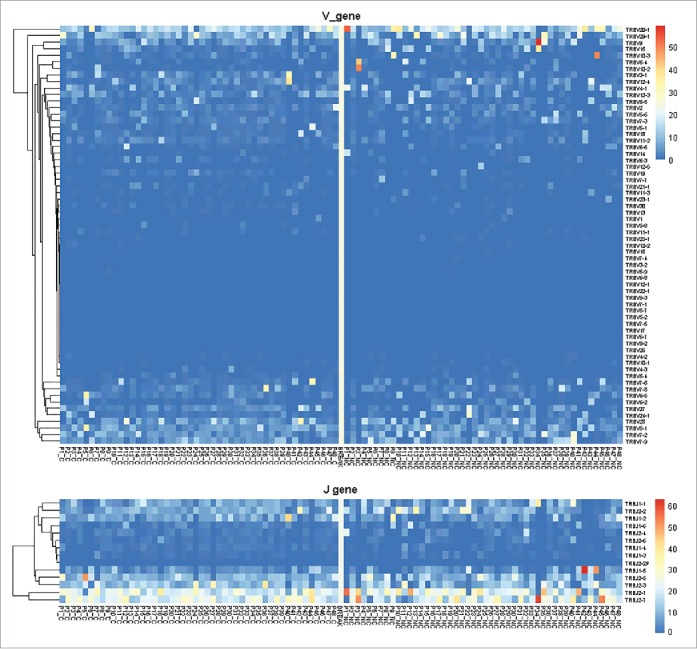
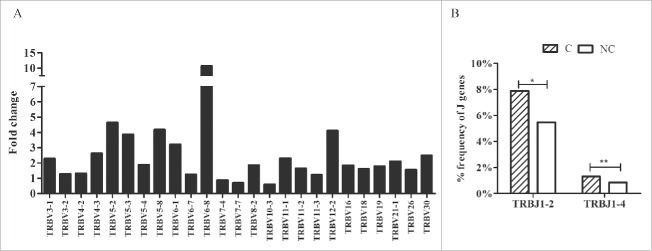
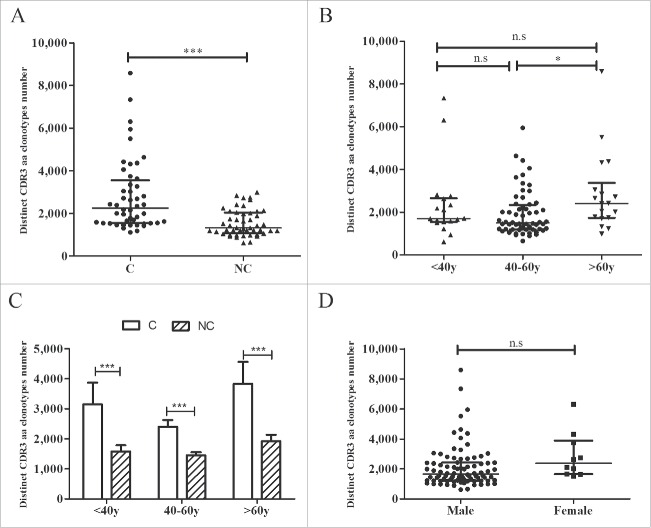
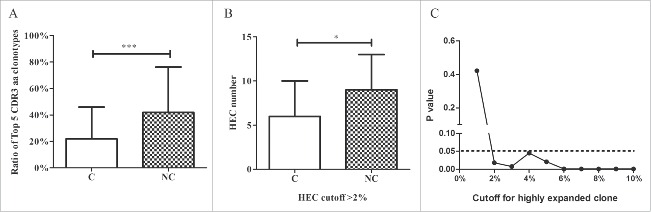
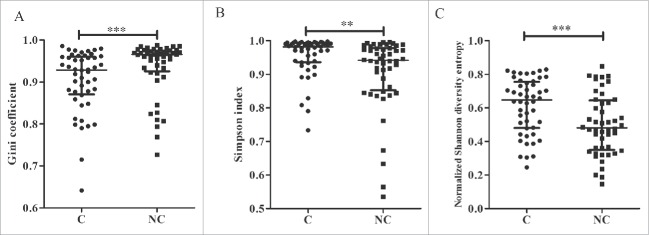
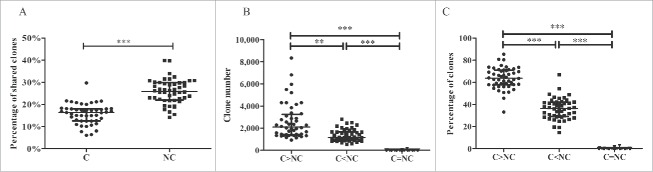
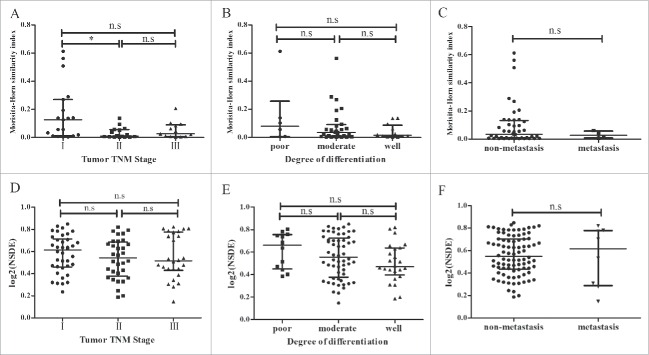
T lymphocytes, which recognize antigen peptides through specific T cell receptors (TCRs), play an important role in the human adaptive immune response. TCR diversity is closely associated with host immune response and cancer prognosis. Although tumor-infiltrating T lymphocytes have implications for tumor prognosis, few studies have performed a detailed characterization of TCR diversity in both tumor and non-tumor tissues in hepatitis B virus (HBV)-associated hepatocellular carcinoma (HCC). Here, we performed high-throughput sequencing of the TCRβ chain complementarity determining region 3 (CDR3) of liver-infiltrating T cells from 48 HBV-associated HCC patients. A significantly higher average number of CDR3 aa clonotypes (2259 vs. 1324, p < 0.001), and significantly higher TCR diversity (Gini coefficient, p < 0.001; Simpson index, p < 0.01; Shannon entropy, p < 0.001) were observed in tumor tissues compared with adjacent non-tumor tissues. The ratio of highly expanded clones (HECs) was significantly higher in non-tumor tissues than in tumor tissues when the HEC threshold was defined as 2% or greater (p < 0.05). Our analysis of the median Morisita-Horn index indicated weak TCR repertoire similarity between tumor and matched non-tumor tissues. The median number of shared clones in tumor tissue and matched non-tumor tissue from each patient was 360.5, representing 5.1-15.8% (10.6 ± 0.4%) of all clones in each patient. We observed extensive heterogeneity of T lymphocytes in tumors and higher HEC ratios in adjacent non-tumor tissues of HCC patients. The differential T cell repertoires in tumor and non-tumor tissues suggest a distinct T cell immune microenvironment in patients with HBV-associated HCC.
Keywords: Diversity; T cell receptor; hepatitis B virus; hepatocellular carcinoma; high-throughput sequencing.
Figures
References
-
- Stewart BW, Wild CP. World Cancer Report 2014. World Health Organization, 2014. pp.Chapter 1.1. ISBN 978-92-832-0432-9; http://publications.iarc.fr/Non-Series-Publications/World-Cancer-Reports...
-
- El Serag HB, Rudolph KL. Hepatocellular carcinoma: Epidemiology and molecular carcinogenesis. Gastroenterology 2007; 132:2557-76; PMID:17570226; http://dx.doi.org/ 10.1053/j.gastro.2007.04.061 - DOI - PubMed
-
- Sarin SK, Kumar M, Lau GK, Abbas Z, Chan HLY, Chen CJ, Chen DS, Chen HL, Chen PJ, Chien RN, et al.. Asian-Pacific clinical practice guidelines on the management of hepatitis B: a 2015 update. Hepatol Int 2016; 10:1-98; PMID:26563120; http://dx.doi.org/ 10.1007/s12072-015-9675-4 - DOI - PMC - PubMed
-
- Arzumanyan A, Reis HMGP, Feitelson MA. Pathogenic mechanisms in HBV- and HCV-associated hepatocellular carcinoma. Nat Rev Cancer 2013; 13:123-35; PMID:23344543; http://dx.doi.org/ 10.1038/nrc3449 - DOI - PubMed
-
- Bolondi L, Gramantieri L. From liver cirrhosis to HCC. Intern Emerg Med 2011; 6:93-8; PMID:22009618; http://dx.doi.org/ 10.1007/s11739-011-0682-8 - DOI - PubMed
Publication types
LinkOut - more resources
Full Text Sources
Other Literature Sources