Quantitative MRI radiomics in the prediction of molecular classifications of breast cancer subtypes in the TCGA/TCIA data set
- PMID: 27853751
- PMCID: PMC5108580
- DOI: 10.1038/npjbcancer.2016.12
Quantitative MRI radiomics in the prediction of molecular classifications of breast cancer subtypes in the TCGA/TCIA data set
Abstract
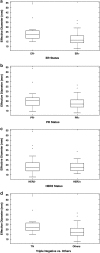
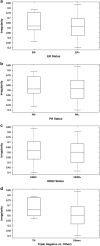
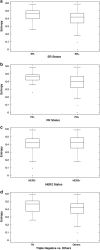
Using quantitative radiomics, we demonstrate that computer-extracted magnetic resonance (MR) image-based tumor phenotypes can be predictive of the molecular classification of invasive breast cancers. Radiomics analysis was performed on 91 MRIs of biopsy-proven invasive breast cancers from National Cancer Institute's multi-institutional TCGA/TCIA. Immunohistochemistry molecular classification was performed including estrogen receptor, progesterone receptor, human epidermal growth factor receptor 2, and for 84 cases, the molecular subtype (normal-like, luminal A, luminal B, HER2-enriched, and basal-like). Computerized quantitative image analysis included: three-dimensional lesion segmentation, phenotype extraction, and leave-one-case-out cross validation involving stepwise feature selection and linear discriminant analysis. The performance of the classifier model for molecular subtyping was evaluated using receiver operating characteristic analysis. The computer-extracted tumor phenotypes were able to distinguish between molecular prognostic indicators; area under the ROC curve values of 0.89, 0.69, 0.65, and 0.67 in the tasks of distinguishing between ER+ versus ER-, PR+ versus PR-, HER2+ versus HER2-, and triple-negative versus others, respectively. Statistically significant associations between tumor phenotypes and receptor status were observed. More aggressive cancers are likely to be larger in size with more heterogeneity in their contrast enhancement. Even after controlling for tumor size, a statistically significant trend was observed within each size group (P = 0.04 for lesions ≤ 2 cm; P = 0.02 for lesions >2 to ≤5 cm) as with the entire data set (P-value = 0.006) for the relationship between enhancement texture (entropy) and molecular subtypes (normal-like, luminal A, luminal B, HER2-enriched, basal-like). In conclusion, computer-extracted image phenotypes show promise for high-throughput discrimination of breast cancer subtypes and may yield a quantitative predictive signature for advancing precision medicine.
Conflict of interest statement
M.L.G. is a stockholder in R2 technology/Hologic and receives royalties from Hologic, GE Medical Systems, MEDIAN Technologies, Riverain Medical, Mitsubishi and Toshiba. She is a cofounder of and stockholder in Quantitative Insights. K.D., and H.L. receives royalties from Hologic. C.M.P. is an equity stock holder, and Board of Director Member, of Bioclassifier, LLC. C.M.P. is also listed as an inventor on a patent application on the PAM50 assay. M.L.G., and H.L. were responsible for the computer analysis of the TCIA images; E.S.B., M.Z., J.M.N., E.S., G.J.W., E.M., E.B., K.B., B.D., M.G., and H.L.P. were responsible for acquiring the lesion locations in the TCIA MRIs; C.M.P., K.A.H., and C.F. were responsible for the assessment of the molecular subtyping of the breast cancer lesions from the TCGA; M.L.G., H.L., Y.Z., K.D., E.S.B., S.D.C., E.M., and Y.J. were involved in the analytic concept and design; M.L.G., H.L., K.D., and E.H. contributed to the statistical analyses; all authors participated in the manuscript preparation, the interpretation of data analysis results, and critical review/revision of the manuscript for important intellectual content. All authors read and approved the final manuscript. All authors agreed to be accountable for all aspects of the work.
Figures


References
-
- Siegel, R., Ma, J., Zou, Z. & Jemal, A. Cancer statistics, 2014. CA Cancer J. Clin. 64, 9–29 (2014). - PubMed
-
- Carey, L. A. et al. Race, breast cancer subtypes, and survival in the Carolina Breast cancer study. JAMA 295, 2492–2502 (2006). - PubMed
-
- Voduc, K. D. et al. Breast cancer subtypes and the risk of local and regional relapse. J. Clin. Oncol. 28, 1684–1691 (2010). - PubMed
Grants and funding
LinkOut - more resources
Full Text Sources
Other Literature Sources
Medical
Research Materials
Miscellaneous

