. 2016 Nov 17;17(1):231.
doi: 10.1186/s13059-016-1092-z.

Tumor immune microenvironment characterization in clear cell renal cell carcinoma identifies prognostic and immunotherapeutically relevant messenger RNA signatures

Affiliations

Tumor immune microenvironment characterization in clear cell renal cell carcinoma identifies prognostic and immunotherapeutically relevant messenger RNA signatures

Yasin Şenbabaoğlu et al. Genome Biol. .

Erratum in

Abstract

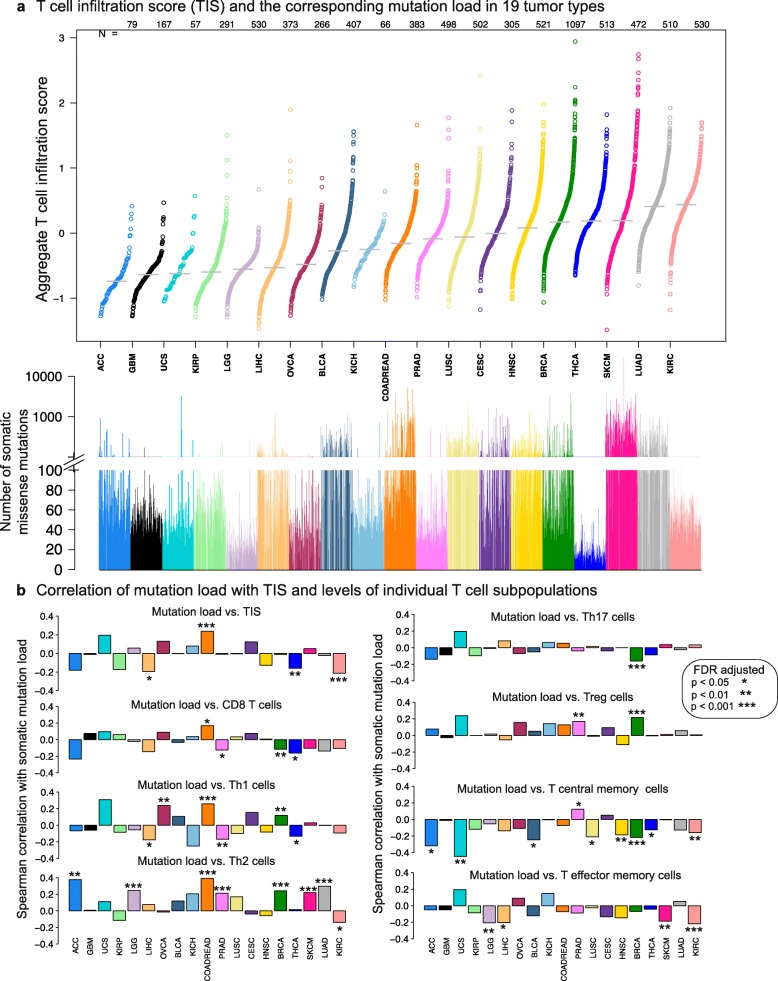
Background: Tumor-infiltrating immune cells have been linked to prognosis and response to immunotherapy; however, the levels of distinct immune cell subsets and the signals that draw them into a tumor, such as the expression of antigen presenting machinery genes, remain poorly characterized. Here, we employ a gene expression-based computational method to profile the infiltration levels of 24 immune cell populations in 19 cancer types.

Results: We compare cancer types using an immune infiltration score and a T cell infiltration score and find that clear cell renal cell carcinoma (ccRCC) is among the highest for both scores. Using immune infiltration profiles as well as transcriptomic and proteomic datasets, we characterize three groups of ccRCC tumors: T cell enriched, heterogeneously infiltrated, and non-infiltrated. We observe that the immunogenicity of ccRCC tumors cannot be explained by mutation load or neo-antigen load, but is highly correlated with MHC class I antigen presenting machinery expression (APM). We explore the prognostic value of distinct T cell subsets and show in two cohorts that Th17 cells and CD8+ T/Treg ratio are associated with improved survival, whereas Th2 cells and Tregs are associated with negative outcomes. Investigation of the association of immune infiltration patterns with the subclonal architecture of tumors shows that both APM and T cell levels are negatively associated with subclone number.

Conclusions: Our analysis sheds light on the immune infiltration patterns of 19 human cancers and unravels mRNA signatures with prognostic utility and immunotherapeutic biomarker potential in ccRCC.

Keywords: Cancer immunotherapy; Checkpoint blockade; Clear cell renal cell carcinoma (ccRCC); Computational deconvolution; Tumor immune microenvironment.


Figures

Fig. 1
Fig. 1
In vitro validation of the immune cell scoring method. a Immune cell populations were sorted from ccRCC patient specimens, and profiled for RNA-Seq gene expression. ssGSEA scores were computed for each sample using Bindea et al. signatures. Each ssGSEA score was the highest for the corresponding tumor-associated immune cell population and also had a significant difference from the other sorted populations (p values are provided above each figure). b Principal component analysis (PCA) of sorted tumor-associated immune cell populations. PCs were computed as a linear combination of 29 immune microenvironment variables (Additional file 2: Table S3). c Immunofluorescence (IF) validation of ssGSEA scores in an MSKCC cohort. The top left panel shows the unsupervised clustering of ssGSEA scores for NK, CD8+ T, and Treg cells in the 10 patients. IF staining for two samples at the opposite ends of the heatmap is shown in the bottom left panel (CD56, CD8, and FOXP3 antibodies respectively). The association of the immune infiltrate levels inferred by these two orthogonal methods (ssGSEA and IF) is shown in the right panel. The IF score (y-axis) represents the ratio of CD56, CD8, and FOXP3 positive cells versus total cells (DAPI-stained) for a given sample and was determined as the average across three representative regions on the slide
Fig. 2
Fig. 2
In silico validation of the immune cell scoring method. a In silico validation of immune cell scores using simulated mixing proportions. RNA-Seq profiles of FACS-sorted NK cells, macrophages, CD4+ and CD8+ T cells, and non-immune CD45 cells were mixed with known proportions to obtain a “clean” mixture. Noise was added at varying SNRs. Mixing levels were then inferred by ssGSEA from the “clean” and noisy mixtures. The Spearman correlations between the simulated and inferred levels (top panel) and the bootstrap p values for these correlation values (bottom panel) are shown on the y-axes (Additional file 1: Figure S18 and “Methods” for the calculation of the bootstrap p values). b Validation of IIS with methylation-based leukocyte fractions. Spearman correlations between the two orthogonal scores are shown on the x-axis for 13 tumor types. c Validation of TIS with TCR beta chain abundance. Both scores are computationally inferred from RNA-Seq data but employ different approaches to measure T cell levels. Spearman correlations are shown on the x-axis for 19 tumor types
Fig. 3
Fig. 3
Analysis of T cell infiltration in 19 tumor types. a T cell infiltration scores (TIS) and the corresponding mutation load in 19 tumor types. TIS is an aggregate score obtained as the average of nine distinct T cell subset scores (CD8+ T, Th1, Th2, Th17, Treg, T effector memory, T central memory, T helper, and T cells). Each circle in the top panel shows the TIS for a tumor sample. In the bottom panel, the vertical bar corresponding to each circle shows the number of somatic missense mutations. Tumor types are ordered from left to right according to increasing median TIS (medians indicated by horizontal gray bars). b Correlation of mutation load with TIS and levels of individual T cell subpopulations. Spearman correlation coefficients are computed between number of somatic missense mutations and ssGSEA-based immune cell infiltration levels. Coefficients are plotted on the y-axis in bar plots and asterisks are added to indicate level of significance, as denoted in the legend. Tumor types are ordered in the same order as in Fig. 3a
Fig. 4
Fig. 4
Pan-cancer analysis of TIS association with antigen presenting machinery (APM) gene expression. a The association between the median APM score and the median T cell infiltration score across 19 tumor types. The sizes of the circles are proportional to the within-cohort Spearman correlation between TIS score and APM score. KIRC and LUAD are among the highest not only for APM score but also for the APM–TIS correlation. b The APM score differences between tumors and adjacent normal tissue in kidney and lung neoplasms. Each circle is the APM score of a tumor (red) or an adjacent normal (blue) sample. No significant tumor-normal differences are observed in lung adenocarcinoma (LUAD), lung squamous cell carcinoma (LUSC), or kidney chromophobe (KICH) at α = 0.05. However, clear cell and papillary renal cell carcinoma (KIRC and KIRP) tumors significantly overexpress APM genes. The Benjamini–Hochberg adjusted p values are reported in the figure (Mann–Whitney test)
Fig. 5
Fig. 5
Characterization of immune infiltration clusters in ccRCC. a Unsupervised clustering of 415 ccRCC patients from the TCGA cohort using ssGSEA scores from 24 immune cell types, three immunotherapy targets (PD-1, PD-L1, CTLA-4), and angiogenesis. Hierarchical clustering was performed with Euclidean distance and Ward linkage. We discover three distinct immune infiltration clusters, here termed (1) non-infiltrated, (2) heterogeneously infiltrated, and (3) T cell enriched. The T cell enriched cluster is characterized by tumors with high APM scores and high granzyme B and interferon gamma mRNA expression levels. b Differential expression analysis with Mann–Whitney test for all genes in the TCGA RNA-Seq dataset excluding signature genes. Only genes that are significantly overexpressed in one cluster at a q-value cutoff of 5 × 10–5 are shown. Pathway analysis using DAVID [44] reveals that the genes overexpressed in the three clusters (n = 1110, 181, and 277, respectively) are enriched in (1) adaptive and innate immune response, (2) angiogenesis, and (3) mitochondrial and metabolic processes. c Differential expression analysis with Mann–Whitney test for all proteins in the TCGA reverse phase protein array (RPPA) dataset. Only proteins that are significantly overexpressed in one cluster at a q-value cutoff of 0.01 are shown. This analysis recapitulates the significant differences in immune response in the T cell enriched cluster and in angiogenesis in the heterogeneously infiltrated cluster. d PCA of the immune infiltration scores in ccRCC. The three clusters most likely reflect distinct biology
Fig. 6
Fig. 6
Prognostic significance of ccRCC immune infiltration classes and distinct T cell subsets. a Kaplan–Meier curves for cancer-specific survival in ccRCC immune infiltration classes. The T cell enriched class has the poorest survival whereas the non-infiltrated class is associated with better outcomes (log-rank test p value = 0.05). b Prognostic significance of angiogenesis and distinct T cell subsets in ccRCC. Univariate Cox proportional-hazards was used to regress ssGSEA scores on cancer-specific survival. The resultant p values in the TCGA dataset were adjusted for multiple hypothesis testing, log-transformed, and then plotted against the log-transformed p values from the SATO dataset. Survival associations concordant in both datasets are denoted in green and red for improved and poor outcome respectively. Discordant associations are denoted in gray. P values from the SATO dataset are not adjusted for multiple hypothesis testing since this is the validation cohort. c Kaplan–Meier curves for cancer-specific survival in the above-median and below-median groups for the CD8+ T/Treg and Th17/Th2 ratios. The median values for these two ratios are able to stratify both the TCGA and the SATO cohorts into groups with significant survival differences
Fig. 7
Fig. 7
Association of ccRCC immune infiltration patterns with intratumor heterogeneity. a The immune infiltration class for each Gerlinger et al. multiregion tumor sample was predicted with a random forest classifier trained on the TCGA ccRCC cohort. The y-axis shows immune cell types and immunotherapy targets ordered according to Ward linkage in hierarchical clustering. The x-axis shows normal and multiregion tumor samples with a supervised order. Six normal samples are on the far left and tumor samples from each patient are grouped together. Patients are ordered according to increasing average infiltration level from left to right. Tumor samples within each patient are ordered according to alphabetical order. b Comparison of TIS with TCRb read counts and immunohistochemistry-based T cell counts. Left: The scatter plot and Pearson correlation of TCRb read counts with IHC-based T cell counts from [58] when restricted to the six samples that also have microarray expression data. A linear regression line is fitted through the data after exclusion of the outlier RMH002-R6 as in [58]. Middle: The scatter plot and Pearson correlation of IHC-based T cell counts with the ssGSEA-based aggregate TIS. A linear regression line is fitted through the data. Right: The scatter plot and Pearson correlation TCRb read counts with the ssGSEA-based aggregate TIS. A linear regression line is fitted through the data after exclusion of the outlier RMH002-R6. c SciClone clonality analysis for TCGA ccRCC samples. The x-axis shows the number of single nucleotide variant (SNV) clusters for each tumor where 1 corresponds to clonal tumors and higher number of clusters indicate subclonal architecture. P values are derived from trend tests between the number of SNV clusters and ssGSEA scores. The fraction of samples for each SNV cluster number is 4.6% for one cluster (n = 9), 55.7% for two clusters (n = 108), 27.8% for three clusters (n = 54), 7.7% for four clusters (n = 15), 3.6% for five clusters (n = 7), 0.5% for six clusters (n = 1)
Fig. 8
Fig. 8
Immune infiltration profiles in nivolumab-treated ccRCC patients. RNA-Seq profiles of six ccRCC patients were generated and the patients were then treated with the checkpoint inhibitor nivolumab (anti-PD1). T cell infiltration as well as APM, IFNG, and GZMB levels are generally high in responders (complete response, partial response, or stable disease) and the highest levels are observed in the patient with complete response

References

    1. Nishikawa H, Sakaguchi S. Regulatory T cells in cancer immunotherapy. Curr Opin Immunol. 2014;27:1–7. doi: 10.1016/j.coi.2013.12.005. - DOI - PubMed
    1. Noy R, Pollard JW. Tumor-associated macrophages: from mechanisms to therapy. Immunity. 2014;41:49–61. doi: 10.1016/j.immuni.2014.06.010. - DOI - PMC - PubMed
    1. De Palma M, Lewis CE. Macrophage regulation of tumor responses to anticancer therapies. Cancer Cell. 2013;23:277–86. doi: 10.1016/j.ccr.2013.02.013. - DOI - PubMed
    1. Galon J, Costes A, Sanchez-Cabo F, Kirilovsky A, Mlecnik B, Lagorce-Pages C, et al. Type, density, and location of immune cells within human colorectal tumors predict clinical outcome. Science. 2006;313:1960–4. doi: 10.1126/science.1129139. - DOI - PubMed
    1. Galon J, Fridman WH, Pages F. The adaptive immunologic microenvironment in colorectal cancer: a novel perspective. Cancer Res. 2007;67:1883–6. doi: 10.1158/0008-5472.CAN-06-4806. - DOI - PubMed

Publication types

MeSH terms