. 2017 Mar:47:64-75.
doi: 10.1016/j.exphem.2016.11.003. Epub 2016 Nov 14.

MLL-AF4 binds directly to a BCL-2 specific enhancer and modulates H3K27 acetylation

Affiliations

MLL-AF4 binds directly to a BCL-2 specific enhancer and modulates H3K27 acetylation

Laura Godfrey et al. Exp Hematol. 2017 Mar.

Abstract

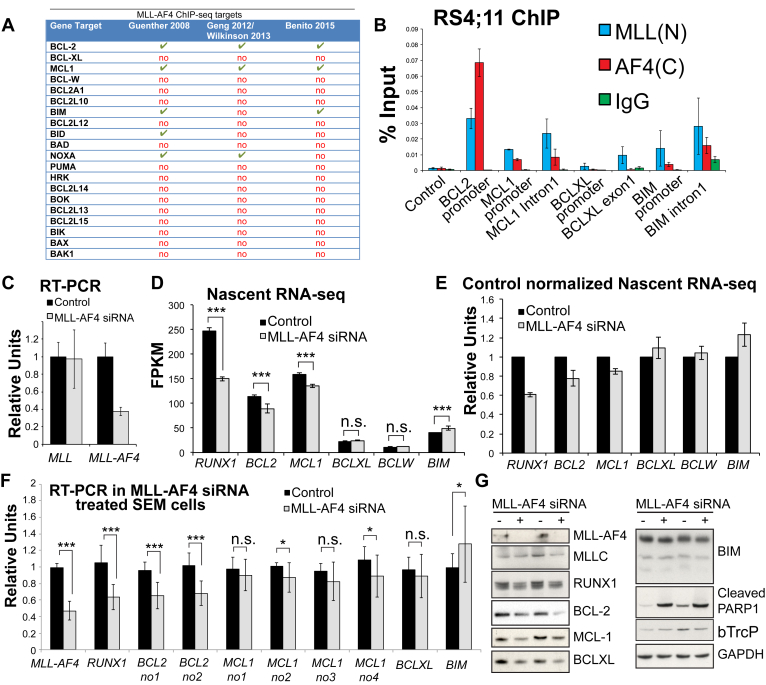
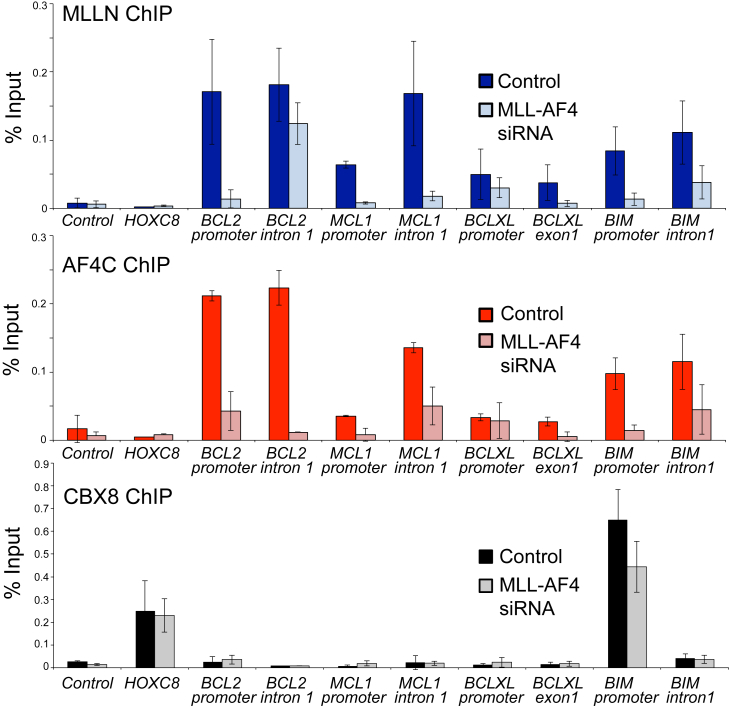
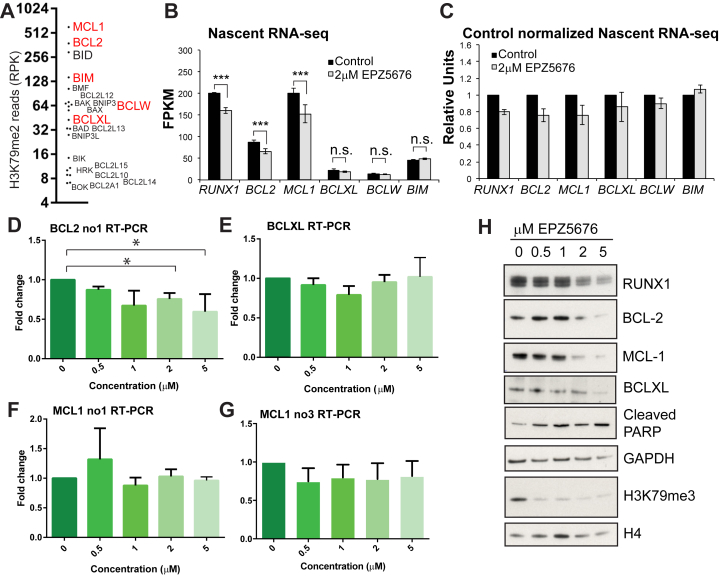
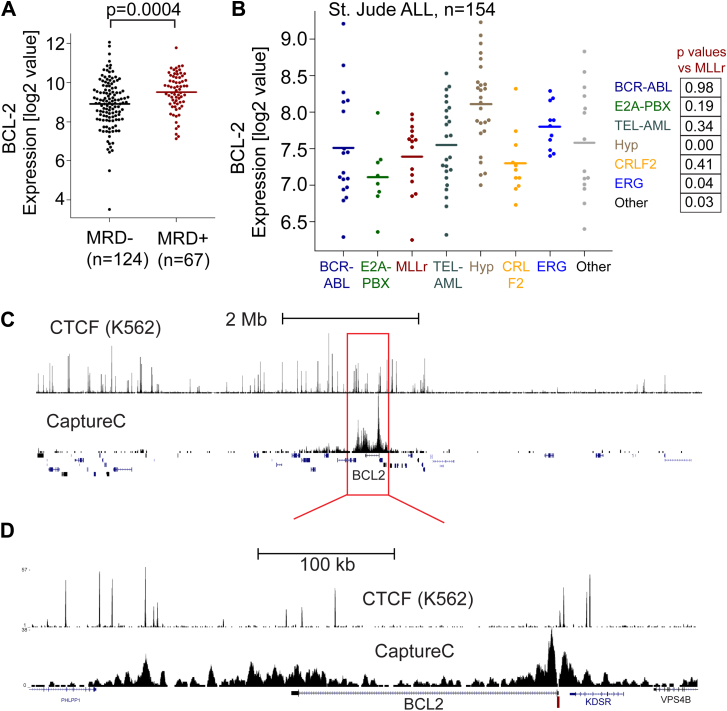
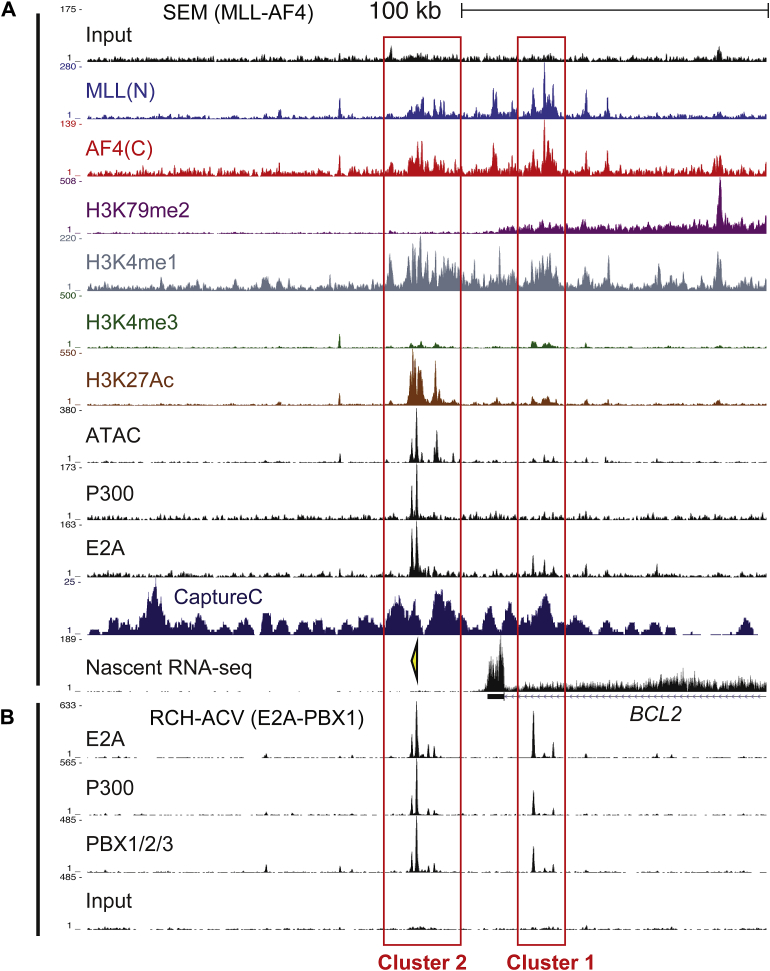
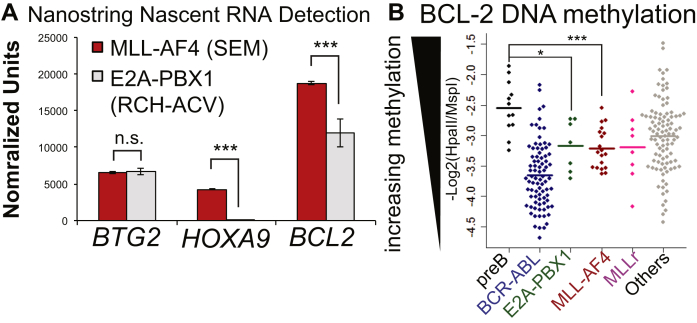
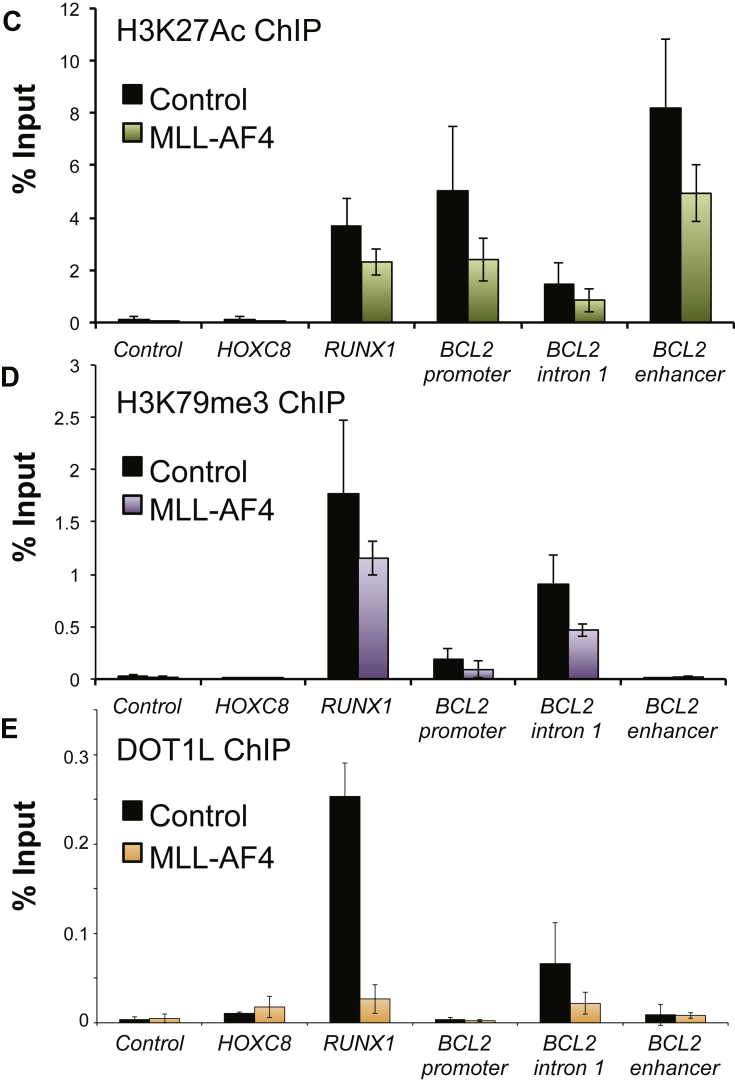
Survival rates for children and adults carrying mutations in the Mixed Lineage Leukemia (MLL) gene continue to have a very poor prognosis. The most common MLL mutation in acute lymphoblastic leukemia is the t(4;11)(q21;q23) chromosome translocation that fuses MLL in-frame with the AF4 gene producing MLL-AF4 and AF4-MLL fusion proteins. Previously, we found that MLL-AF4 binds to the BCL-2 gene and directly activates it through DOT1L recruitment and increased H3K79me2/3 levels. In the study described here, we performed a detailed analysis of MLL-AF4 regulation of the entire BCL-2 family. By measuring nascent RNA production in MLL-AF4 knockdowns, we found that of all the BCL-2 family genes, MLL-AF4 directly controls the active transcription of both BCL-2 and MCL-1 and also represses BIM via binding of the polycomb group repressor 1 (PRC1) complex component CBX8. We further analyzed MLL-AF4 activation of the BCL-2 gene using Capture-C and identified a BCL-2-specific enhancer, consisting of two clusters of H3K27Ac at the 3' end of the gene. Loss of MLL-AF4 activity results in a reduction of H3K79me3 levels in the gene body and H3K27Ac levels at the 3' BCL-2 enhancer, revealing a novel regulatory link between these two histone marks and MLL-AF4-mediated activation of BCL-2.


Figures

Figure 1
Figure 1
MLL-AF4 maintains BCL-2 and MCL-1 transcription and represses BIM. (A) A table summarizing ChIP-seq data on MLL-AF4 binding to different BCL-2 family target genes in three different data sets in SEM cells , or RS4;11 cells , . (B) ChIP in RS4;11 cells using MLL(N), AF4(C), and control (IgG) antibodies confirms MLL-AF4 binding at BCL-2, MCL-1, and BIM1. (C) RT-PCR of MLL-AF4 siRNA-treated samples (three biological replicates) used for the nascent RNA-seq experiments. Error bars are SD. (D) Gene transcription as measured by nascent RNA-seq and presented as FPKM values in control-treated (black bars) and MLL-AF4 siRNA-treated (gray bars) SEM cells. Results are the average of three biological replicates, ***p (FDR) < 0.001. (E) The same data as in (D) normalized to the control samples to illustrate the extent of the gene transcription change. (F) RT-PCR in control-treated (black bars) and MLL-AF4 siRNA (gray bars)-treated SEM cells. Average of 13 biological replicates; error bars are SD. ***p < 0.001, *p < 0.05 using a Mann–Whitney U test. (G) Sample Western blots in two independent experiments in control-treated (−) and MLL-AF4 siRNA-treated (+) SEM cells using the antibodies indicated.
Figure 2
Figure 2
Loss of MLL-AF4 binding causes reduced binding of the PRC1 protein CBX8 to BIM. ChIP in MLL-AF4 siRNA (light color) or control-treated (dark color) SEM cells using MLL(N), AF4(C), and CBX8 antibodies at BCL-2, MCL-1, BCL-XL, and BIM1. Bars represent averages of three biological replicates (the same samples as those used to generate the nascent RNA-seq data in Fig. 1F) and error bars = SD.
Figure 3
Figure 3
Treatment with the DOT1L inhibitor EPZ5676 and loss of H3K79me2/3 causes reduced BCL-2 and MCL-1 transcription, but has no effect on BIM. (A) BCL-2 family genes ranked by levels of H3K79me2 with MCL-1, BCL-2, BID, and BIM displaying the top four highest levels of H3K79me2. Read count represents number of H3K79me2 reads over the entire gene, normalized to the length of the gene (RPK). (B) Gene transcription as measured by nascent RNA-seq and presented as FPKM values in control-treated (black bars) versus 2μM EPZ5676-treated (gray bars) SEM cells. Results are averages of three biological replicates. ***p (FDR) < 0.001. (C) The same data as in (B) normalized to the control samples to illustrate the extent of the gene transcription change. (D–G) RT-PCR of MCL-1, BCL-2, and BCL-XL in SEM cells treated with different dosages of the DOT1L inhibitor EPZ5676. Average of six independent experiments except (G), which was three independent experiments. *p < 0.05 using the Mann–Whitney U test. (H) Sample Western blots of one set of samples from (B) for the proteins/marks indicated. GAPDH and H4 are shown as loading controls.
Figure 4
Figure 4
BCL-2 is highly expressed in many ALL patient samples, and Capture-C identifies an enhancer cluster at the 3′ end of the BCL-2 gene. (A) COG P9906 B-ALL patients (n = 207). Average expression of BCL-2 is higher in MRD+ than MRD–patients. Each point represents an individual patient. (B) A St. Jude ALL data set was assessed for BCL-2 gene expression. Details of the data set are given under Methods. (C) CTCF ChIP-seq (top track, from K562 cells, encode track) compared with Capture-C (bottom track) using a capture probe designed to the BCL-2 promoter (dark red bar). The tracks indicate the region about 4 Mb on either side of BCL-2. (D) Blowup of red box region from (C), revealing that there is a major interaction cluster at the 3′ end of the BCL-2 gene associated with several CTCF ChIP-seq peaks.
Figure 5
Figure 5
There are two main clusters of the BCL-2 enhancer marked by H3K27Ac and bound by P300 in MLL-AF4 and E2A-PBX1 cells. (A) ChIP-seq data as indicated in SEM cells. Red boxes highlight the two enhancer ATAC/H3K27Ac clusters. The yellow arrowhead indicates a PCR primer set used for ChIP Q-PCR BCL-2 enhancer experiments in Figure 6. (B) ChIP-seq in RCH-ACV (E2A-PBX1) cells reveals binding of E2A-PBX1 and P300 at the two enhancer clusters.
Figure 6
Figure 6
MLL-AF4 controls both H3K27Ac and H3K79me3. (A) Nascent RNA purified from SEM (MLL-AF4, red bars) and RCH-ACV (E2A-PBX1, gray bars) and quantified on a NanoString probe array. Average of two replicates. BTG2 is a gene target transcribed at equal levels in both samples and is presented as a sample control. HOXA9 (a canonical MLL-AF4 target gene) and BCL-2 both display reduced transcription in the E2A-PBX1 sample. ***p < 0.001, NanoStriDE sequencing normalized. (B) BCL2 methylation data from the ECOG E2993 ALL trial (n = 215) revealing reduced DNA methylation at BCL-2 in E2A-PBX1 (green) and MLL-AF4 (red) patients. Each point represents one patient or normal sample; the bar is the average value. ***p < 0.001, *p < 0.05. (C–E) ChIP in MLL-AF4 siRNA treated SEM cells (colored) compared with control (black) using antibodies to H3K27Ac, H3K79me3, or DOT1L. Bars represent the averages of three independent experiments; error bars are SD.
Figure 6
Figure 6
MLL-AF4 controls both H3K27Ac and H3K79me3. (A) Nascent RNA purified from SEM (MLL-AF4, red bars) and RCH-ACV (E2A-PBX1, gray bars) and quantified on a NanoString probe array. Average of two replicates. BTG2 is a gene target transcribed at equal levels in both samples and is presented as a sample control. HOXA9 (a canonical MLL-AF4 target gene) and BCL-2 both display reduced transcription in the E2A-PBX1 sample. ***p < 0.001, NanoStriDE sequencing normalized. (B) BCL2 methylation data from the ECOG E2993 ALL trial (n = 215) revealing reduced DNA methylation at BCL-2 in E2A-PBX1 (green) and MLL-AF4 (red) patients. Each point represents one patient or normal sample; the bar is the average value. ***p < 0.001, *p < 0.05. (C–E) ChIP in MLL-AF4 siRNA treated SEM cells (colored) compared with control (black) using antibodies to H3K27Ac, H3K79me3, or DOT1L. Bars represent the averages of three independent experiments; error bars are SD.

References

    1. Smith M.A., Altekruse S.F., Adamson P.C., Reaman G.H., Seibel N.L. Declining childhood and adolescent cancer mortality. Cancer. 2014;120:2497–2506. - PMC - PubMed
    1. Pui C.H., Evans W.E. A 50-year journey to cure childhood acute lymphoblastic leukemia. Semin Hematol. 2013;50:185–196. - PMC - PubMed
    1. Oriol A., Vives S., Hernandez-Rivas J.M. Outcome after relapse of acute lymphoblastic leukemia in adult patients included in four consecutive risk-adapted trials by the PETHEMA Study Group. Haematologica. 2010;95:589–596. - PMC - PubMed
    1. Ko R.H., Ji L., Barnette P. Outcome of patients treated for relapsed or refractory acute lymphoblastic leukemia: A Therapeutic Advances in Childhood Leukemia Consortium study. J Clin Oncol. 2010;28:648–654. - PMC - PubMed
    1. Schultz K.R., Pullen D.J., Sather H.N. Risk- and response-based classification of childhood B-precursor acute lymphoblastic leukemia: A combined analysis of prognostic markers from the Pediatric Oncology Group (POG) and Children's Cancer Group (CCG) Blood. 2007;109:926–935. - PMC - PubMed

Publication types

MeSH terms