. 2017 Feb;113(2):147-159.
doi: 10.1093/cvr/cvw221. Epub 2016 Nov 17.

Loss of AKAP150 promotes pathological remodelling and heart failure propensity by disrupting calcium cycling and contractile reserve

Affiliations

Loss of AKAP150 promotes pathological remodelling and heart failure propensity by disrupting calcium cycling and contractile reserve

Lei Li et al. Cardiovasc Res. 2017 Feb.

Abstract

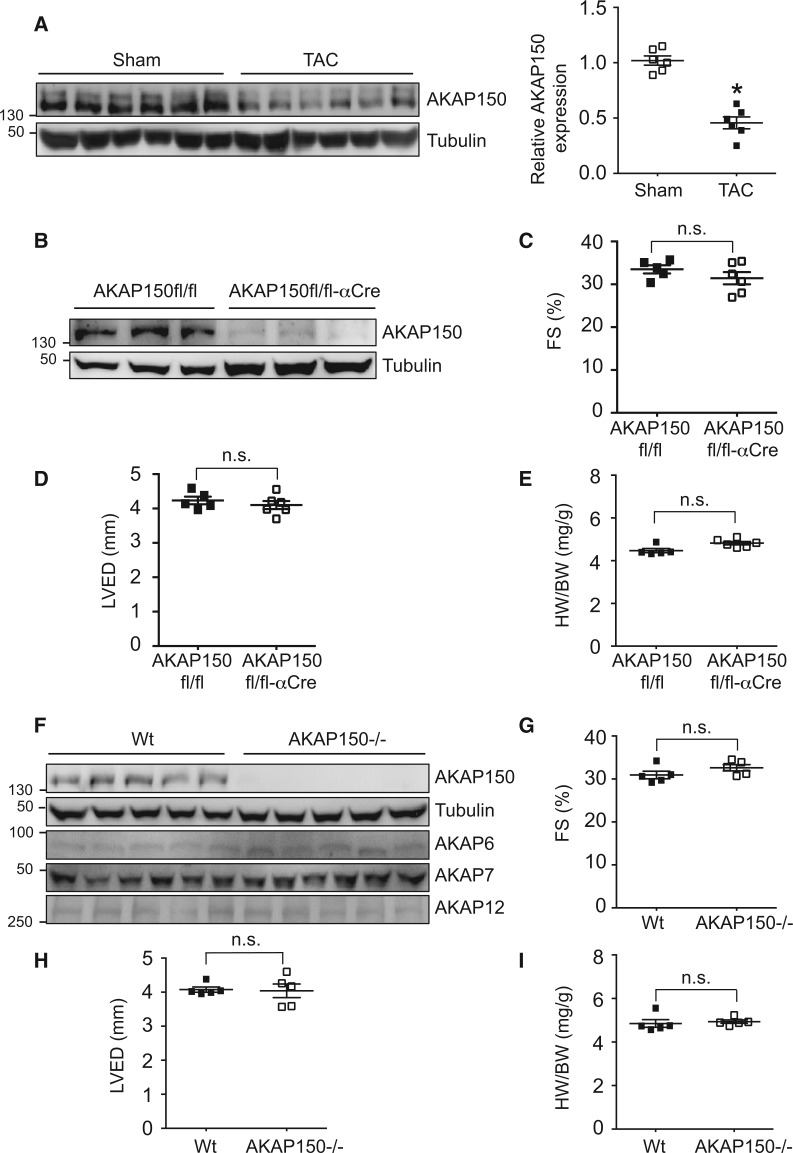
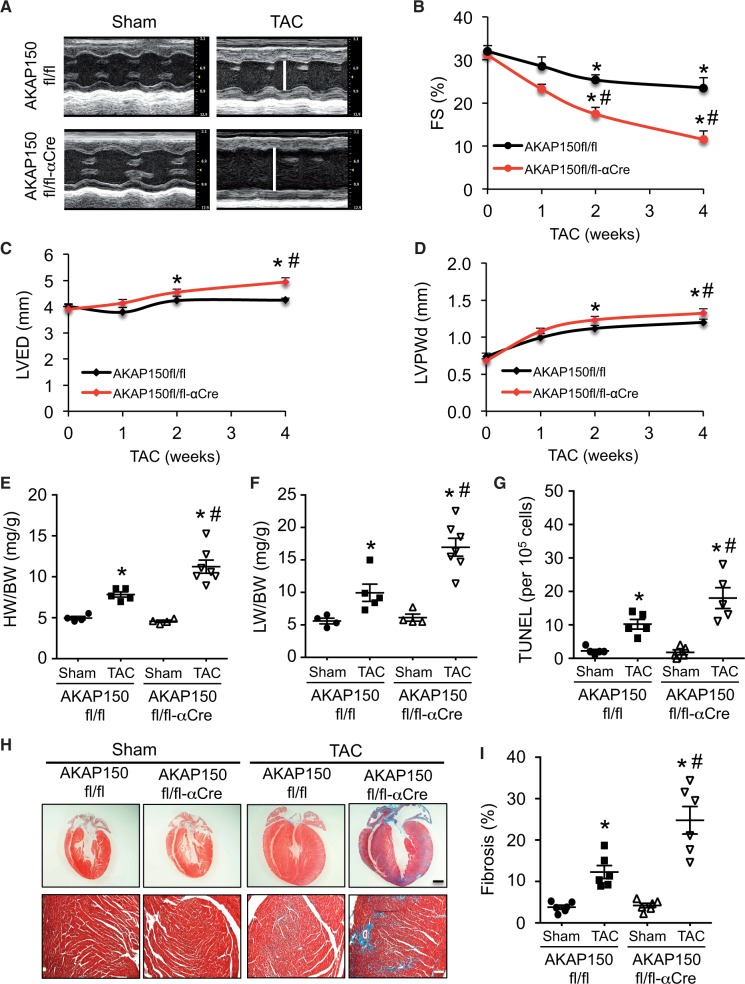
Aims: Impaired Ca2 + cycling and myocyte contractility are a hallmark of heart failure triggered by pathological stress such as hemodynamic overload. The A-Kinase anchoring protein AKAP150 has been shown to coordinate key aspects of adrenergic regulation of Ca2+ cycling and excitation-contraction in cardiomyocytes. However, the role of the AKAP150 signalling complexes in the pathogenesis of heart failure has not been investigated.

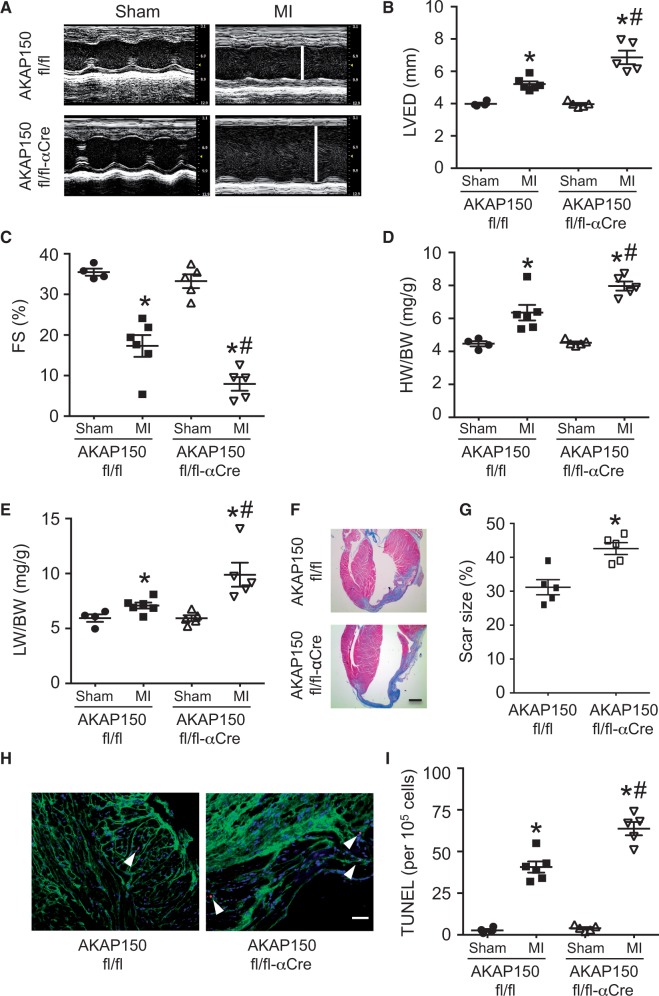
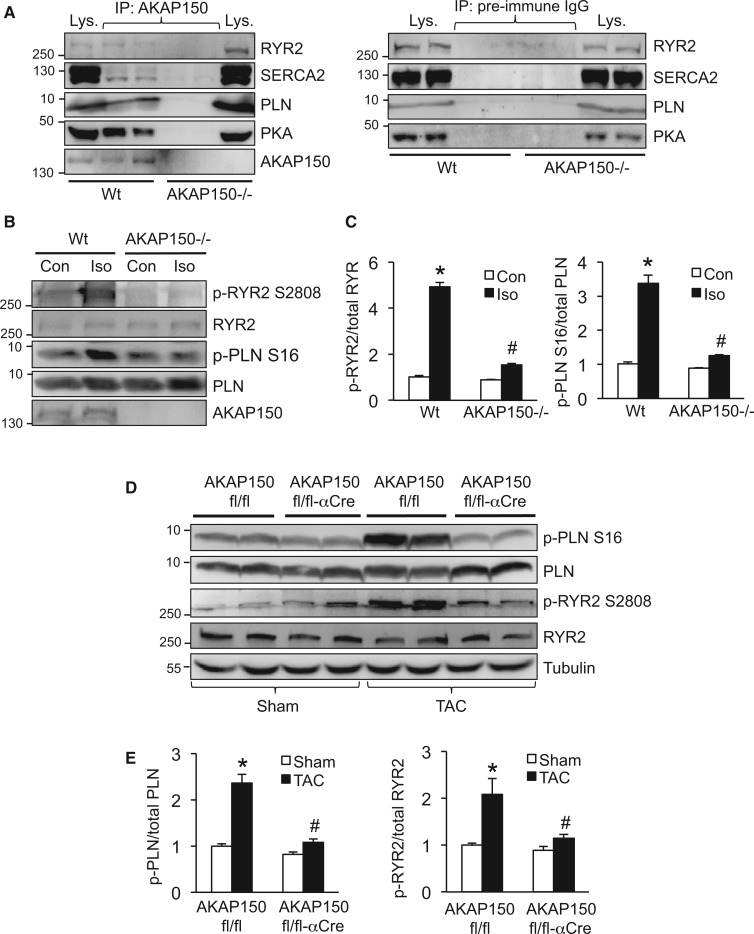
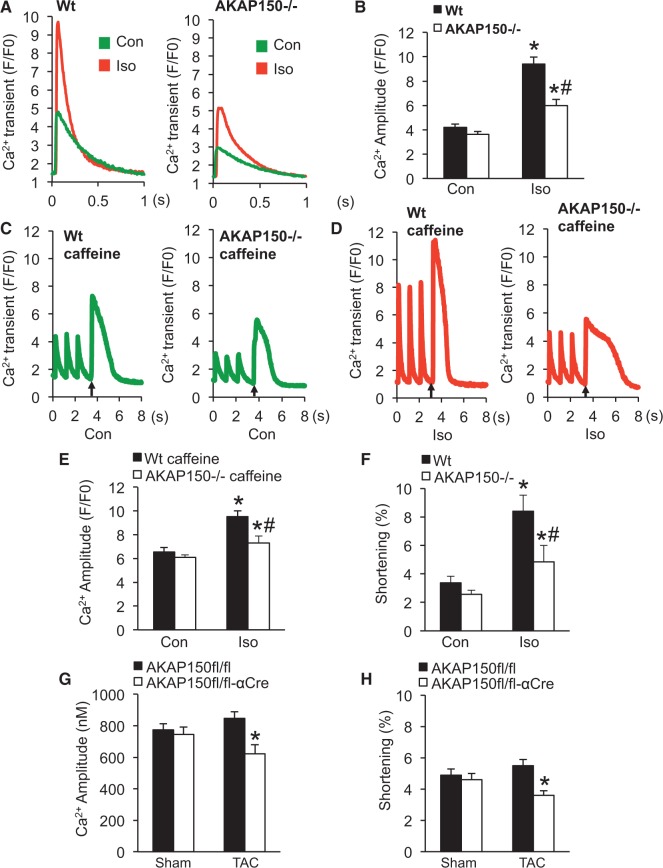
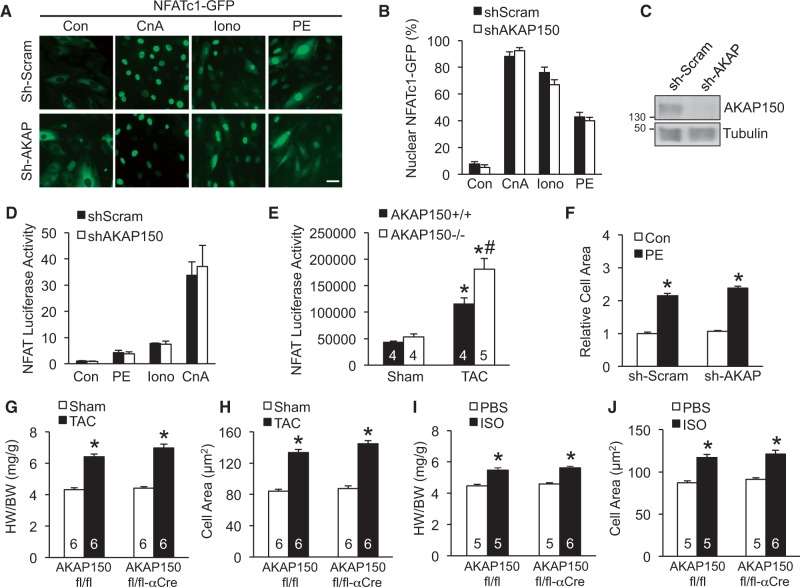
Methods and results: Here we examined how AKAP150 signalling complexes impact Ca2+ cycling, myocyte contractility, and heart failure susceptibility following pathological stress. We detected a significant reduction of AKAP150 expression in the failing mouse heart induced by pressure overload. Importantly, cardiac-specific AKAP150 knockout mice were predisposed to develop dilated cardiomyopathy with severe cardiac dysfunction and fibrosis after pressure overload. Loss of AKAP150 also promoted pathological remodelling and heart failure progression following myocardial infarction. However, ablation of AKAP150 did not affect calcineurin-nuclear factor of activated T cells signalling in cardiomyocytes or pressure overload- or agonist-induced cardiac hypertrophy. Immunoprecipitation studies showed that AKAP150 was associated with SERCA2, phospholamban, and ryanodine receptor-2, providing a targeted control of sarcoplasmic reticulum Ca2+ regulatory proteins. Mechanistically, loss of AKAP150 led to impaired Ca2+ cycling and reduced myocyte contractility reserve following adrenergic stimulation or pressure overload.

Conclusions: These findings define a critical role for AKAP150 in regulating Ca2+ cycling and myocardial ionotropy following pathological stress, suggesting the AKAP150 signalling pathway may serve as a novel therapeutic target for heart failure.

Keywords: AKAP150; Cardiac hypertrophy; Contractility; Heart failure; Pathological remodelling.


Figures

Figure 1
Figure 1
Assessment of AKAP150 expression after TAC and characterization of cardiac-specific and global AKAP150 knockout mice. (A) Western blotting and quantification of AKAP150 expression in cardiac extracts from wild-type mice subjected to TAC (27-gauge) or sham surgery for 4 weeks. n = 6 for each group. P <0.05. (B) Western blots for the indicated proteins in cardiac extracts from AKAP150fl/fl and AKAP150fl/fl-αCre mice at two months of age. (C), (D), and (E) Echocardiographic assessment of FS, LVED, and HW/BW ratio from AKAP150fl/fl or AKAP150fl/fl-αCre mice at two months of age. n = 5 for each group. n.s. indicates non-significance. (F) Western blots for the indicated proteins in cardiac extracts from wild-type (Wt) and AKAP150-/- mice at two months of age. (G), (H), and (I) Assessment of FS, LVED, and HW/BW from Wt or AKAP150-/- mice at two months of age. n = 5 for each group. n.s. indicates non-significance. Mann–Whitney U-test was used.
Figure 2
Figure 2
AKAP150-deficient mice are predisposed to adverse cardiac remodelling and dysfunction following pressure overload. (A) Representative echocardiographic M-mode images from AKAP150fl/fl and AKAP150fl/fl-αCre mice subjected to TAC (27-gauge) or a sham procedure for 4 weeks. The vertical white lines indicate LVED. (B), (C), and (D) FS, LVED, and left ventricular posterior wall thickness (LVPWd) from mice indicated in A. *P <0.05 vs. corresponding Sham. #P <0.05 vs. AKAP150fl/fl TAC. (E) and (F) HW/BW ratio and LW/BW ratio from mice indicated in A. *P <0.05 vs. corresponding Sham. #P <0.01 vs. Con TAC. (G) Quantification of TUNEL-positive nuclei in cardiac sections from mice indicated in A. (H) Masson trichrome-stained heart sections from the indicated mice subjected to sham surgery or TAC. Scale bars: top, 1 mm; bottom, 50 μm. (I) Quantitation of cardiac fibrotic area of cardiac sections from mice indicated in G. *P <0.01 vs. corresponding Sham. #P <0.05 vs. AKAP150fl/fl TAC. n = 4 for AKAP150fl/fl Sham; n = 5 AKAP150fl/fl TAC; n = 4 for AKAP150fl/fl-αCre Sham; n = 7 for AKAP150fl/fl-αCre TAC. Kruskal–Wallis test was used to compare each parameter. Post-hoc Mann–Whitney U-test with Bonferroni’s correction was then performed.
Figure 3
Figure 3
Loss of AKAP150 promotes pathological remodelling and heart failure progression after MI. (A) Representative echocardiographic M-mode images from AKAP150fl/fl and AKAP150fl/fl-αCre mice subjected to MI or a sham procedure for 2 weeks. The vertical white lines indicate left ventricular end-diastolic dimension (LVED). (B) and (C) Echocardiographic analysis of LVED and FS in AKAP150fl/fl and AKAP150fl/fl-αCre mice subjected to sham or MI surgical procedure for 2 weeks. *P <0.05 vs. corresponding Sham. #P <0.05 vs. AKAP150fl/fl MI. (D) and (E) HW/BW and LW/BW from mice indicated in B. *P <0.05 vs. corresponding Sham. #P <0.05 vs. AKAP150fl/fl MI. (F) and (G) Masson’s trichrome-stained cardiac sections and quantitation of infarct size from AKAP150fl/fl and AKAP150fl/fl-αCre mice subjected to MI or sham procedure for 2 weeks. Scale bars, 1 mm. *P <0.05 vs. AKAP150fl/fl. (H) and (I) Representative images and quantification of TUNEL-positive nuclei from peri-infarct areas in cardiac sections from AKAP150fl/fl or AKAP150fl/fl-αCre mice subjected to 2 weeks of MI. Arrow head indicates TUNEL-positive nucleus (red). Scale bars, 50 μm. *P <0.01 vs. corresponding Sham. #P <0.05 vs. AKAP150fl/fl MI. n = 4 for AKAP150fl/fl Sham; n = 6 AKAP150fl/fl MI; n = 5 for AKAP150fl/fl-αCre Sham; n = 5 for AKAP150fl/fl-αCre MI. Kruskal-Wallis test followed by Post-hoc Mann–Whitney U-test with Bonferroni’s correction was used.
Figure 4
Figure 4
AKAP150 is a critical regulator of cardiac calcium handling proteins in response to adrenergic stimulation or pressure overload. (A) Western blots for the indicated proteins following immunoprecipitation (IP) with an AKAP150 antibody (left panel) or pre-immune IgG (right panel) from cardiac extracts of wild-type (Wt) or AKAP150-/- mice. (B) Western blots for the indicated proteins from Wt or AKAP150-/- cardiomyocytes treated with isopreterenol (Iso, 100 nmol/l) or vehicle control for 5 min. (C) Quantification of phosphorylation level of RYR2 (left) and PLN (right) from mice indicated in B. *P <0.01 vs. Con. #P <0.05 vs. Wt Iso. Data were obtained from three independent experiments. (D) Western blots for the indicated proteins from cardiac extracts of AKAP150fl/fl or AKAP150fl/fl-αCre mice subjected to TAC (27-gauge) or a sham procedure for 1 week. (E) Quantification of phosphorylation level of PLN (left) and RYR2 (right) from mice indicated in D. *P <0.05 vs. Sham. #P <0.05 vs. AKAP150fl/fl TAC. Data were obtained from three independent experiments. Kruskal–Wallis test followed by post-hoc Mann–Whitney U-test was used.
Figure 5
Figure 5
Loss of AKAP150 decreases the amplitude of the [Ca2+]i transient, SR Ca2+ load, and contractility following adrenergic stimulation or pressure overload. (A) Representative tracings of field stimulation-induced Ca2+ transient from wild-type (Wt) and AKAP150-/- cardiomyocytes in the presence or absence of isoproterenol (Iso). (B) Quantification of Ca2+ amplitude as a change in fluorescence (F/F0) from Wt and AKAP150-/- cardiomyocytes in the presence or absence of Iso. (C) Representative tracings of caffeine-induced Ca2+ transient in Wt and AKAP150-/- cardiomyocytes treated with vehicle control. Three field stimulations were performed to ensure a steady state of SR Ca2+ load followed by caffeine stimulation indicated by arrow. (D) Representative tracings of caffeine-induced Ca2+ transients in Wt and AKAP150-/- cardiomyocytes treated with Iso. (E) Quantification of the amplitude of the caffeine induced Ca2+ transient in Wt or AKAP150-/- cardiomyocytes treated with vehicle control or Iso. *P <0.05 vs. corresponding Con. #P <0.05 vs. Wt Iso. (F) Cell shortening of Wt and AKAP150-/- cardiomyocytes treated with vehicle control or Iso. *P <0.05 vs. corresponding Con. #P <0.05 vs. Wt Iso. (G) and (H) Ca2+ amplitude (nM) and cell shortening in cardiomyocytes isolated from AKAP150fl/fl or AKAP150fl/fl-αCre mice subjected to TAC (27-gauge) or a sham procedure for 1 week. *P <0.05 vs. AKAP150fl/fl TAC. n ≥ 50 adult myocytes were analysed from four separate mice in each group. Two-way nested ANOVA with Tukey’s post-hoc analysis was used to determine statistical significance in these experiments.
Figure 6
Figure 6
AKAP150 is dispensable for cardiac hypertrophy response and the activation of calcineurin-NFAT signalling. (A) Fluorescent images from cardiomyocytes infected with lentiviruses expressing AKAP150 shRNA (shAKAP) or a scrambled sequence (shScram) along with adenoviruses encoding NFATc1-GFP (green), followed by stimulation with 1 μmol/l ionomycin (Iono), 50 μmol/l phenylephrine (PE), or vehicle control (Con) or infection with an adenovirus encoding active calcineurin (CnA). Scale bars, 10 μm. (B) Quantification of nuclear localized NFATc1 in cells treated as indicated in A. Data were from 3 independent experiments with ≥ 200 cells analysed. (C) Western blot for AKAP150 and tubulin from cardiomyocyte extracts indicated in A. (D) NFAT-luciferase activity in the indicated cardiomyocytes infected with shAKAP or shScram lentiviruses along with adenoviruses expressing NFAT-luciferase reporter, followed by stimulation with PE, Iono, or vehicle control, or infection with CnA adenoviruses. Data were from three independent experiments. (E) NFAT luciferase activity in relative fluorescence units from AKAP150+/+ and AKAP150-/- mice containing the NFAT luciferase reporter transgene after 2 weeks of TAC or a sham procedure. *P <0.05 vs. Sham. #P <0.05 vs. AKAP150+/+ TAC. (F) Surface areas of cardiomyocyte infected with shAKAP or shScram lentiviruses followed by stimulation with 50 μmol/l PE or vehicle control for 24 h. *P <0.05 vs. corresponding Sham. Data were from 3 independent experiments with ≥ 200 cells analysed. (G) Assessment of HW/BW ratio from AKAP150fl/fl and AKAP150fl/fl-αMHC-Cre mice subjected to TAC (27-gauge) or sham procedure for 1 week. *P <0.05 vs. corresponding Sham. (H) Myocyte surface area from cardiac sections of mice indicated in G. Surface areas of 500 cells per mouse were measured in random fields. *P <0.05 vs. corresponding Sham. (I) HW/BW from AKAP150fl/fl and AKAP150fl/fl-αMHC-Cre mice subjected to isoproterenol (ISO) or phosphate-buffered saline (PBS) infusion for 2 weeks. *P <0.05 vs. corresponding Sham. (J) Myocyte surface area from cardiac sections of mice indicated in I. The number of mice analysed is shown in the bars of each panel. *P <0.05 vs. corresponding Sham. Data were analysed by Kruskal-Wallis test followed by Post-hoc Mann–Whitney U-test with Bonferroni’s correction.

Similar articles

Cited by

References

    1. Xiang Y, Kobilka BK. Myocyte adrenoceptor signaling pathways. Science 2003;300:1530–1532. - PubMed
    1. Bers DM. Cardiac excitation-contraction coupling. Nature 2002;415:198–205. - PubMed
    1. Layland J, Solaro RJ, Shah AM. Regulation of cardiac contractile function by troponin I phosphorylation. Cardiovasc Res 2005;66:12–21. - PubMed
    1. Scott JD, Santana LF. A-kinase anchoring proteins: getting to the heart of the matter. Circulation 2010;121:1264–1271. - PMC - PubMed
    1. Mauban JR, O'Donnell M, Warrier S, Manni S, Bond M. AKAP-scaffolding proteins and regulation of cardiac physiology. Physiology 2009;24:78–87. - PMC - PubMed

MeSH terms